Fibonacci Trading

Imagine that you are trying to measure one swing against another swing.
How would you go about doing that?
Most folks would use the trendline tool to compare the previous swing's high to low distance.
Now, you move over to the current swing, and you measure this one's distance.
After you've done the math, use the price level drawing tool, to draw a horizontal line where the Fibonacci Extensions would be drawn.
And that's just for one swing... imagine repeating that process for all of the different swings on a chart!
The Fibonacci Extensions Tool makes this a much simpler process.
What are Fibonacci Extensions?
Fibonacci Extensions are a tool used to predict possible support and resistance levels for any market, by comparing previous price moves to the current one.
Similar to the Fibonacci Retracements Tool, the Fibonacci Extensions Tool:
- Can be used with any timeframe, or in any market
- Helps traders make decisions on profit target placement
- Gives an idea of where the price may go if a new high or low is reached
- Can be used to find areas of possible interest
- Find clusters of Fibonacci levels that indicate a significant price area
When used correctly, the Extensions tool can be a very helpful addition to any trader’s toolkit.
Fibonacci Extensions vs. Retracements
The two ThinkOrSwim Fibonacci tools that we've discussed so far - Fibonacci Extensions and Fibonacci Retracements - each have their unique use cases.

- The Fibonacci Retracements Tool uses 2 inputs, and is useful in providing a Roadmap of likely support and resistance areas, while price retraces its steps.
- The Fibonacci Extensions Tool uses 3 inputs, and is useful as a ruler, to Extrapolate and compare previous swings with the current swing, and find any overlapping patterns.
Both of these tools are useful in their own right, and can be used together to provide a more complete picture of an underlying's price action.
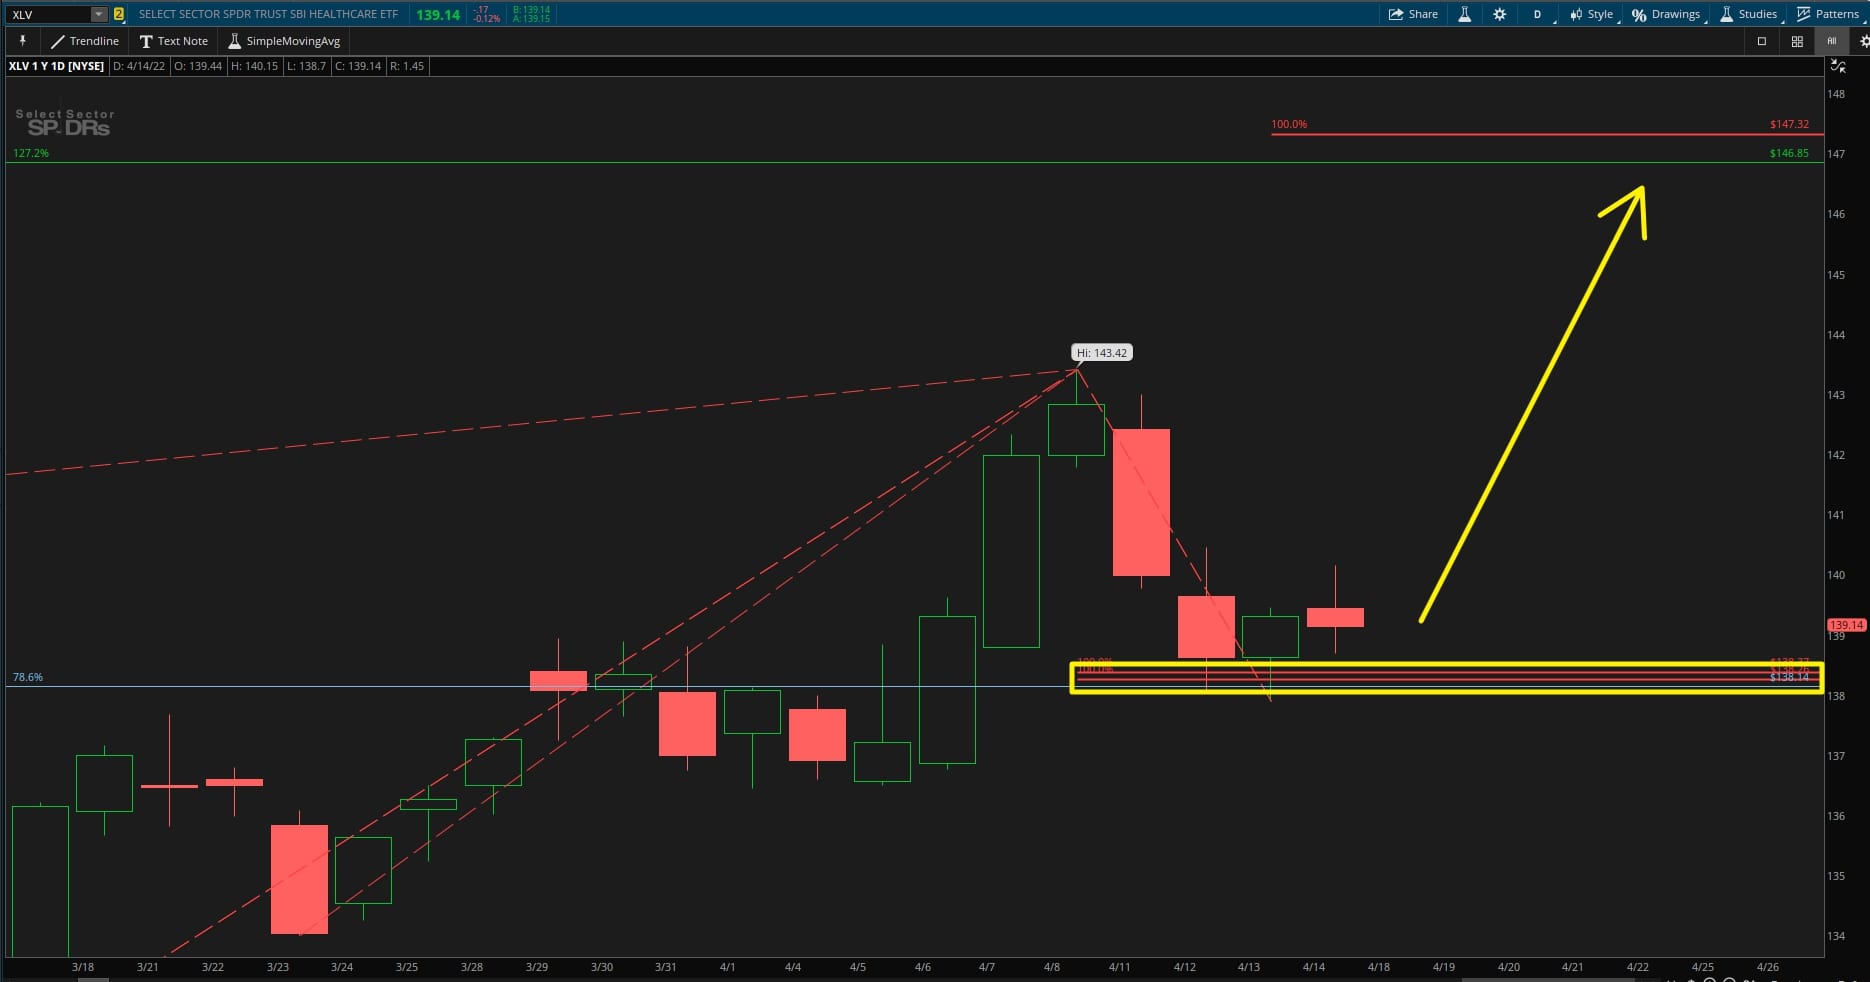
When we do have an overlap between the two sets of Fibonacci levels, that forms the beginnings of a Fibonacci cluster.
The more Fibonacci lines that overlap within the cluster zone, the stronger the cluster zone is to hold.
How to Use Fibonacci Extensions
Now that we know what Fibonacci Extensions are, let's discuss how we can use them.
The Extensions tool takes 3 different inputs:
- Previous Swing High / Low
- Previous Swing Low / High
- Current Swing High / Low
Your inputs will change, based on if you are looking to extrapolate support or resistance zones.
For example, in an UPTREND...
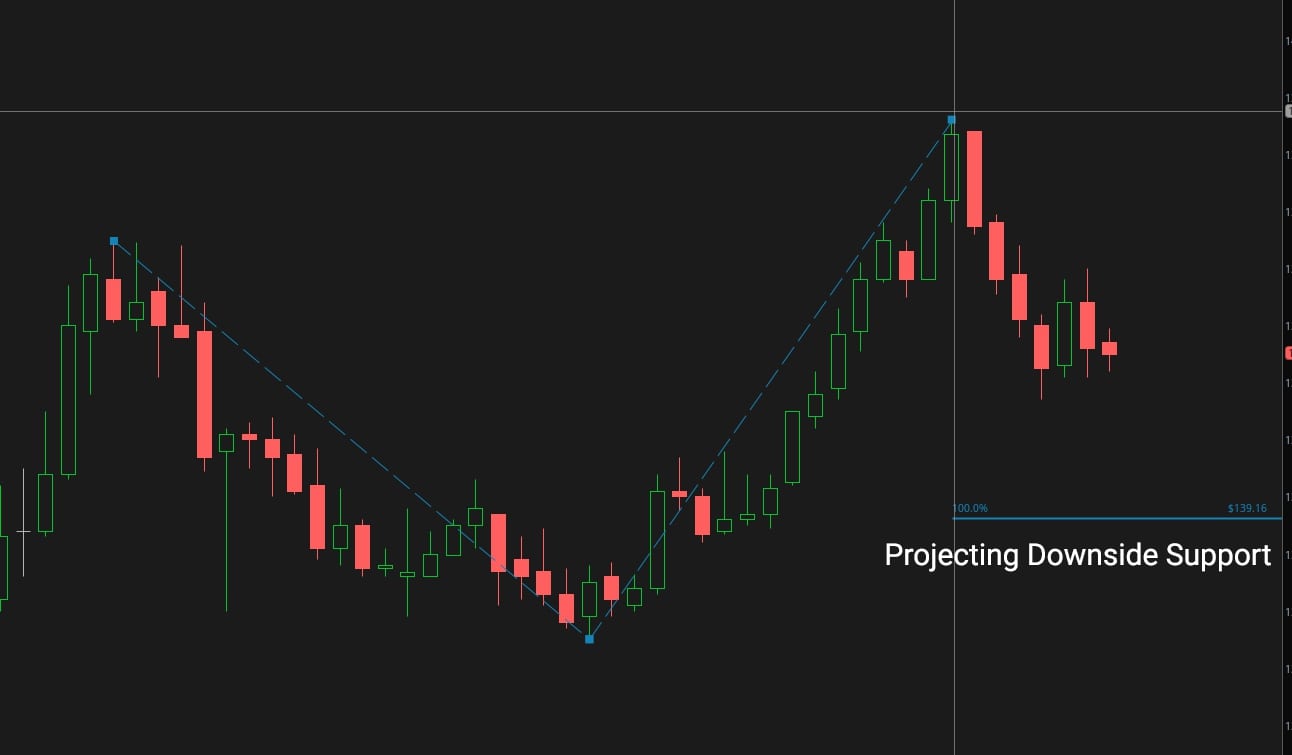
If you were looking to extrapolate DOWNSIDE SUPPORT zones to buy into:
- Your first input would be a swing high
- Your second input would be a swing low
- Your third input would be the current swing's high
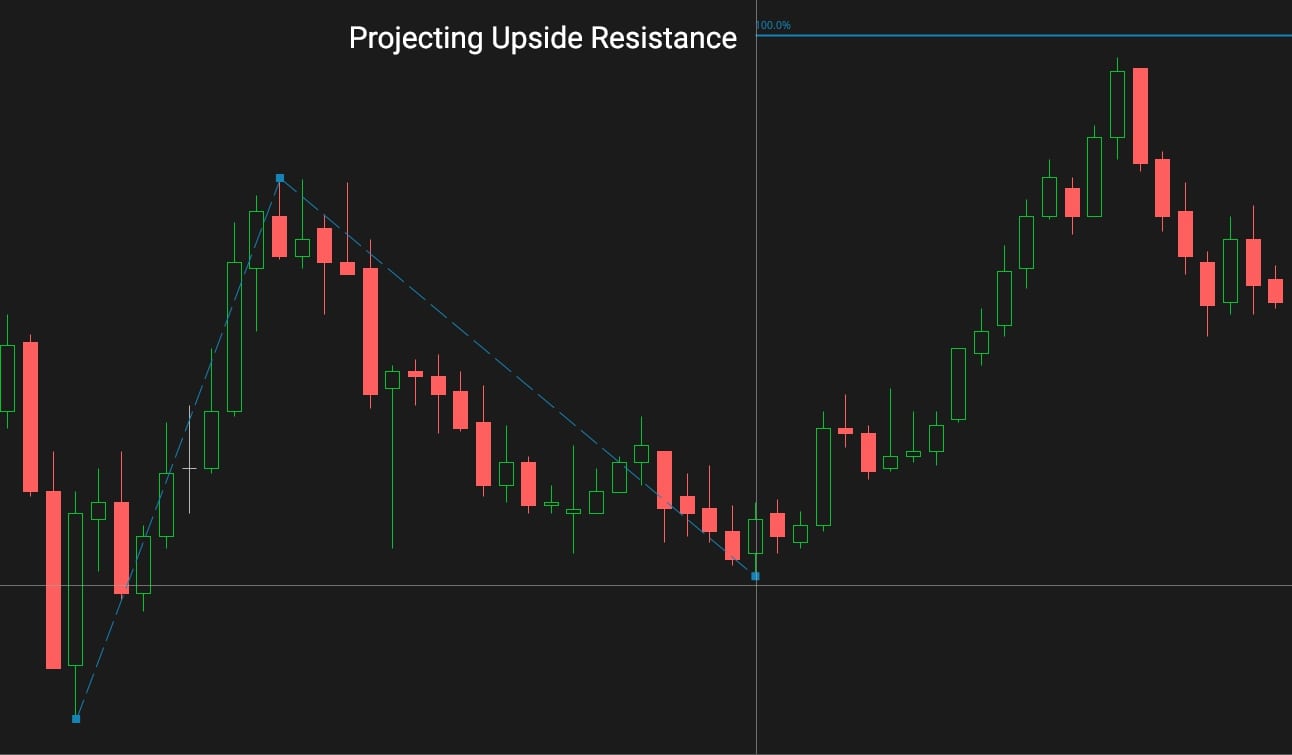
If you were looking to extrapolate UPSIDE RESISTANCE zones to take profits:
- Your first input would be a swing low
- Your second input would be a swing high
- Your third input would be the current swing's low
If you were instead, in a DOWNTREND...
If you were looking to extrapolate UPSIDE SUPPORT zones to short into:
- Your first input would be a swing low
- Your second input would be a swing high
- Your third input would be the current swing's low
If you were looking to extrapolate DOWNSIDE RESISTANCE zones to take profits:
- Your first input would be a swing high
- Your second input would be a swing low
- Your third input would be the current swing's high
You can find 4 different examplese of how to use the Fibonacci Extensions Tool in the tutorial video located above.
Conclusion
In the next section, we'll bring together the Fibonacci Retracements and Fibonacci Extensions tools to create our own cluster zones.
Here's what we've learned so far...
- In Part 1, we broke down the Fibonacci Sequence, and connected it to trading, through the use of Fibonacci ratios.
- In Part 2, we plugged those ratios into the Fibonacci Retracements Tool, and how it can be used to create a roadmap for price, providing areas of support and resistance.
- And, in this section (Part 3), we discussed the Fibonacci Extensions Tool, and how it can be used to project support/resistance levels.
Now that we have a good understanding of these two tools, let's put them together and find high-probability Fibonacci cluster zones.


