Fibonacci Trading

What are Fibonacci Retracements?
Fibonacci Retracements is a technical analysis tool that can be used to identify potential support and resistance levels, using just a swing high and swing low. These levels serve as a useful roadmap for price action to navigate, as it retests old high's and low's.
The Fibonacci Retracements tool uses key Fibonacci ratios mentioned earlier (0.236, 0.382, 0.500, 0.618, 0.786, 1.272, 1.618) to create horizontal lines that correspond to these ratios.
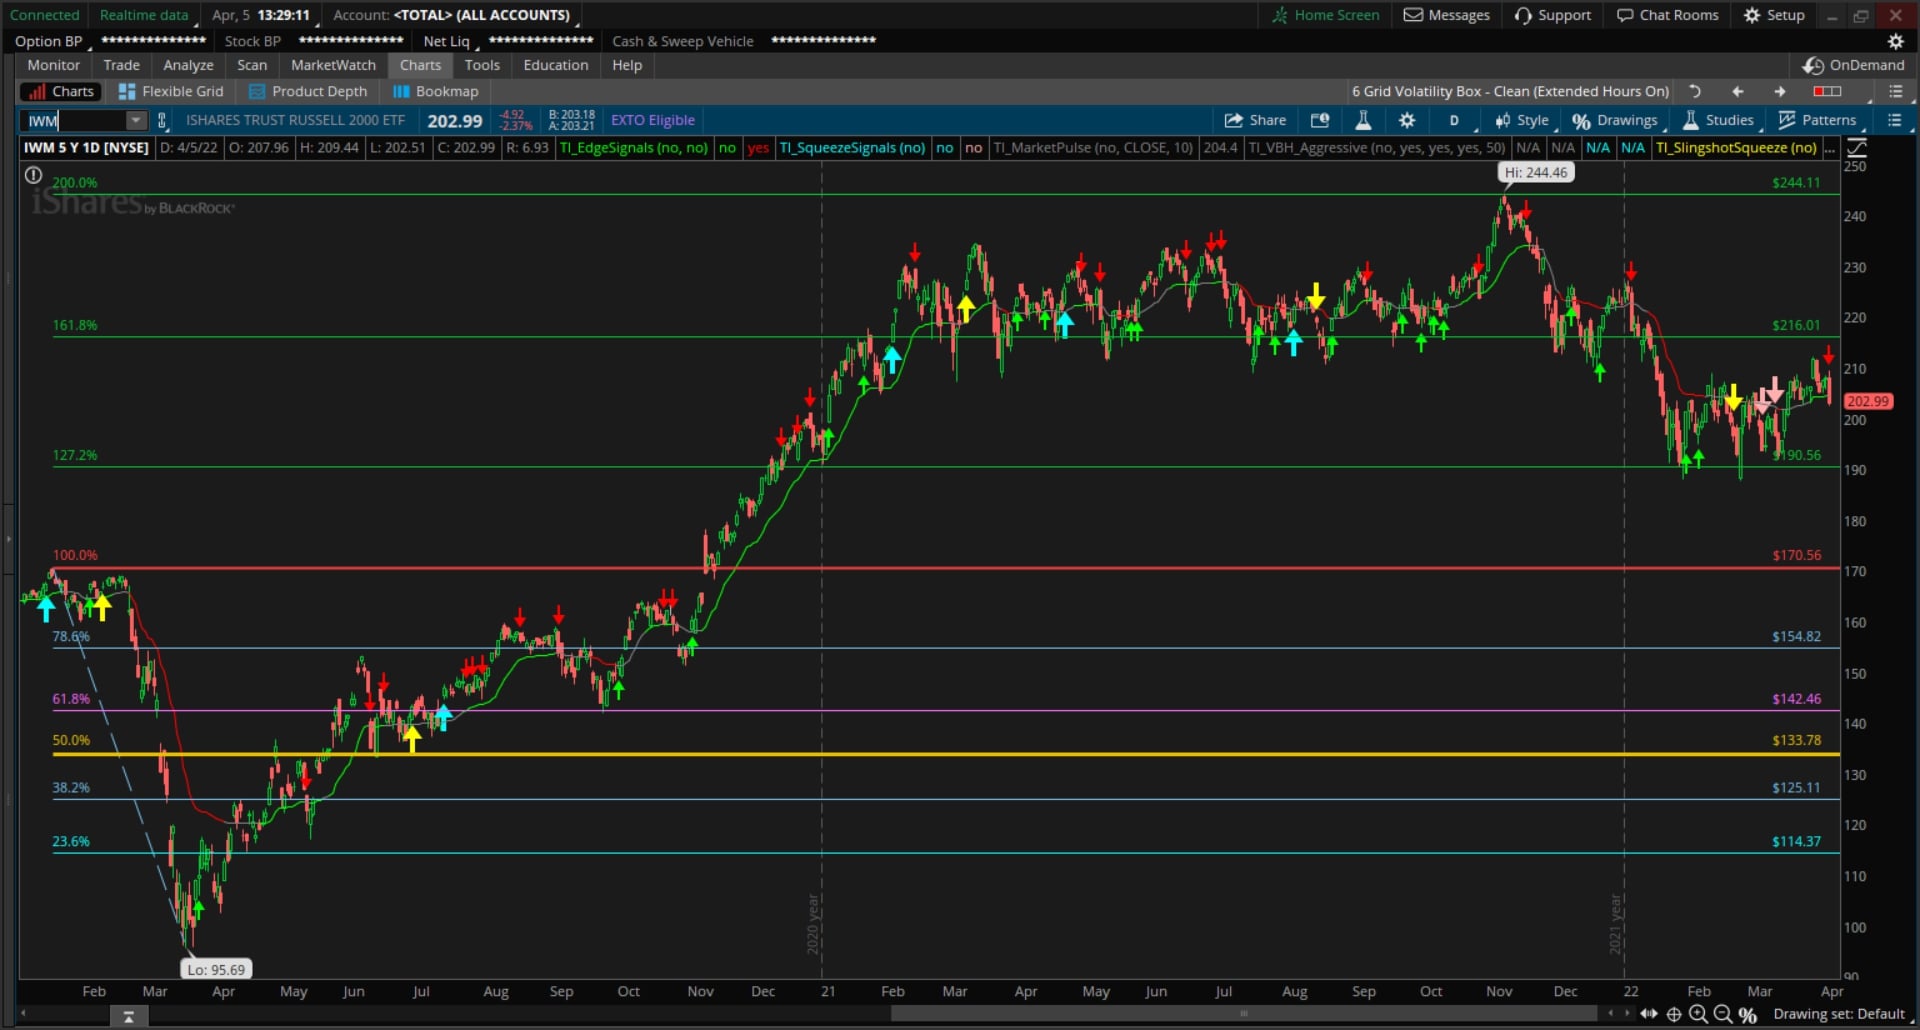
Let's take a look at an example of the Feb - March 2020.
In the example below, we can see we have used the highest point of a recent swing as our starting value. The end value is the swing low, which was the bottom of the March decline.

You can see how price has tagged each one of the Fibonacci Ratios, and paused for at least a few bars, before making a move away from the level.
This is a very strong indication that these Fibonacci Ratios are acting as support levels, and the market is likely to continue to respect them.
Any confluences with Fibonacci Extension levels add "greater weightage", and form what we refer to as a "Fibonacci Cluster."
How Are The Price Levels for Each Ratio Calculated?
The price levels are calculated by multiplying the difference between the swing high and swing low, with the corresponding Fibonacci ratio for that level. This final value is then added to the swing low price, to provide a corresponding price level for that Fibonacci Ratio.
Let's take a look at an example...
Swing High = $120
Swing Low = $100
Difference Between Swing High and Swing Low = $120 - $100 = $20
- 0.236 Ratio = $100 + (($20)(0.236)) = $104.72
- 0.382 Ratio = $100 + (($20)(0.382)) = $107.64
- 0.500 Ratio = $100 + (($20)(0.500)) = $110.00
- 0.618 Ratio = $100 + (($20)(0.618)) = $112.36
- 0.786 Ratio = $100 + (($20)(0.786)) = $115.72
- 1.272 Ratio = $100 + (($20)(1.272)) = $125.44
- 1.618 Ratio = $100 + (($20)(1.618)) = $132.36
Here's an example of those same ratios, calculated using the Fibonacci Retracements Tool in ThinkOrSwim:

As you can see, the two sets of levels line up. The Fibonacci Retracements Tool is a quick, and easy way to let ThinkOrSwim perform the (fairly simple) arithmetic for you.
All you need are 2 input points to calculate the different levels, based on the Fibonacci Ratios.
How to Use Fibonacci Retracements?
Now that we know how the price levels are calculated using the Fibonacci Ratios, let's take a look at how you can easily draw the levels on your chart.

- Navigate to the "Charts" tab
- Select "Drawings"
- Select "Drawing Tools"
- Select the icon that looks like a percentage icon (without any other lines)
- Click on the swing high that you would like to use
- Click on the swing low that you would like to use
- Voila!
The Fibonacci price levels corresponding to each of the ratios in this swing should automatically plot.
If you are looking for bearish (downside) price levels, you can start by clicking on the swing low, and then click the swing high after, which will lead the 1.272 and 1.618 extensions to be projected downward.
Fibonacci Retracement Tool Settings
There are a few different settings you can customize for the Fibonacci Retracements Tool in ThinkOrSwim.
I've shared what works well for me below, but feel free to customize the colors and line weights, based on your personal preferences.

For me, I like to have 8 ratios loaded on by default, each with its own set of color groupings. For example, all of the price projections (1.272, 1.618, and 2.00) ratios are grouped together to plot a green line, with a weight of 1.
I like to easily see the 50% retracement level of any swing (aka the halfway mark), so I make the 0.500 ratio a bright yellow.
These are the settings I have for each one of the 8 ratios:
- 0.236 - cyan line, weight 1
- 0.382 - light blue, weight 1
- 0.500 - yellow, weight 3
- 0.618 - magenta, weight 1
- 0.786 - light blue, weight 1
- 1.272 - green, weight 1
- 1.618 - green, weight 1
- 2.000 - green, weight 1
Example of Using Fibonacci Retracements
Fibonacci Retracements can be used in a few different ways.
The 2 main ways that I personally use Fibonacci Retracements are:
- Project potential support and resistance levels, based on prior swings in price
- Find targets beyond previous high's and low's, using the 1.272 and 1.618 ratios
Potential Support and Resistance Levels
The main way that I use Fibonacci Retracements, is to project potential support and resistance levels.
This is based on the idea that prices often retrace back to key Fibonacci ratios after making a move in either direction.
For example, after prices have made a significant move upwards, it is not uncommon for there to be a retracement back down to the 0.382 or 0.500 level, before prices continue moving higher again.

The same is true for moves lower. After a significant move down, prices often retrace back up to key Fibonacci price levels before resuming the downtrend.
Fibonacci Retracements can be used to help you anticipate where these potential support and resistance levels might be, and craft trades around these levels.
Targets Beyond Previous Highs and Lows
The 1.272 and 1.618 Fibonacci ratios can also be used to find targets for trades, beyond the previous swing high or low.
For example, if prices are in an uptrend and make a new high, you can use the 1.272 Fibonacci ratio to project a target for where prices might pause and "exhaust" near, before potentially resuming the uptrend.
This projected target level can then be used as a potential place to take profits, or even as an updated stop loss level, after price exceeds it.
The Golden Ratio is the next major level, which tends to act as a magnet for price action to gravitate towards.
Fibonacci Retracements vs Fibonacci Extensions
Fibonacci Retracements and Fibonacci Extensions are two separate tools, each with its own purpose.

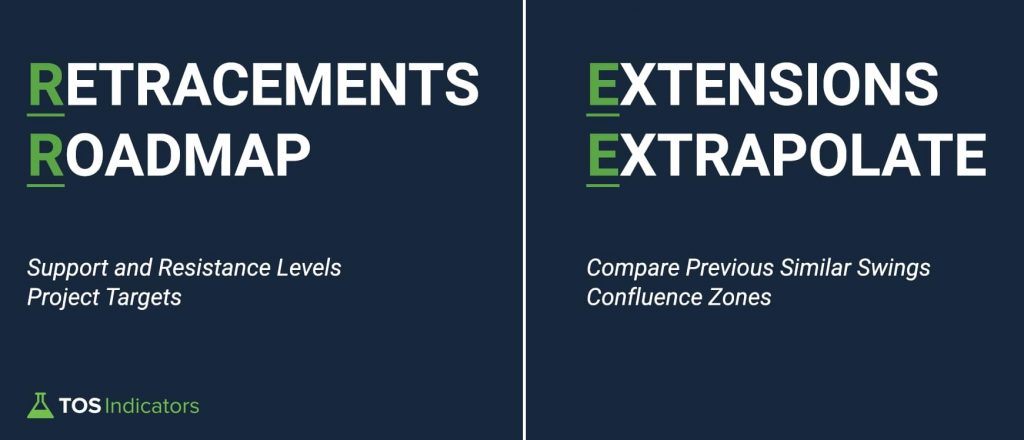
- Fibonacci Retracements provides you with a Roadmap for support and resistance zones as price navigates between the previous swing high and low
- Fibonacci Extensions allow you to Extrapolate previous swings with the current one and find zones where you expect price to reverse
While Fibonacci Retracements and Extensions can both be used to find potential support and resistance levels, they each have a different purpose and a method of getting to the end result.
In the next section, we'll explore the Fibonacci Extensions tool!


