
How to Trade Earnings
Learn how to trade earnings with 3 simple strategies, and tools that make earnings season your best friend.
What You'll Learn
- How to trade earnings with options?
- How to identify common pre-earnings patterns?
- When to buy vs. sell premium for earnings?
- How to trade earnings AFTER report is released?
- How often gaps are filled on earnings beats and misses?
Master Every Phase of Earnings
A complete system for trading before, during, and after earnings announcements
Pre-Earnings
Identify patterns leading into earnings for quick gains
- Price momentum into earnings
- IV expansion patterns
- Optimal entry timing
- Historical win rates by stock
Day of Earnings
Ready-to-go cheat sheet for earnings day volatility
- Gap and Go vs. Gap Fill patterns
- Expected move calculations
- Beat vs. miss reactions
- Intraday reversal setups
Post-Earnings
Post-earnings price and volatility analysis in seconds
- 7, 14, 30-day patterns
- Gap fill probabilities
- Continuation setups
- IV crush opportunities
Earnings Course Module
Complete deep-dive on earnings trading strategies

How to Trade Earnings
A comprehensive deep-dive on how to trade earnings with options, covering Pre-Earnings, Post-Earnings, and Day of Earnings strategies.
Earnings Trading Patterns by Stock
Every stock has its own "earnings personality" - discover the patterns that repeat
Learn How to Trade Earnings
Master earnings trading with our complete video library
How to Trade Earnings With Options: Complete Guide
3 simple strategies to trade earnings like a pro - the full 54-minute course
How to Trade the Day of Earnings
Using the Smarter Earnings indicator on earnings day
How to Trade Earnings Volatility
A simple process to take advantage of earnings-related volatility
Pre-Earnings Indicator for ThinkOrSwim
Identify which stocks move big before earnings and when to enter
How to Trade Earnings: Pre, Post and Day Analysis (JNJ)
Complete earnings breakdown using pre-earnings, post-earnings, and day of earnings analysis
How To Scan for Upcoming Earnings in ThinkOrSwim
Two ways to scan for upcoming earnings within ThinkOrSwim
Stock Earnings Deep Dives
Detailed earnings analysis for the most popular stocks
Nvidia Earnings Patterns After a Beat
Two trading strategies for NVDA after an earnings beat using 5-15 year historical data
Will Nvidia Follow Its Post-Earnings Pattern?
NVDA post-earnings analysis: 7, 14, 30, and 60-day patterns after reporting
NVDA Earnings Patterns
- Post-earnings beat continuation
- 7-day and 14-day patterns
- Gap and Go tendencies
Microsoft Earnings - Low-Risk Options Trade
Microsoft has predictable earnings patterns - here's one options trade idea
Microsoft Q3 Earnings Analysis
Will MSFT fill its gap post-earnings or continue trending up?
MSFT Earnings Day Trading Analysis
Using the Smarter Earnings indicator to analyze MSFT price behavior
MSFT Earnings - Options Trade Idea
Pre-earnings patterns and options trade setup for Microsoft
MSFT Earnings Patterns
- Gap and Go on beats
- Predictable IV patterns
- Options premium strategies
Will TSLA Follow its 7-Day Post-Earnings Pattern?
Breaking down TSLA's unique post-earnings patterns 7, 14, and 30 days out
Take Advantage of TSLA's Post-Earnings Volatility
Simple intraday levels strategy for TSLA post-earnings moves
TSLA Pre-Earnings Patterns
Finding pre-earnings tendencies 3 days prior to TSLA earnings
TSLA Earnings Patterns
- 7-day post-earnings pattern
- High IV expansion
- Intraday volatility plays
GOOGL Earnings Patterns
Two different patterns to trade GOOGL stock into earnings
GOOGL Earnings Patterns
- Fibonacci level confluences
- Pre-earnings momentum
- Day of earnings setups
AAPL and AMZN Earnings Day Analysis
Using the Smarter Earnings indicator for AAPL and AMZN post-earnings
AAPL Earnings Patterns
- Gap fill vs. continuation
- Beat/miss reaction patterns
- Expected move analysis
VISA Earnings: 93% Win-Rate Gap Pattern
20 years of earnings gap analysis reveals a pattern that works 93% of the time
V Earnings Patterns
- 93% historical win-rate
- Gap down reversal setup
- 20-year pattern analysis
Walt Disney (DIS) Earnings Analysis
Post-earnings pattern in DIS that has worked 8 earnings cycles in a row
DIS Earnings Patterns
- 7 vs 14 vs 30-day moves
- Consistent post-earnings patterns
- Swing trade opportunities
AAPL and AMZN Earnings Day Analysis
Using the Smarter Earnings indicator for post-earnings price behavior
AMZN Earnings Patterns
- High expected move stocks
- Gap behavior analysis
- Post-earnings momentum
JNJ Earnings: Pre, Post and Day Analysis
Complete earnings breakdown using 5 years of historical data
JNJ Earnings Patterns
- Defensive stock patterns
- Lower volatility plays
- Consistent dividend payer
CrowdStrike Pre-Earnings Volatility
Multiple TTM Squeezes combined with pre-earnings momentum
CRWD Earnings Patterns
- High IV expansion
- Squeeze + earnings combo
- Tech sector momentum
UNH Earnings Probabilities
Using probability analysis to prepare for healthcare earnings
UNH Earnings Patterns
- Gap and Go tendencies
- Sector correlation
- Healthcare earnings plays
BA Pre-Earnings Patterns
Finding pre-earnings patterns in Boeing using price and volatility
BA Earnings Patterns
- Industrial sector patterns
- News-driven volatility
- Pre-earnings momentum
IBM Earnings Gap Analysis
Gap N Go patterns after IBM earnings announcements
IBM Earnings Patterns
- Legacy tech patterns
- Dividend stock behavior
- Post-earnings trends
What is Earnings Trading?
Earnings trading is the practice of taking positions in stocks or options around quarterly earnings announcements. When companies report their financial results, stock prices often experience significant volatility - creating opportunities for prepared traders.
The key to successful earnings trading is understanding that each stock has its own "earnings personality." Some stocks consistently gap up on beats, others fill their gaps, and some follow predictable patterns in the days and weeks after reporting.
Why Trade Earnings?
- High volatility creates larger profit potential in shorter timeframes
- Predictable event timing allows for strategic position planning
- Options strategies can profit from volatility itself, not just direction
- Historical patterns provide data-driven edge for trade decisions
- IV expansion before earnings creates premium selling opportunities
Three Approaches to Earnings Trading
Pre-Earnings Trading: Many stocks exhibit predictable price and implied volatility behavior in the 3-10 days before reporting earnings. Our Pre-Earnings indicator analyzes historical data to show you which stocks tend to run up (or down) before announcements, and how often IV expands into the event.
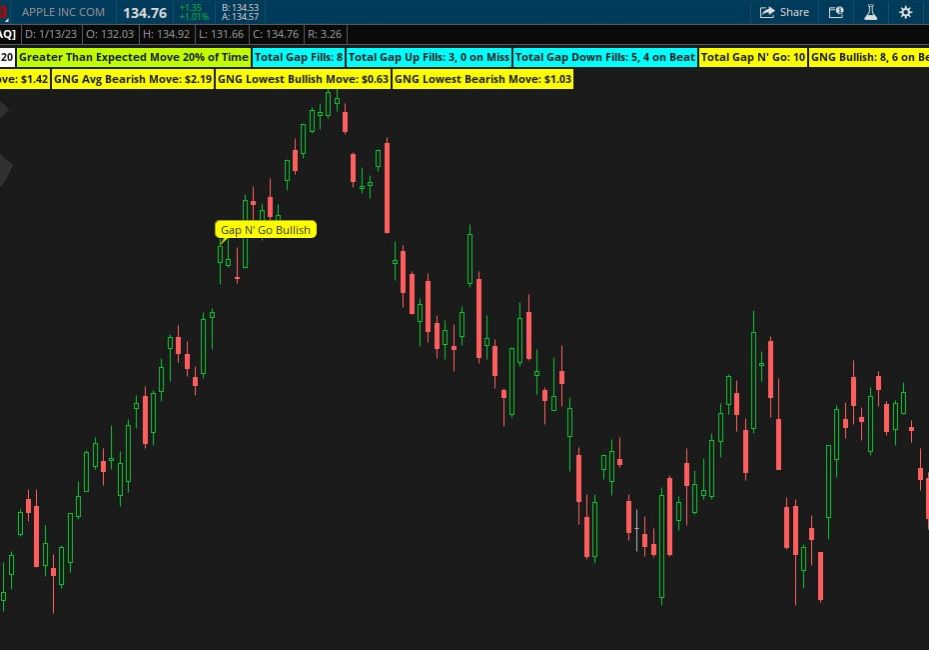
Day of Earnings Trading: The Smarter Earnings indicator helps you understand what typically happens on earnings day. Does the stock usually gap up or down? Does it fill the gap or continue trending? What's the average move size on beats vs. misses? This data helps you position for the most probable outcome.
Post-Earnings Trading: Some of the best opportunities come in the days and weeks after earnings. Our Post-Earnings indicator shows you 7-day, 14-day, and 30-day patterns, helping you identify continuation or reversal setups based on historical behavior.
Earnings Trading Tools for ThinkOrSwim
We've built three earnings indicators specifically for ThinkOrSwim traders:
- Smarter Earnings (Free): Analyzes gap behavior, beat/miss patterns, and expected moves
- Pre-Earnings Analysis (Pro): Shows price momentum and IV patterns before announcements
- Post-Earnings Analysis (Pro): Tracks 7, 14, and 30-day patterns after reporting
Profit From Earnings Volatility
Join the Stock Volatility Box membership for instant access to the pre-earnings and post-earnings analysis indicators for ThinkOrSwim.
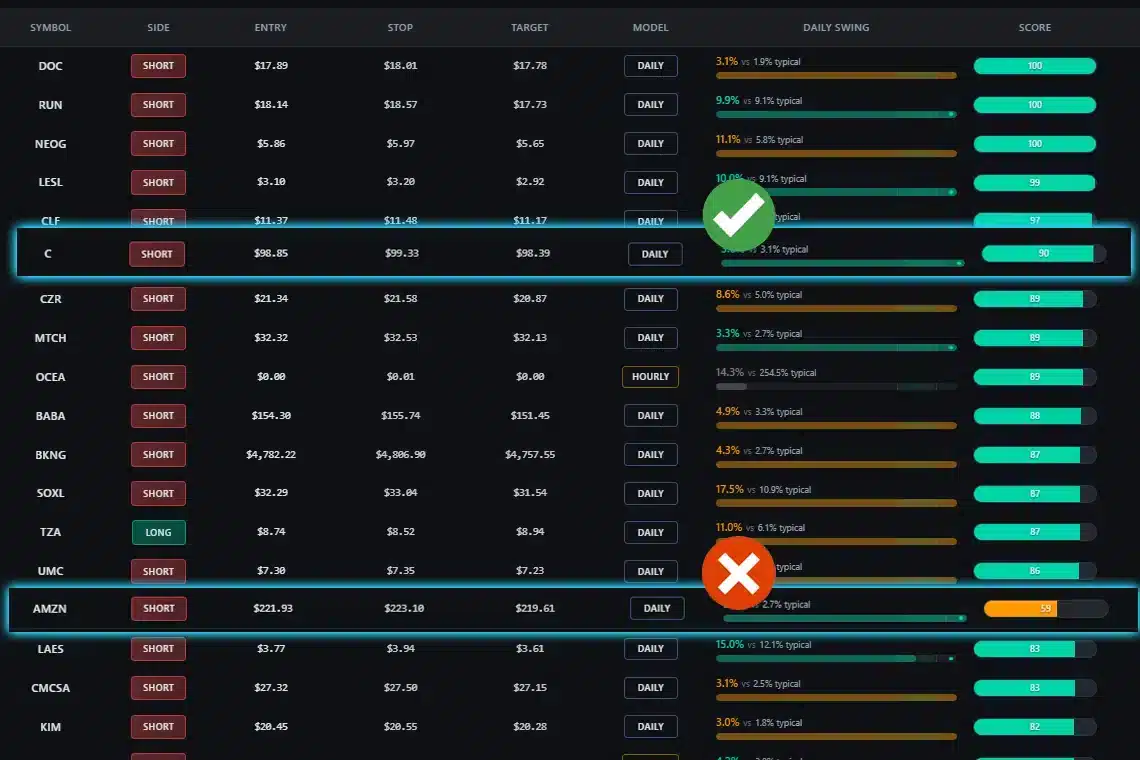
You can also use the Live Scanner inside of the Stock Volatility Box platform to find earnings volatility setups, that are breaching our Conservative VB volatility models.
Explore Stock Volatility PlatformHigh-Probability Strategies That Are Easy to Follow
"Man this was good. Thanks so much!!!!"
"Excellent. One of the best "how to plays earnings" videos on YT. Well-defined repeatable process. Thanks."
"Great free alternative to the CML trade machine to see this directly inside of ThinkOrSwim."
"This is exactly what I needed. The pre-earnings indicator alone is worth so much more than free."
"Finally understand why some earnings plays work and others don't. The data-driven approach makes all the difference."
"Used the gap fill pattern on MSFT earnings and it worked perfectly. These indicators are game changers."
Frequently Asked Questions
Commonly Asked Questions About Our Earnings Course
You'll learn three complete strategies for trading earnings: Pre-Earnings (trading the run-up before announcements), Day of Earnings (trading the immediate reaction), and Post-Earnings (capitalizing on patterns after the report). Each strategy includes specific entry rules, risk management, and real examples.
This course is designed for intermediate traders who have basic knowledge of options and ThinkOrSwim. However, the step-by-step approach and free indicators make it accessible for motivated beginners ready to learn earnings trading.
You'll learn: (1) Pre-Earnings momentum trades using IV expansion, (2) Gap and Go vs. Gap Fill patterns for day-of-earnings, (3) Post-earnings continuation and reversal setups, and (4) How to use options to define risk during earnings volatility.
Yes! The Smarter Earnings indicator is completely free for everyone. Volatility Box members also get access to the Pre-Earnings and Post-Earnings Analysis indicators at no additional cost.
The entire earnings course is 100% free. You can access all modules, download the free Smarter Earnings indicator, and start trading earnings immediately.
The main course module is approximately 1 hour of in-depth content. We also have dozens of supplementary videos covering specific stocks and scenarios.
Absolutely. The course includes detailed walkthroughs of each indicator, how to install them, customize settings, and interpret the signals for your trading decisions.
The course covers IV expansion and contraction around earnings, helping you decide when to buy premium (before IV crush) vs. sell premium (to profit from IV crush), and how to identify mispriced options.
We cover directional plays (calls/puts), defined-risk strategies (spreads, butterflies), and premium-selling approaches. The focus is on matching the right strategy to each earnings scenario.
Using the Smarter Earnings indicator, you can see historical patterns for any stock: gap fill percentages, trend continuation rates, average move sizes on beats vs. misses, and more.