
TTM Squeeze Strategy for ThinkOrSwim
Squeeze trading for ThinkOrSwim: a full course, free ThinkScript indicators, backtesters, and 130+ tutorial videos.
What is the TTM Squeeze?
The TTM Squeeze, created by John Carter, is a volatility and momentum indicator that identifies when Bollinger Bands contract inside Keltner Channels. This "squeeze" condition signals that volatility is compressing and price is likely to make an explosive move when the bands expand.
How It Works
The indicator has two main components:
- Squeeze Dots. Red dots appear when Bollinger Bands are inside Keltner Channels (squeeze is "on"). Green dots appear when bands expand outside (squeeze "fires"). This signals the transition from low to high volatility.
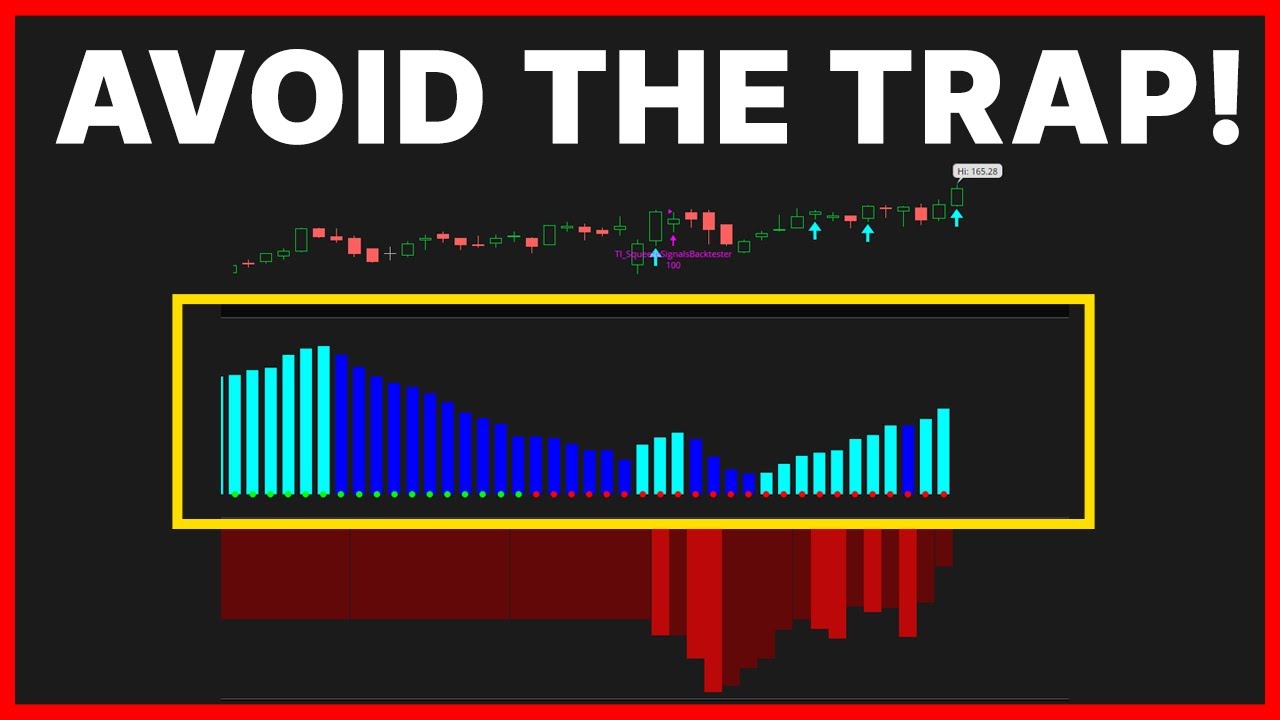
- Momentum Histogram. Shows the direction and strength of momentum. Rising bars above zero suggest bullish momentum; falling bars below zero suggest bearish momentum.
Key Trading Signals
- Green dot = the squeeze fired. It is not a buy by itself; direction comes from the histogram
- Our Slingshot setup enters while the stock is still in the squeeze and exits when it fires
- Multiple timeframe squeeze alignment = Strongest setups
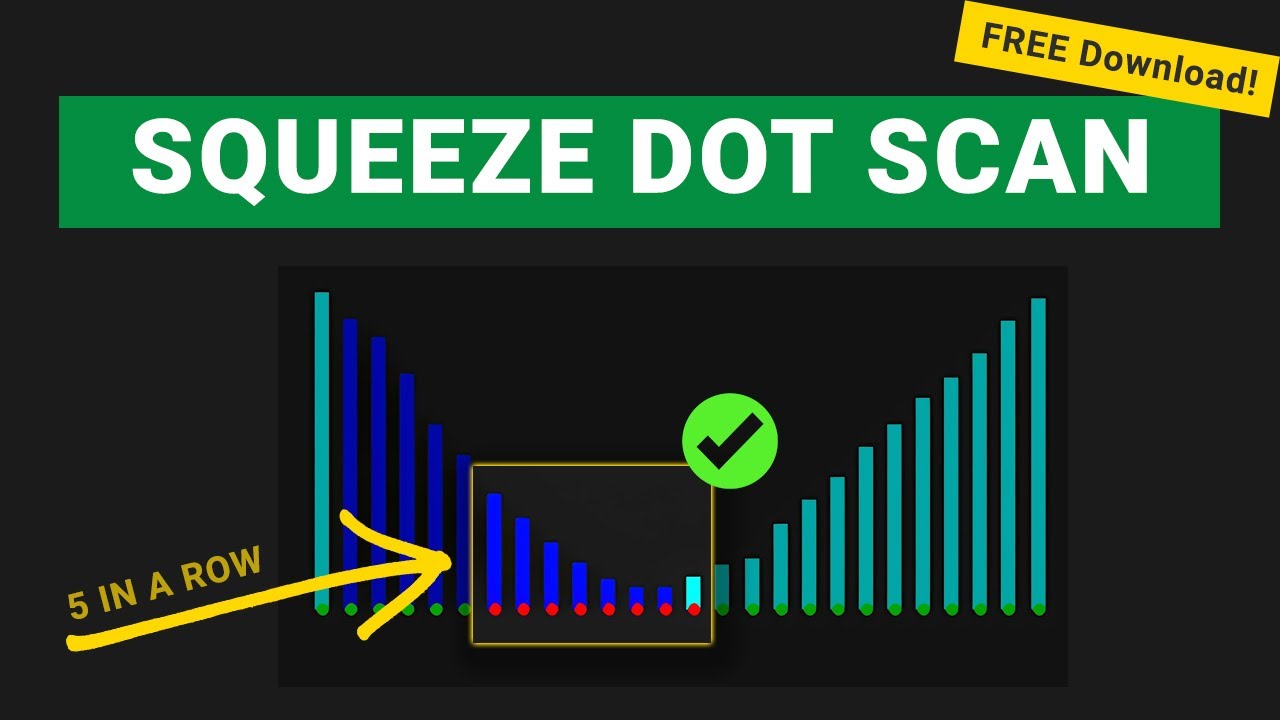
- Consecutive red dots (5+) often precede larger moves
- Triple Pro Squeeze grades the squeeze: yellow (tightest), red (normal), black (loosest)
TTM Squeeze Tutorials
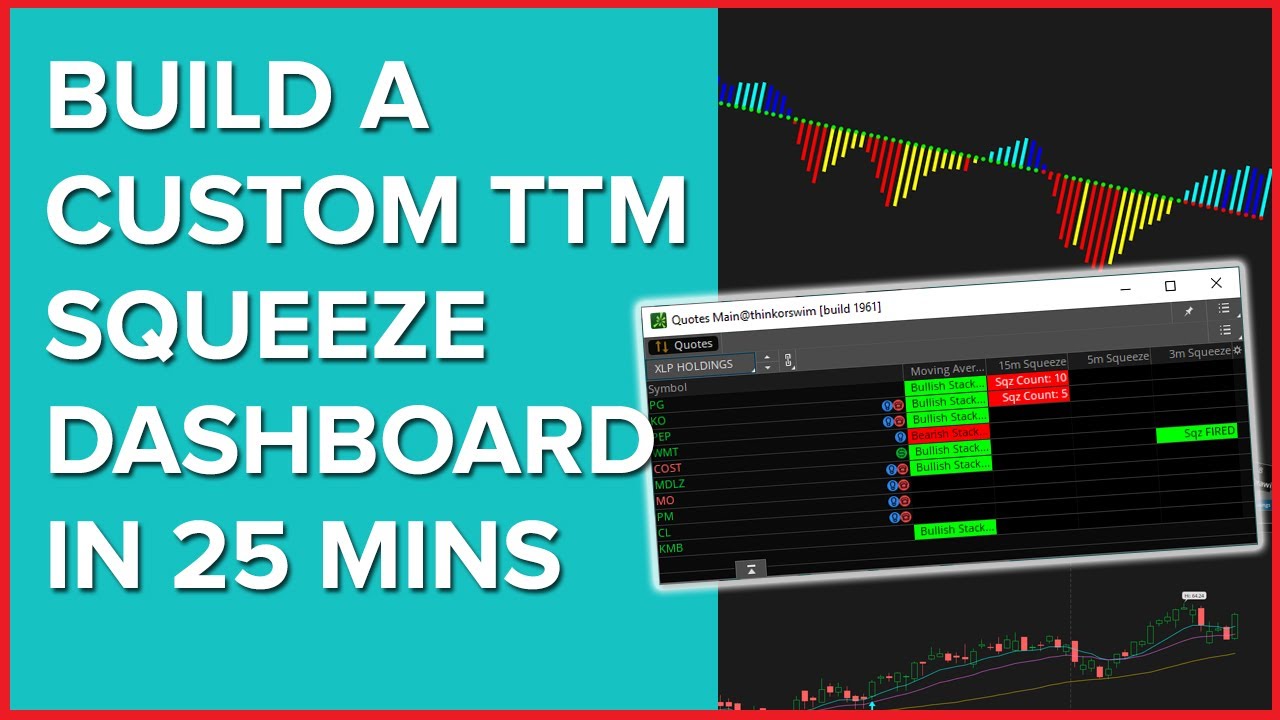
Learn to build custom squeeze indicators, backtesters, and dashboards for ThinkOrSwim.

Free TTM Squeeze Indicators
Download our free ThinkScript indicators to enhance your squeeze trading. Each indicator includes a step-by-step video tutorial.
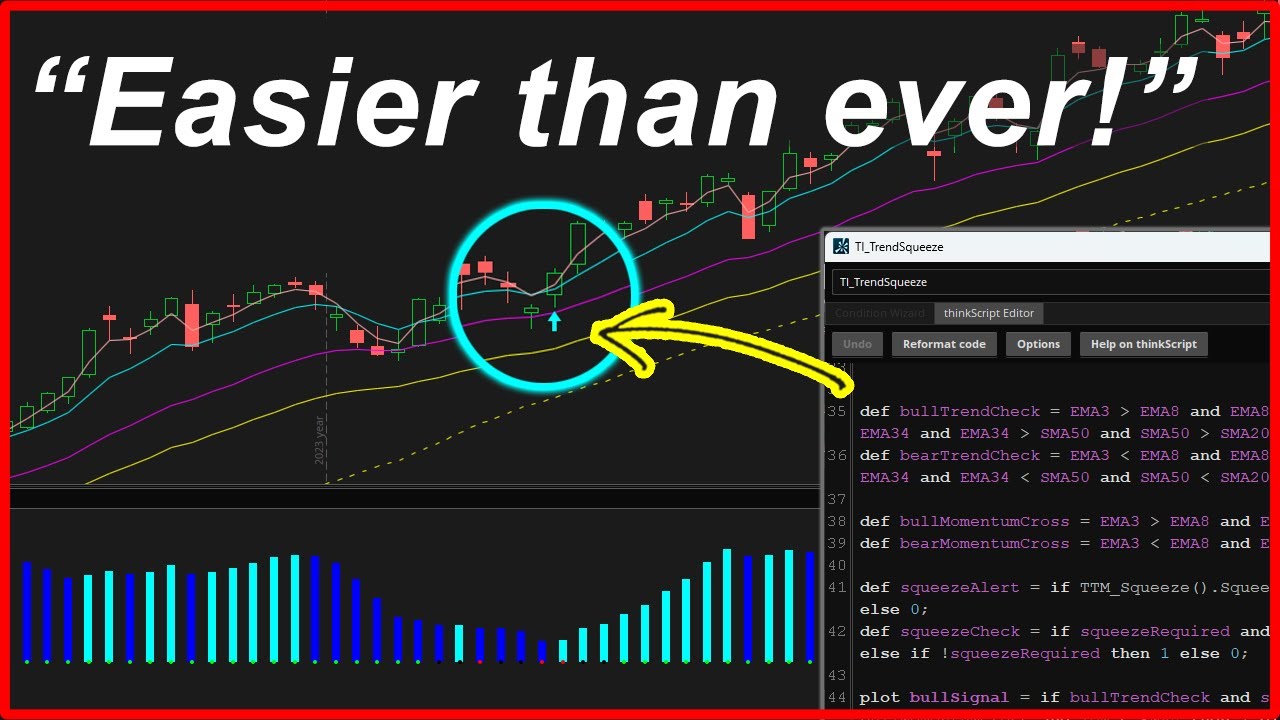
Trend Squeeze Indicator
Identify the best squeeze setups in trending markets. Combines squeeze detection with trend analysis for higher probability trades.
Download Free →TTM Squeeze Dots Scan
Find five consecutive squeeze dots (red, black, yellow) combined with stacked moving averages. Bullish and bearish scans included.
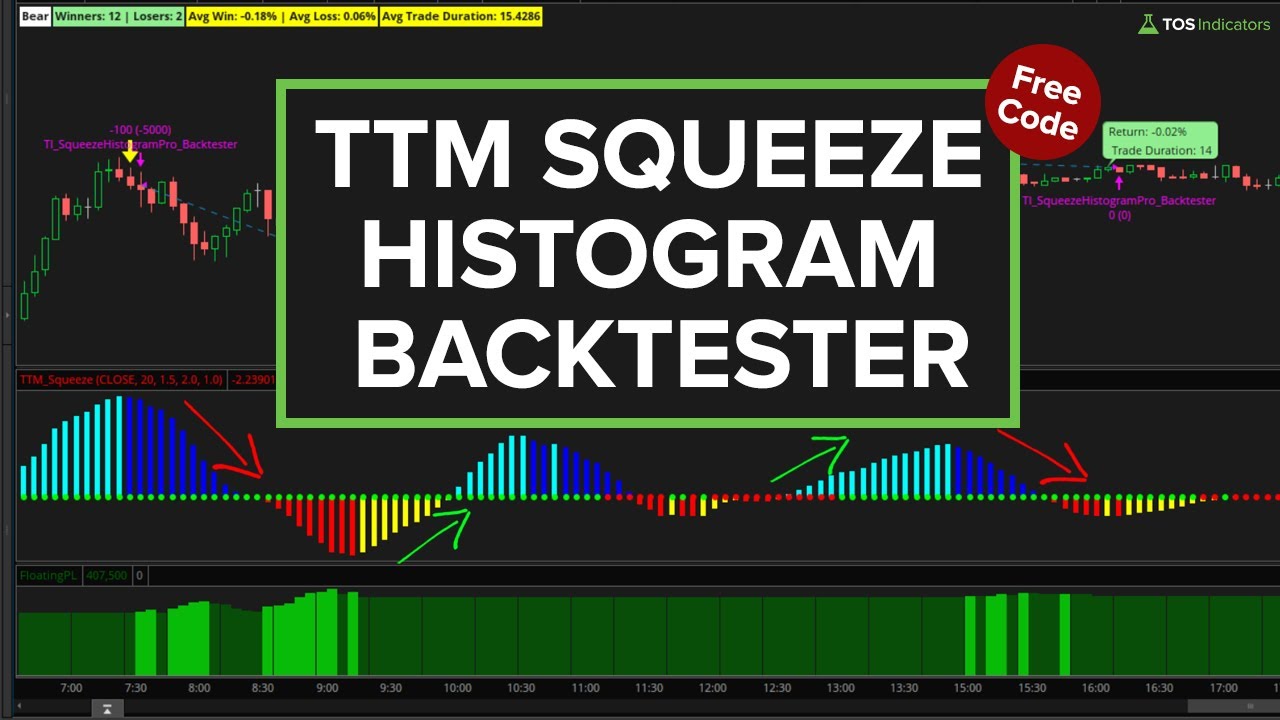
Download Free →TTM Squeeze Histogram Backtester
Test whether the squeeze histogram is effective for timing momentum shifts. Full backtesting with performance metrics.
Download Free →Scanner Videos

TTM Squeeze Backtest Results
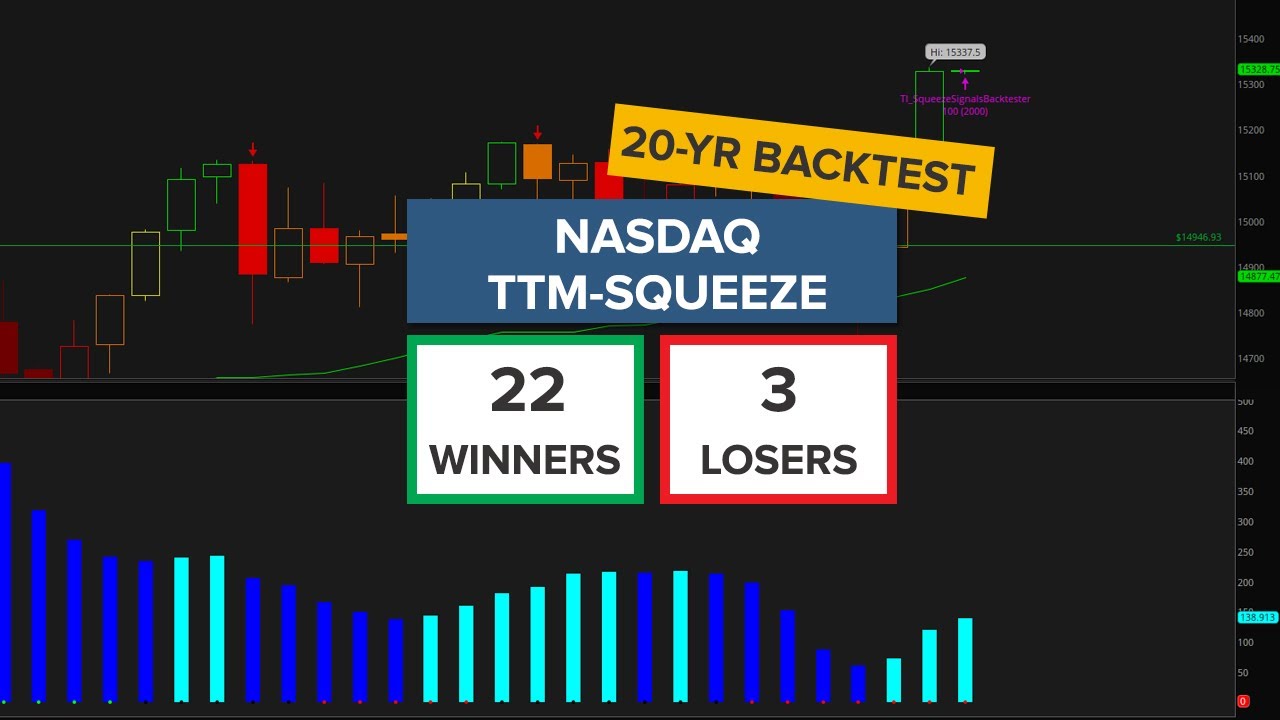
We've backtested hundreds of squeeze setups across different symbols and timeframes. The data reveals which setups consistently produce winning trades, and which to avoid.
Key Findings from 630+ Backtests
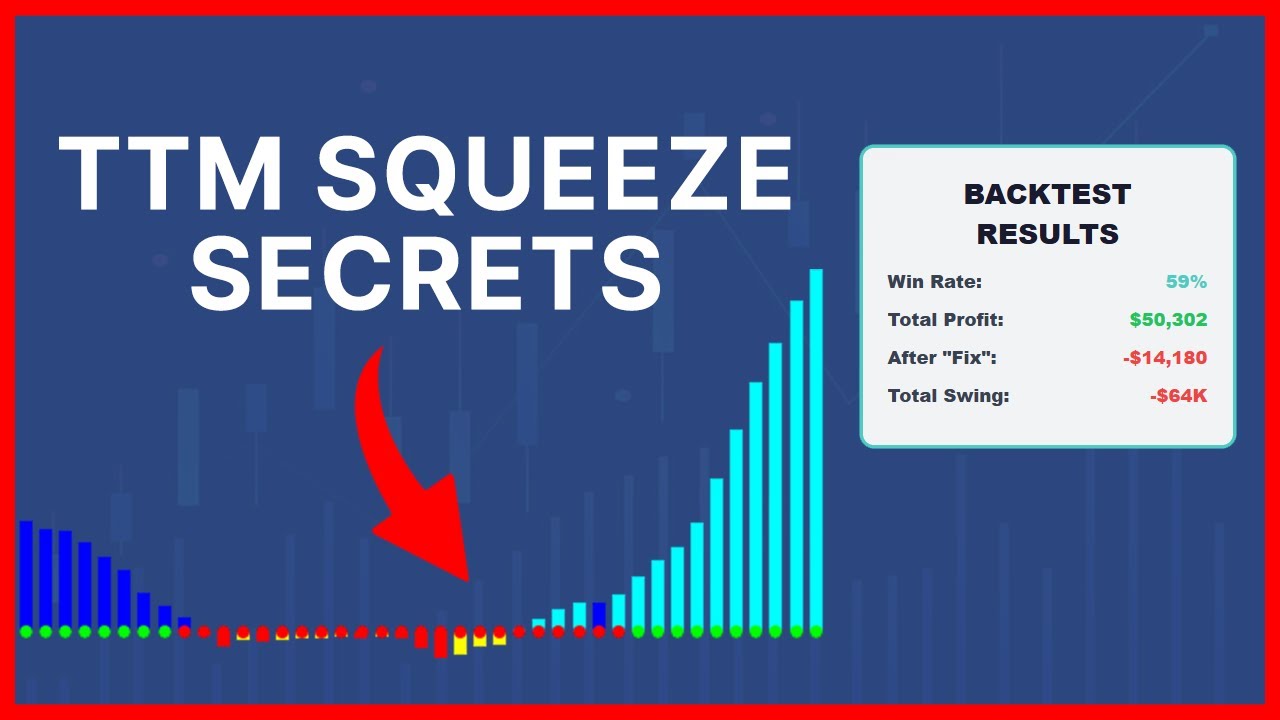
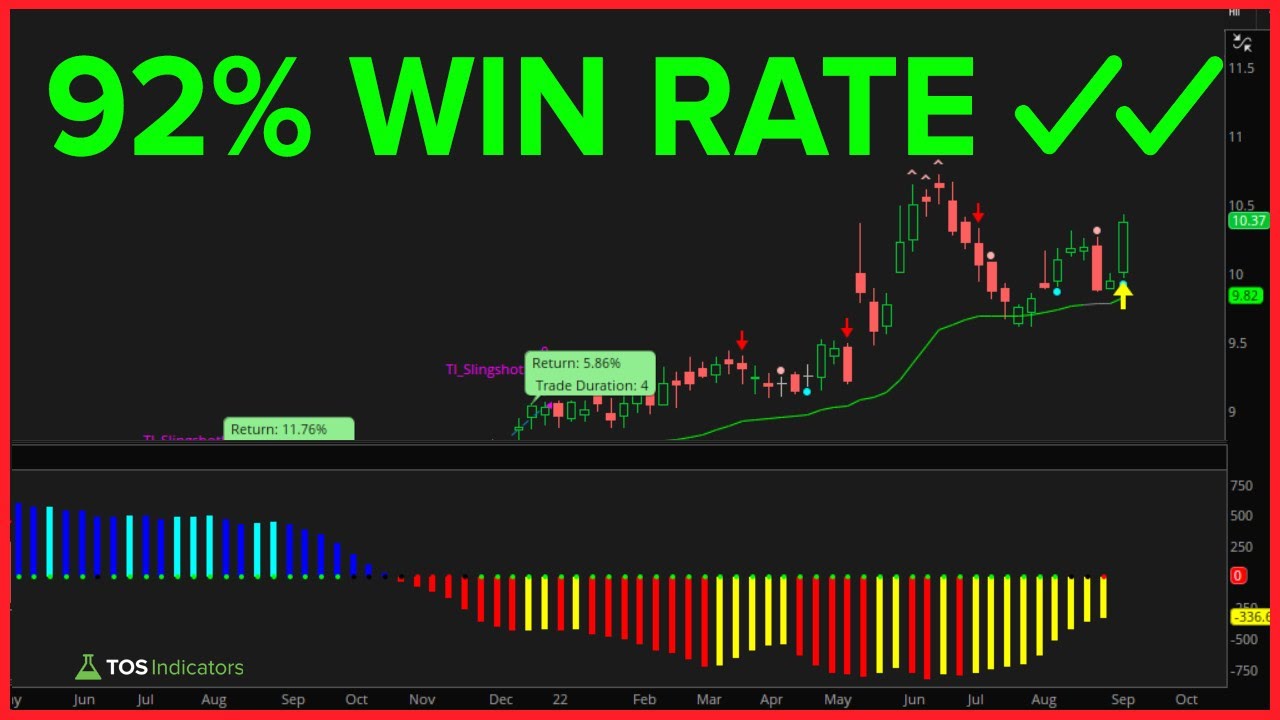
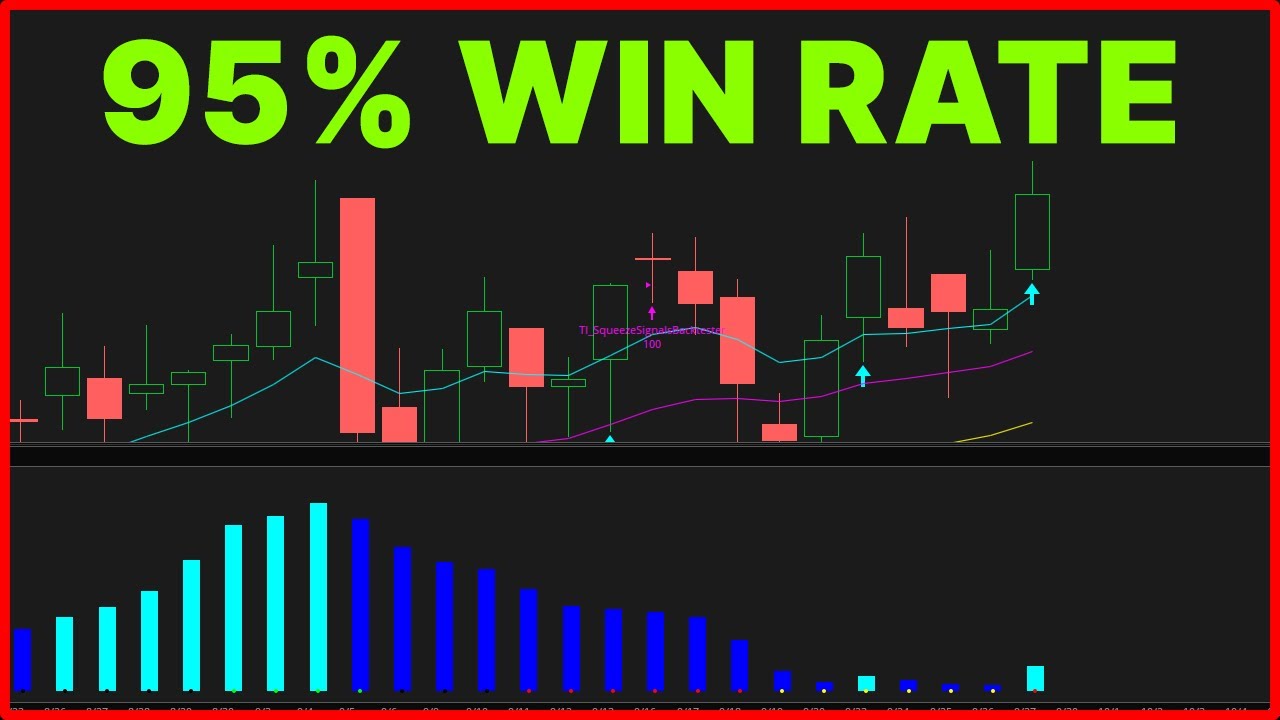
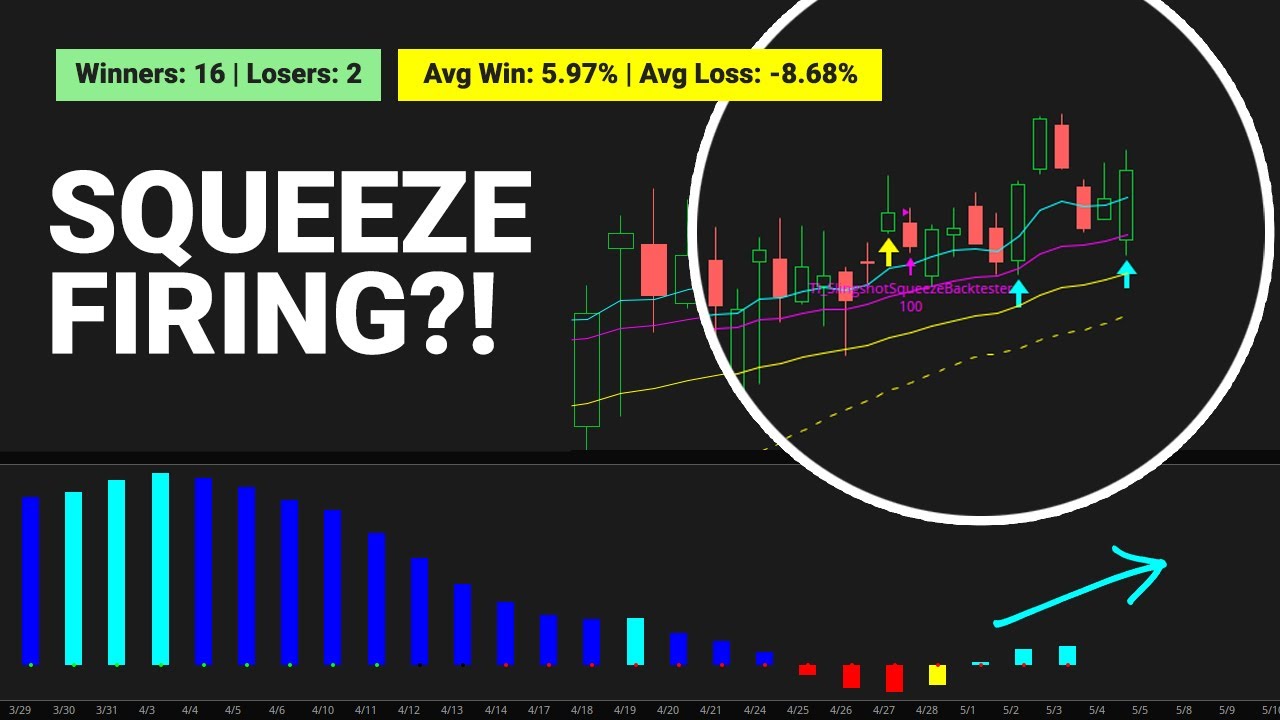
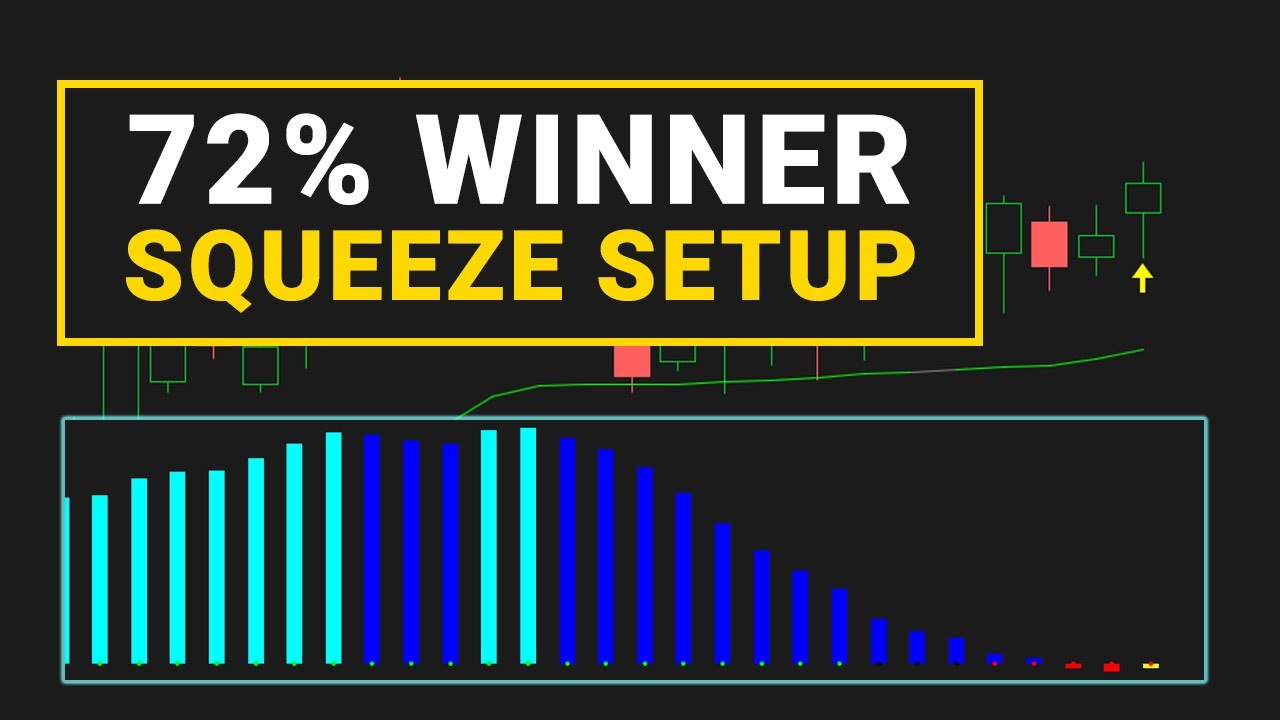
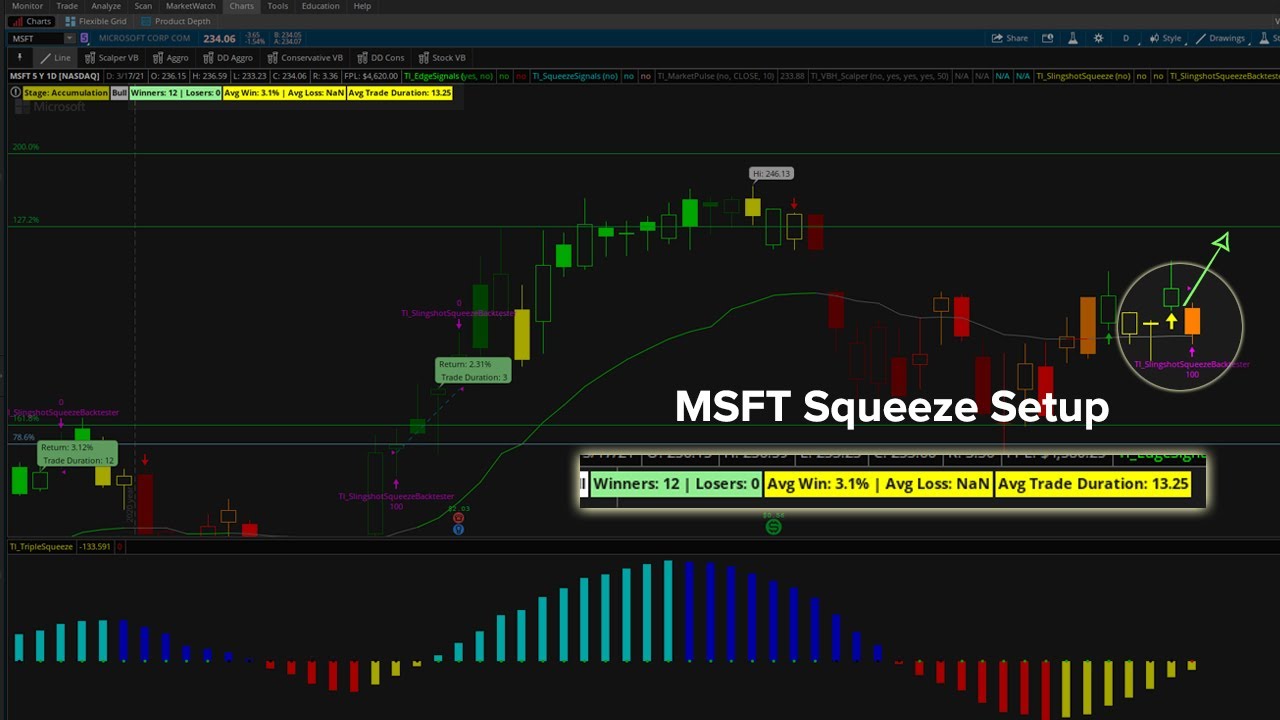
- The plain squeeze had no edge on its own; the full Slingshot setup won 69% of 5,852 trades over 22 years
- Exit strategy matters more than entry. Avoid common exit mistakes
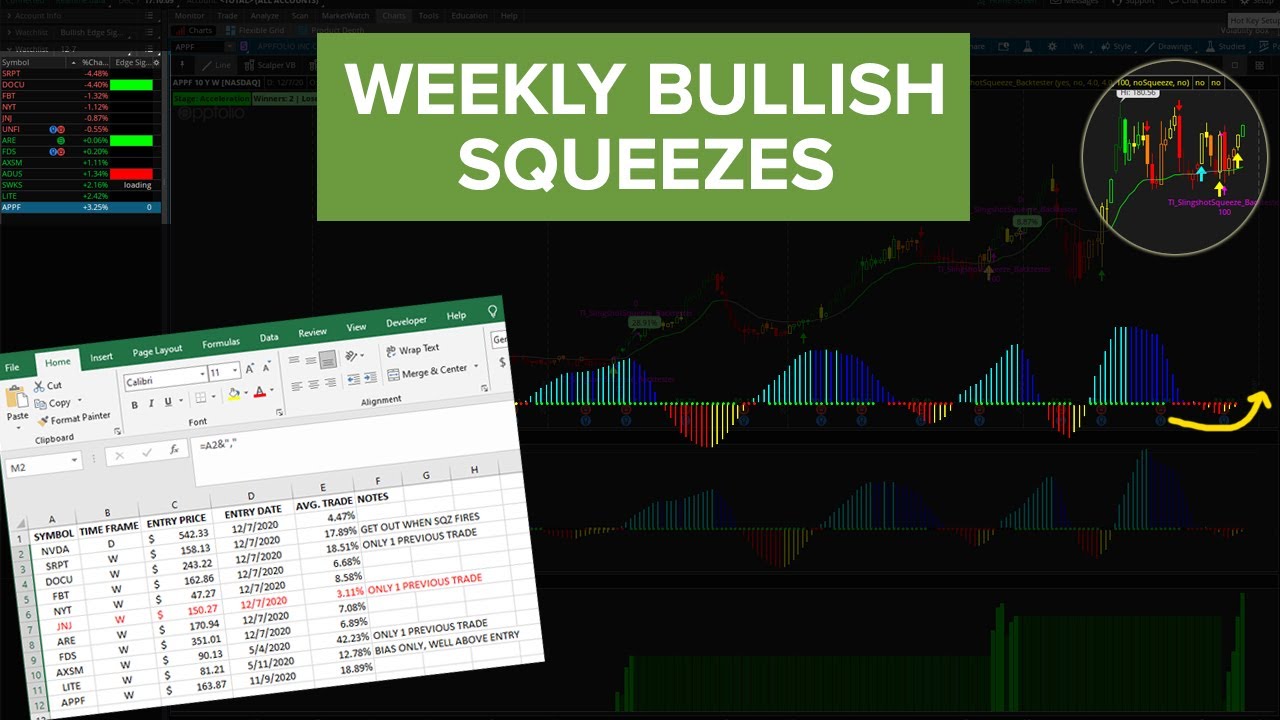
- Weekly timeframe squeezes tend to produce larger, more reliable moves
- Multi-timeframe alignment significantly improves results
Backtest Videos
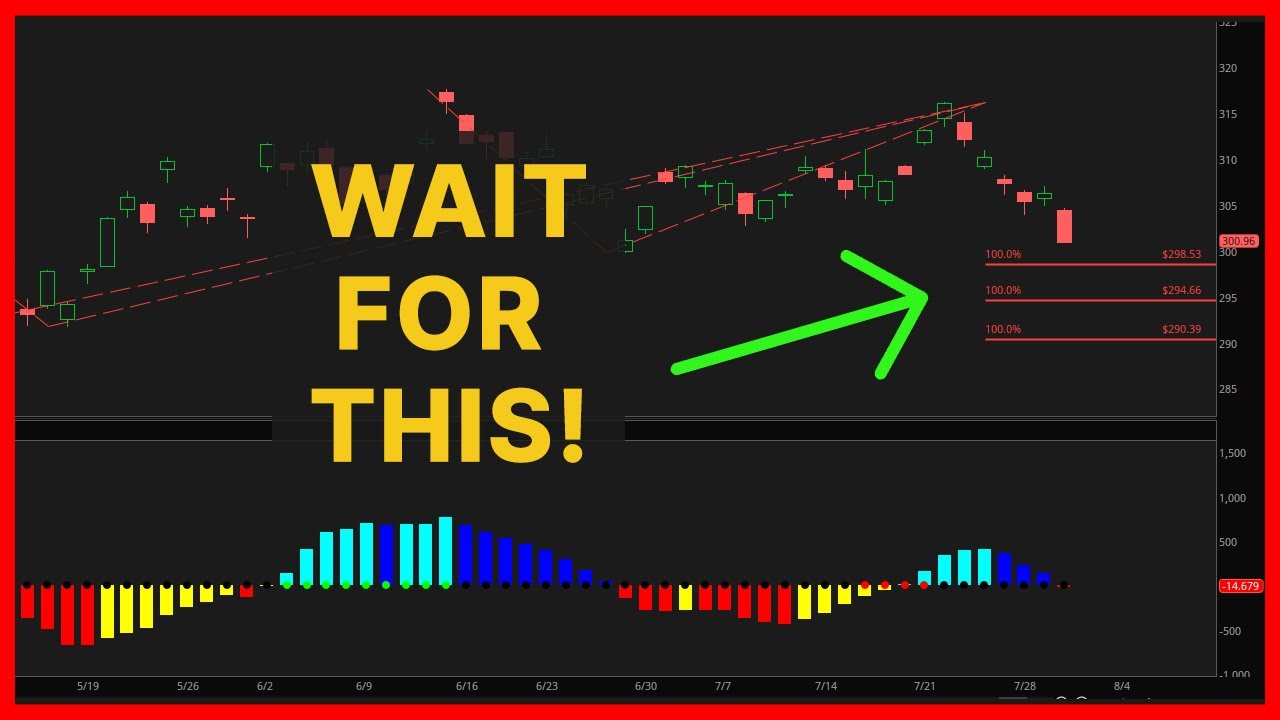
TTM Squeeze Trade Examples
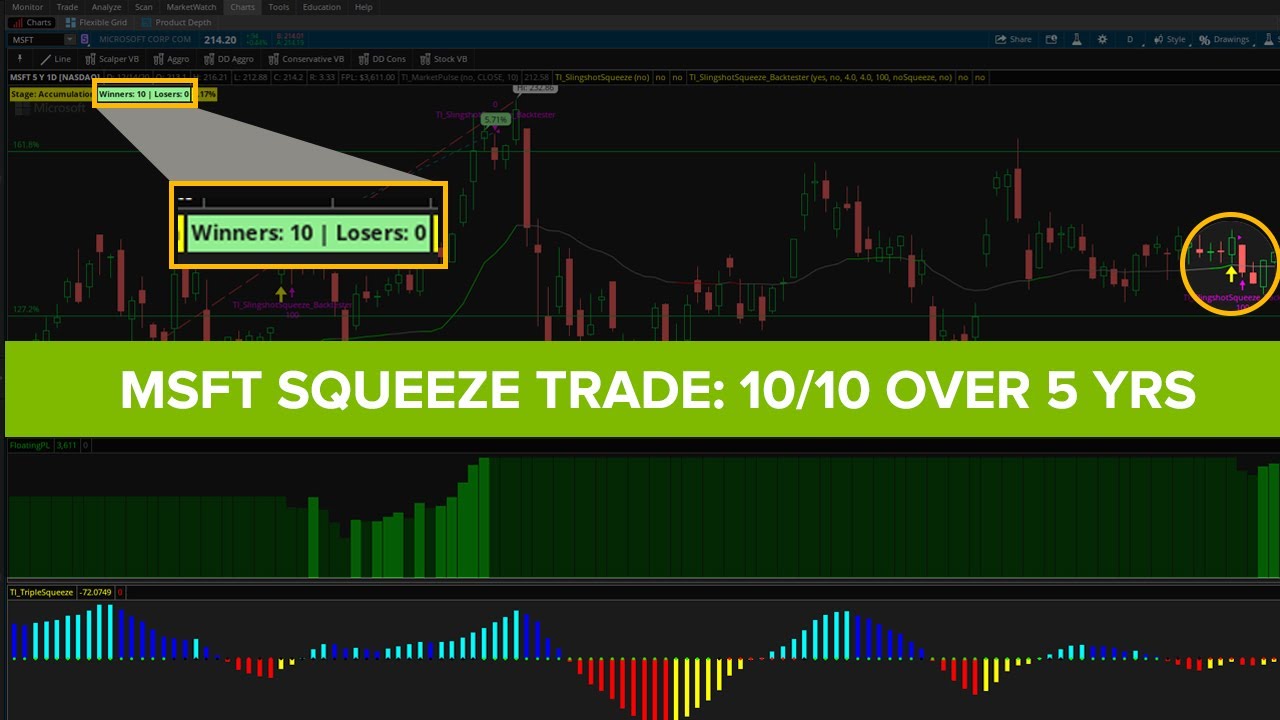
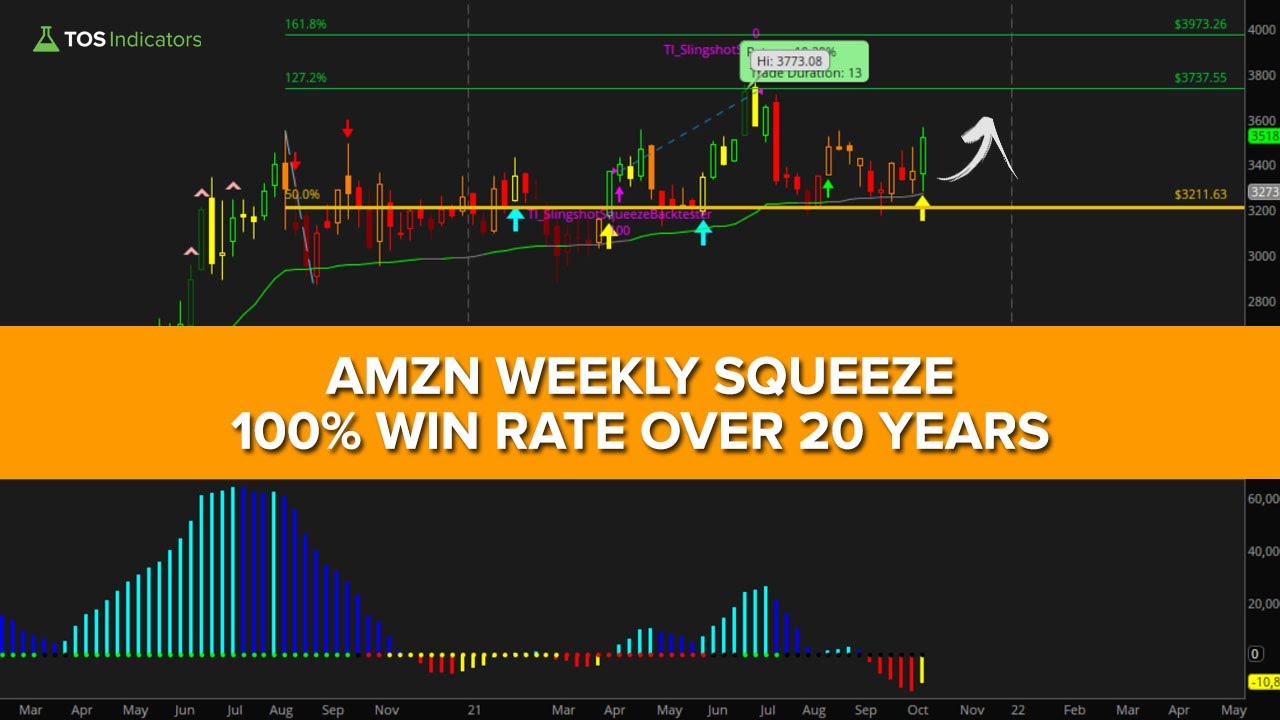
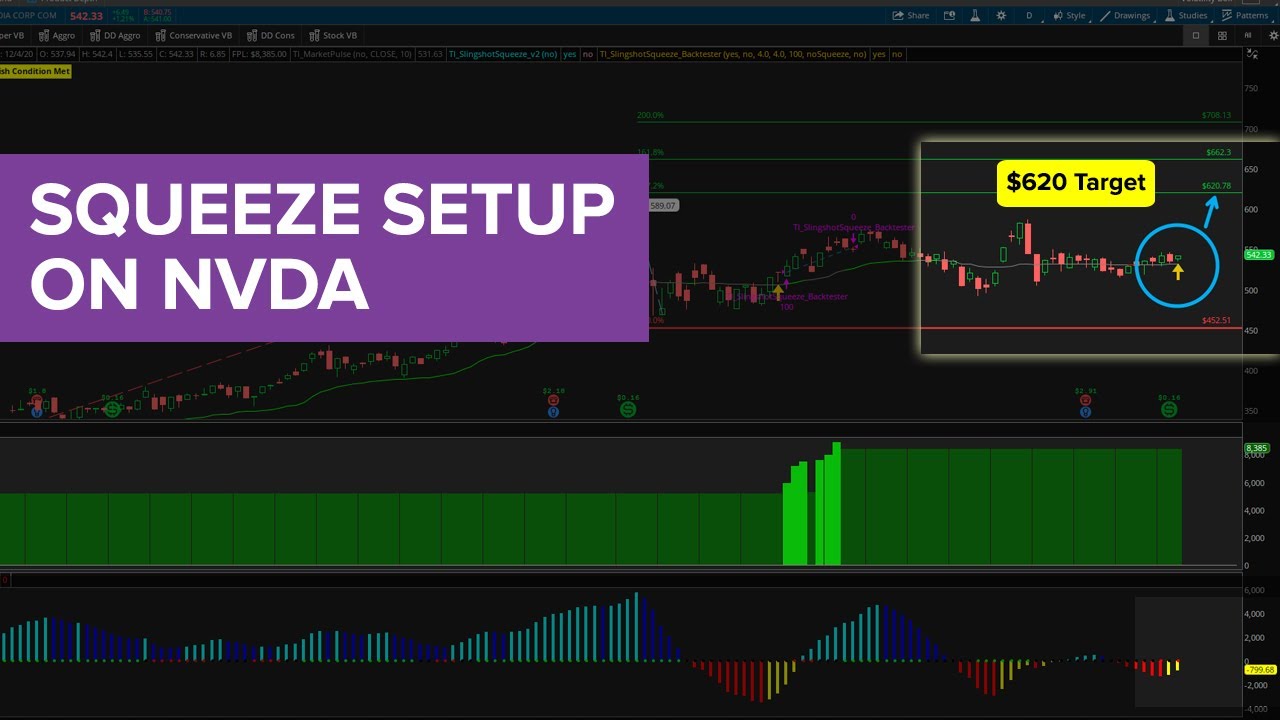
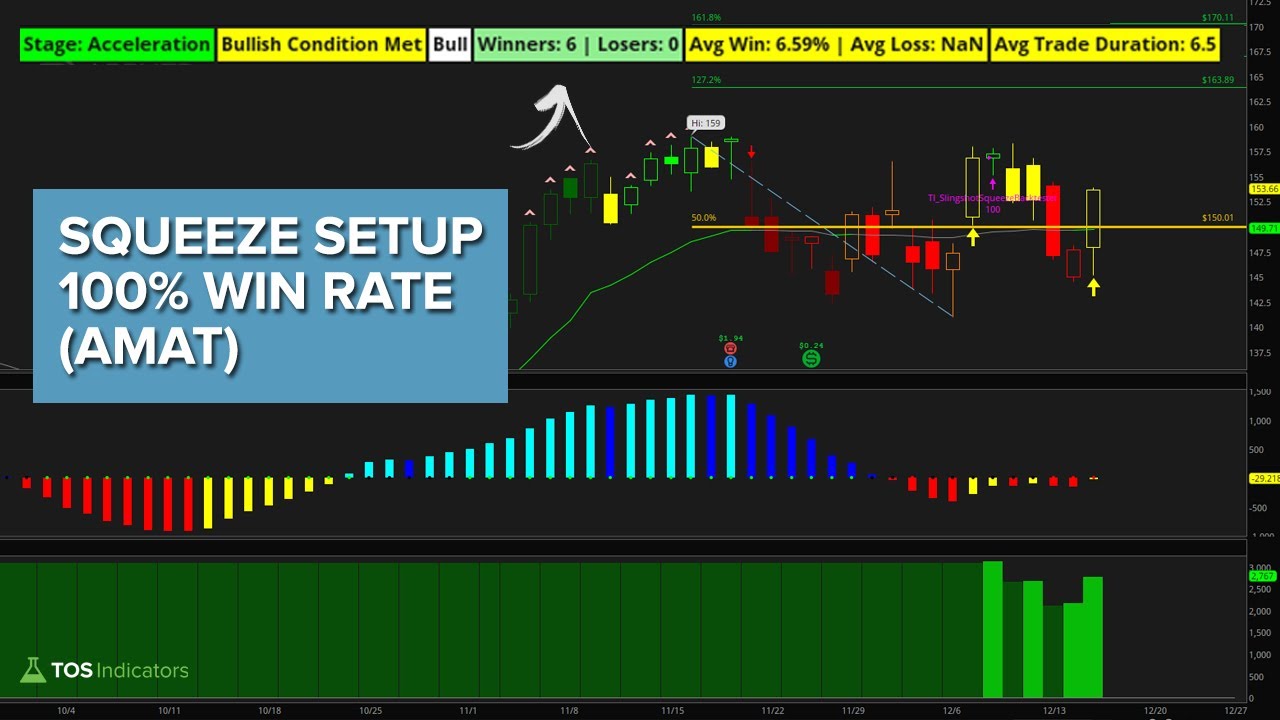
Watch real squeeze setups and how they played out in MSFT, AMZN, NVDA, and more.
Proven Squeeze Setups
Backtested TTM Squeeze setups with documented win rates across years of historical data. Each post walks through the entry criteria, exit, and the full result set.
TTM Squeeze Mastery Course
The complete 19-module video course to master TTM Squeeze trading. Build your own indicators, backtesters, scans, and dashboards from scratch in ThinkOrSwim.
TTM Squeeze Basics
Triple Pro Squeeze
Triple Pro Squeeze Backtester
Triple Pro Squeeze Scans
Triple Pro Squeeze Dashboard
Squeeze Signals Indicator
Bringing It All Together
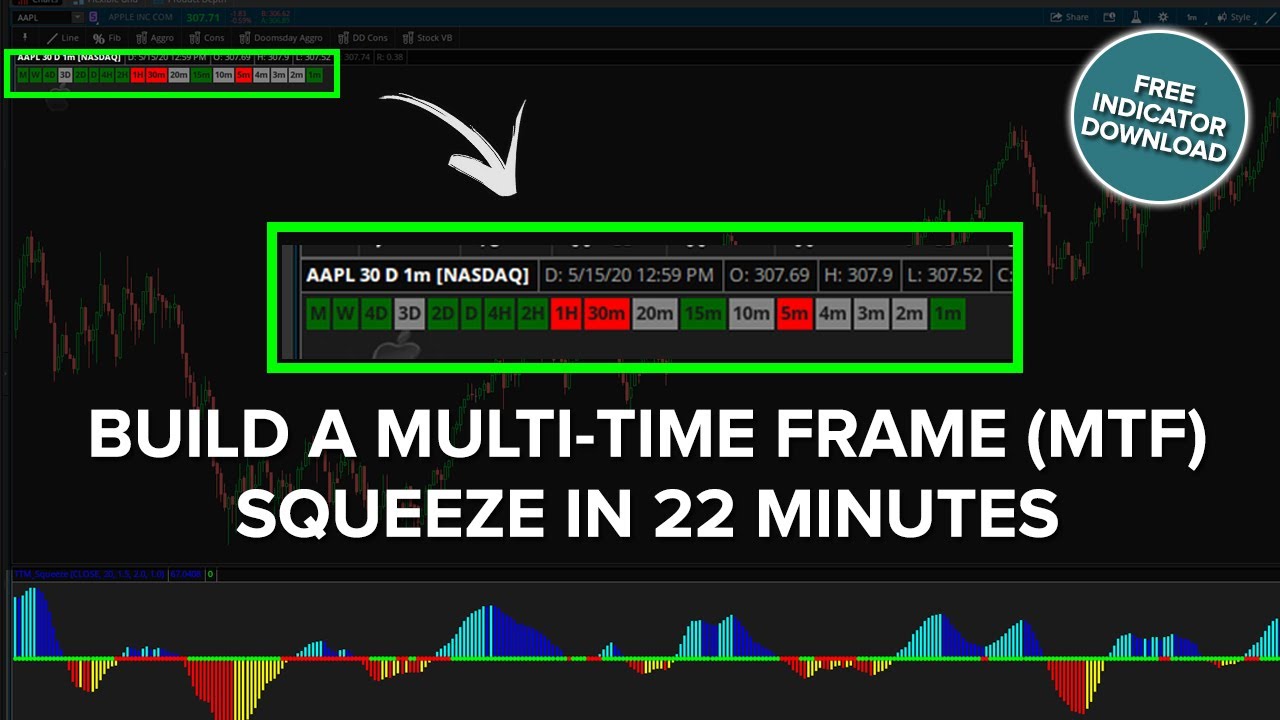
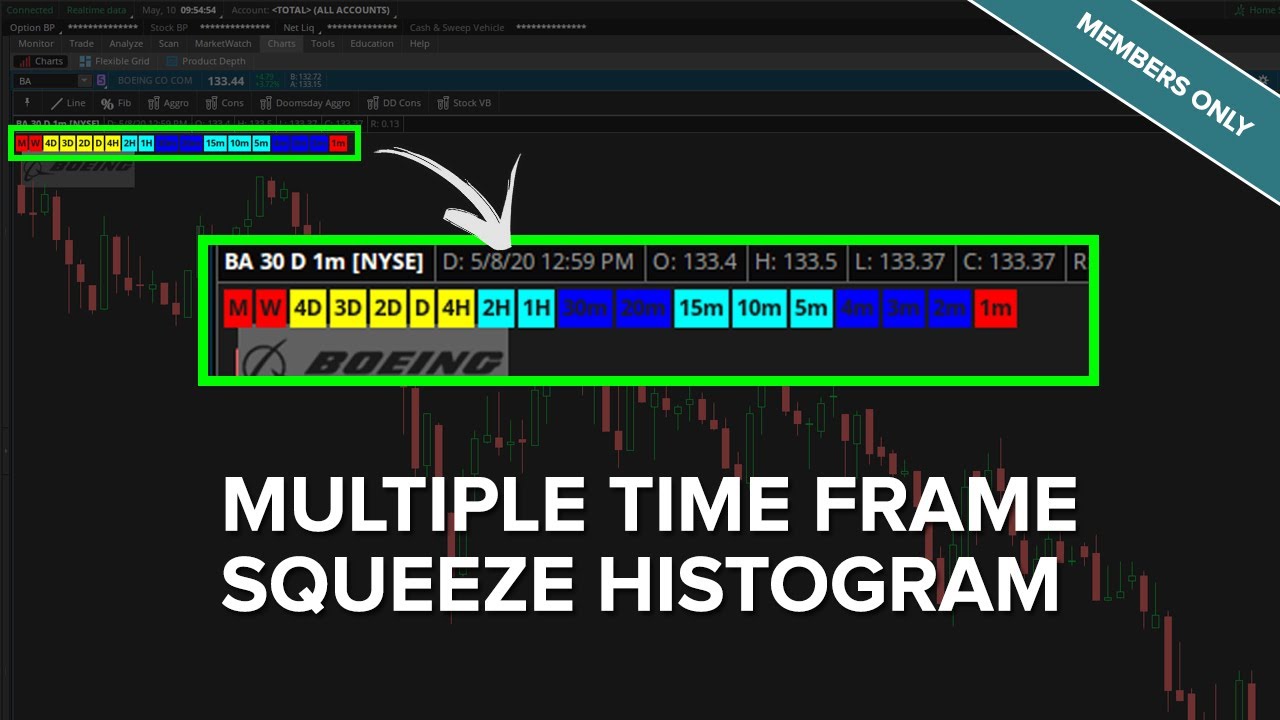
MTF Squeeze Histogram
MTF Triple Squeeze
Slingshot Squeeze
Slingshot Squeeze Scans
Slingshot Squeeze Backtester
Slingshot Backtester Stats
Squeeze Signals Backtester
Triple Squeeze Dashboard
Squeeze Histogram Backtester
Five Squeeze Dots Scan
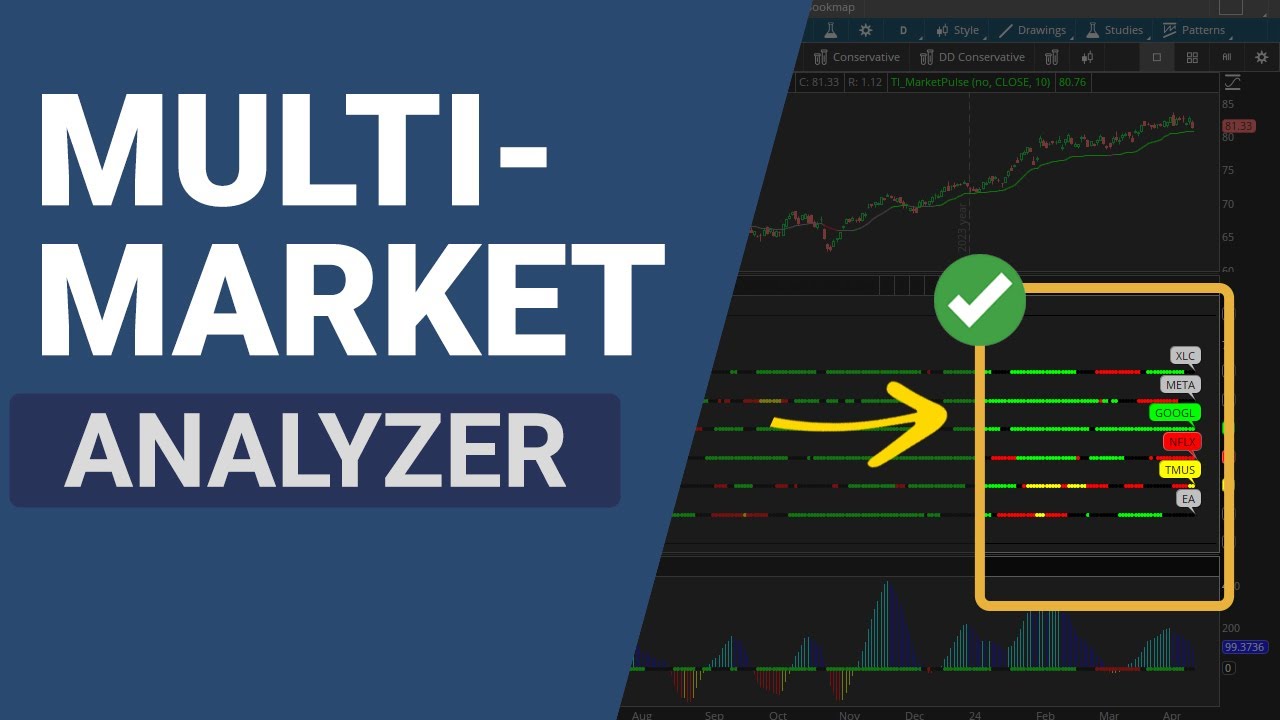
Multi-Market Squeeze Analyzer
Multi-Market Trend Analyzer
Included free with Volatility Box membership
TTM Squeeze Trading Tools
Everything you need to trade squeezes, from free indicators to professional backtesting.
Squeeze Course
19-module video course with 15+ downloadable tools. Build indicators, backtesters, scans, and dashboards.
View Course →TTM Squeeze Backtester
Test squeeze strategies on any symbol with 20+ years of data. See win rates, avg returns, and optimal settings.
View Backtester →Free Squeeze Tools
Trend Squeeze indicator, TTM Squeeze Dots scan, and Histogram Backtester. All free with video tutorials.
Browse Free Tools →Frequently Asked Questions
The TTM Squeeze, created by John Carter, identifies when Bollinger Bands move inside Keltner Channels, signaling a period of low volatility consolidation. When the bands expand back outside, it signals a potential explosive move. The indicator displays "squeeze dots" (red = squeeze on, green = squeeze off) and a momentum histogram showing direction.
Red dots mean a squeeze is on (Bollinger Bands inside Keltner Channels at the normal 1.5 setting). Green dots mean no squeeze, or that the squeeze has fired. The Triple Pro Squeeze adds two more levels: yellow dots for the tightest squeeze (Keltner 1.0) and black dots for the loosest (Keltner 2.0).
Daily and weekly timeframes tend to produce the most reliable squeeze signals for swing trading. For day trading, 30-minute and hourly charts work well. Using multiple timeframe analysis (checking daily, weekly, and monthly alignment) significantly improves win rates.
A green dot means the squeeze fired. It is not a buy by itself; direction comes from the momentum histogram. Our Slingshot setup enters while the stock is still in the squeeze, once trend and momentum line up, and exits when the squeeze fires. Place the stop on the other side of the consolidation range.
It depends on the setup. In our 22-year daily test, the plain squeeze had no edge on its own. The full Slingshot setup (squeeze plus trend, oversold and momentum filters) won 69% of 5,852 trades from 2004 to 2026. Results vary by symbol, so run the backtester on yours first.
ThinkOrSwim's Stock Hacker can scan for squeeze conditions. Look for stocks where the TTM_Squeeze indicator shows red dots (squeeze on) combined with momentum building in your preferred direction. Our free scans detect 5+ consecutive squeeze dots about to fire.
The standard squeeze shows one level: red dots when Bollinger Bands are inside Keltner Channels at the 1.5 setting. The Triple Pro Squeeze shows three: yellow for the tightest squeeze (Keltner 1.0), red for the normal squeeze (1.5) and black for the loosest (2.0). Green means no squeeze.
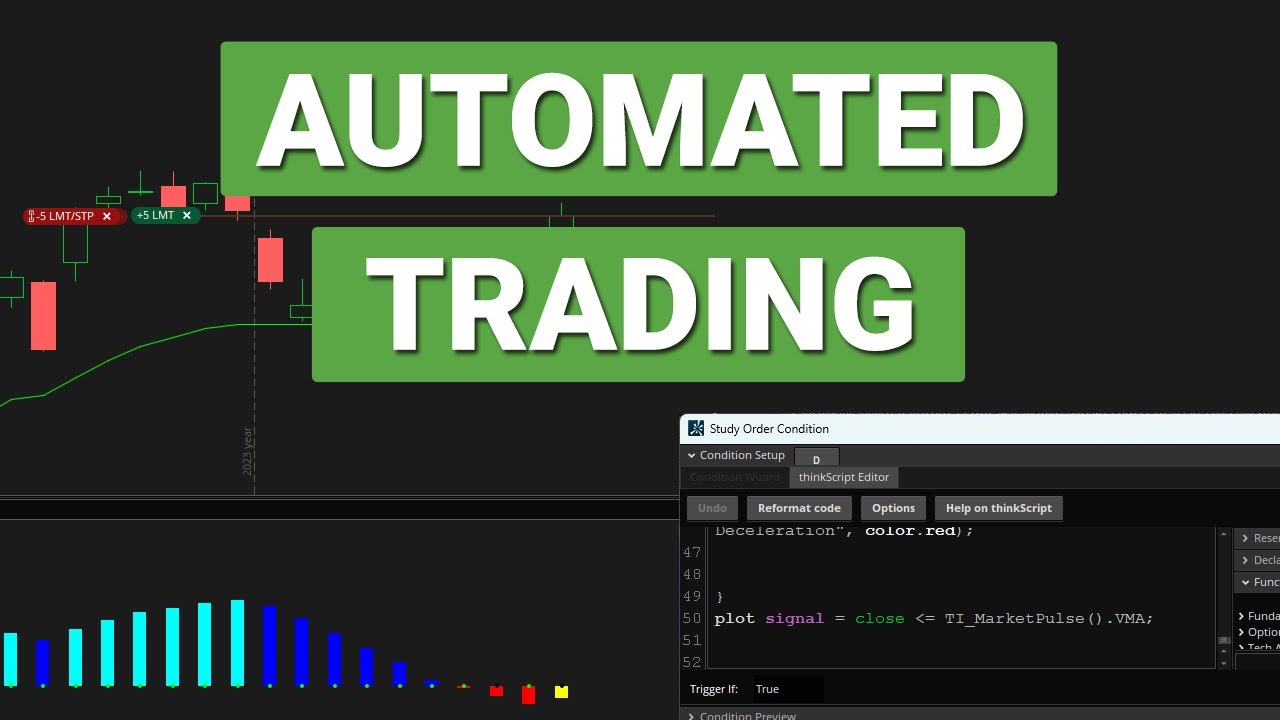
Yes, ThinkOrSwim supports automated trading through conditional orders and strategies. You can set alerts when squeeze fires and momentum confirms direction, or build fully automated strategies. The Squeeze Course shows how to automate the entry. Win rates depend on the symbol, so run the backtester first.
Start Trading TTM Squeeze Setups
Get free indicators or take the complete course to master squeeze trading.