Squeeze Setups
A live squeeze scanner built around the Slingshot Squeeze, with 22 years of backtest results behind it.
See it, $99/month →

All Scans
Beginner-Friendly
20 mins
ThinkOrSwim
How to Scan for False Breakouts in ThinkOrSwim
Download our False Breakout Scanner for ThinkOrSwim. Two free scans that find failed breakouts and failed breakdowns on above-average volume, plus the False Breakdown indicator, delivered as ThinkorSwim share links you can import directly.
Download Scans
Table of Contents
- What the False Breakout Scanner Looks For
- Why It Ships as Two Separate Scans
- How to Load the Scan in ThinkorSwim
- Scan 1: False Breakout Scanner
- Scan 2: False Breakdown Scanner
- AMD Example: June 17, 2025
- GOOGL Example: November 19, 2025
- Tuning the Three Inputs
- How to Trade What the Scanner Returns
- Where This Scan Fits Alongside Other Tools
- Known Limitations
- Download the Scan
Most breakouts fail. Price pushes through an obvious level, everyone piles in, and then it closes right back inside the range and traps them. This tutorial builds a pair of scans that hunt for exactly that moment.
You get two scans: one for failed upside breakouts (a bull trap you can fade short) and one for failed downside breakdowns (a bear trap you can fade long). Both require above-average volume on the break bar, so you are not scanning thin-air pops with no real participation behind them.
The False Breakout Scanner is a pair of free ThinkorSwim scans that find stocks where a breakout attempt failed inside a single bar. One scan finds failed upside breakouts, the other finds failed breakdowns. Both require above-average volume on the break bar, so you are looking at levels that real size traded through and then rejected.
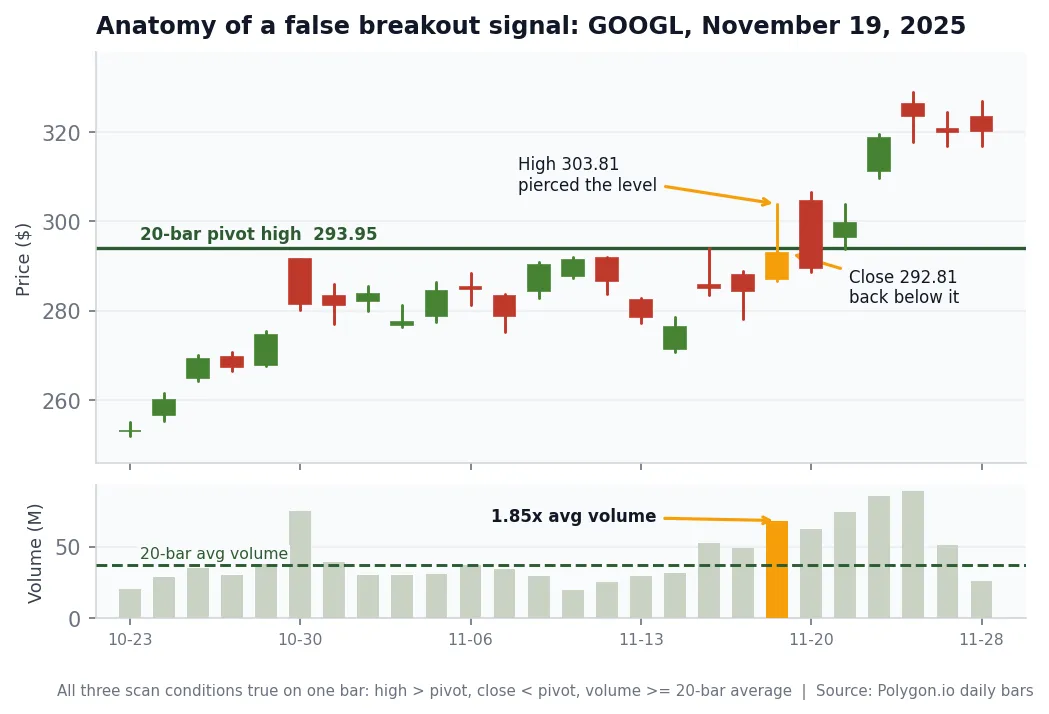
A false breakout is a bar whose high pierces a prior resistance level but whose close falls back below it. Buyers took the level, could not hold it, and the bar closed inside the old range. The same pattern runs in reverse at support, where a low pierces below the level and the close recovers above it.
What the False Breakout Scanner Looks For
The False Breakout Scanner flags a bar when three conditions are true at the same time. The bar’s high exceeds the 20-bar pivot high, the bar’s close finishes below that same pivot high, and volume on the bar is at or above the 20-bar average.
The key level is defined with a one-bar offset: Highest(high[1], lookbackPeriod). That [1] matters. It excludes the current bar from the calculation, so the level is fixed before the current bar starts printing. Without the offset the current bar’s own high would raise the level it is being measured against, and the condition could never trigger.
The volume filter is the condition that gets left off most often, and it is the one doing the most work. A stock can poke a hair above a 20-day high on well under its normal volume and close back under it, and that tells you almost nothing. The same poke on twice normal volume means a large number of shares changed hands at a price nobody was willing to defend by the close.
If you want the volume leg on its own, our unusual volume scanner for ThinkorSwim runs that filter without the price condition attached.
Why It Ships as Two Separate Scans
The False Breakout Scanner ships as two scans, not one, because ThinkorSwim evaluates exactly one boolean plot per custom study filter. A single study that plotted both the fade-up and fade-down conditions would give the Stock Hacker no way to know which of the two you wanted to filter on.
So the logic is split:
- TI_FalseBreakoutScanner_FadeUp returns true on a failed upside breakout. This is the bull trap, a candidate to fade short.
- TI_FalseBreakoutScanner_FadeDown returns true on a failed downside breakdown. This is the bear trap, a candidate to fade long.
Load them as two saved scans and run whichever one matches the side you are hunting. A common habit is to check the fade-down list on red days and the fade-up list on green days, on the assumption that each pattern concentrates there. We tested that on a year of data and it does not hold.
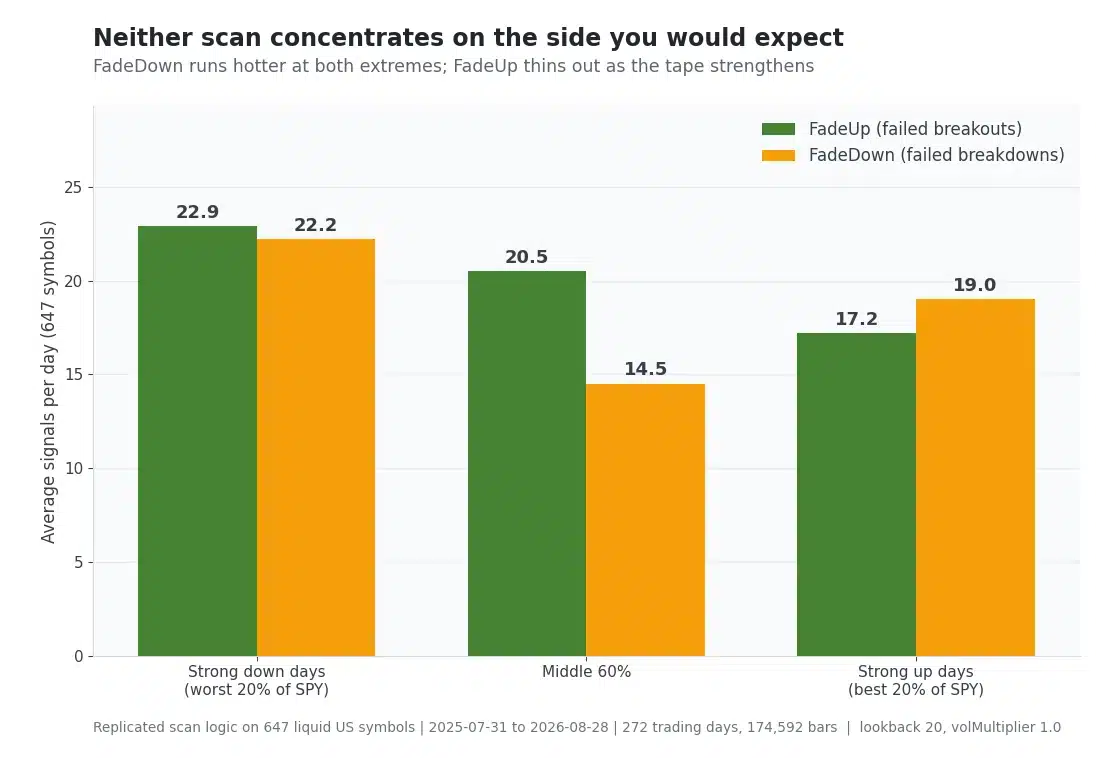
Across those 643 symbols and 272 trading days, sorted into fifths by SPY’s daily return: FadeUp averaged 22.9 signals per day on the worst fifth of days, about 20.5 through the middle three, and 17.2 on the best. FadeDown peaked at both ends, 22.2 on the worst days and 19.0 on the best, and bottomed at 14.5 through the quiet middle. Failed breakouts show up more when the market is weak. Failed breakdowns show up whenever the tape moves hard, in either direction. Both lists lengthen with movement, so run the side you intend to trade.
How to Load the Scan in ThinkorSwim
- Open ThinkorSwim, then go to Scan → Stock Hacker → Add Filter → Study.
- Click the edit (pencil) icon on the study filter, then choose thinkScript Editor.
- Delete the placeholder code and paste one of the code blocks below.
- Name the study to match the scan, then click Save.
- Set the condition to
FalseBreakoutUp(orFalseBreakdownDown) is true. - Tune
lookbackPeriod,volumePeriod, andvolMultiplierdirectly in the Study Filter dialog. You do not need to edit the code to change them.
If you have never pasted a custom study into the platform before, our walkthrough on how to import a ThinkScript study into ThinkorSwim covers the same steps with screenshots.
Set your aggregation period on the Stock Hacker before you run it. The scan reads whatever timeframe the scanner is set to, so on a daily aggregation the 20-bar lookback is a 20-day high, and on a 5-minute aggregation it is the high of the last 20 five-minute bars.
Scan 1: False Breakout Scanner
This scan finds bars whose high poked above the N-bar pivot high on above-average volume but closed back below it. Paste it into the Study Filter and set the condition to FalseBreakoutUp is true.
#Written by TOS Indicators 2026
#Home of the Volatility Box
#Scan: False Breakout Scanner (Short Setup)
#Full Tutorial Link: tosindicators.com/scans/false-breakout-scanner/

input lookbackPeriod = 20;
input volumePeriod   = 20;
input volMultiplier  = 1.0;

def pivotHigh = Highest(high[1], lookbackPeriod);

def avgVolume   = Average(volume, volumePeriod);
def aboveAvgVol = volume >= avgVolume * volMultiplier;

def highAbove  = high  > pivotHigh;
def closeBelow = close < pivotHigh;

plot FalseBreakoutUp = highAbove and closeBelow and aboveAvgVol;
Scan 2: False Breakdown Scanner
This scan is the mirror image. It finds bars whose low pierced below the N-bar pivot low on above-average volume but whose close recovered above it. Set the condition to FalseBreakdownDown is true.
#Written by TOS Indicators 2026
#Home of the Volatility Box
#Scan: False Breakdown Scanner (Long Setup)
#Full Tutorial Link: tosindicators.com/scans/false-breakout-scanner/

input lookbackPeriod = 20;
input volumePeriod   = 20;
input volMultiplier  = 1.0;

def pivotLow = Lowest(low[1], lookbackPeriod);

def avgVolume   = Average(volume, volumePeriod);
def aboveAvgVol = volume >= avgVolume * volMultiplier;

def lowBelow   = low   < pivotLow;
def closeAbove = close > pivotLow;

plot FalseBreakdownDown = lowBelow and closeAbove and aboveAvgVol;
AMD Example: June 17, 2025
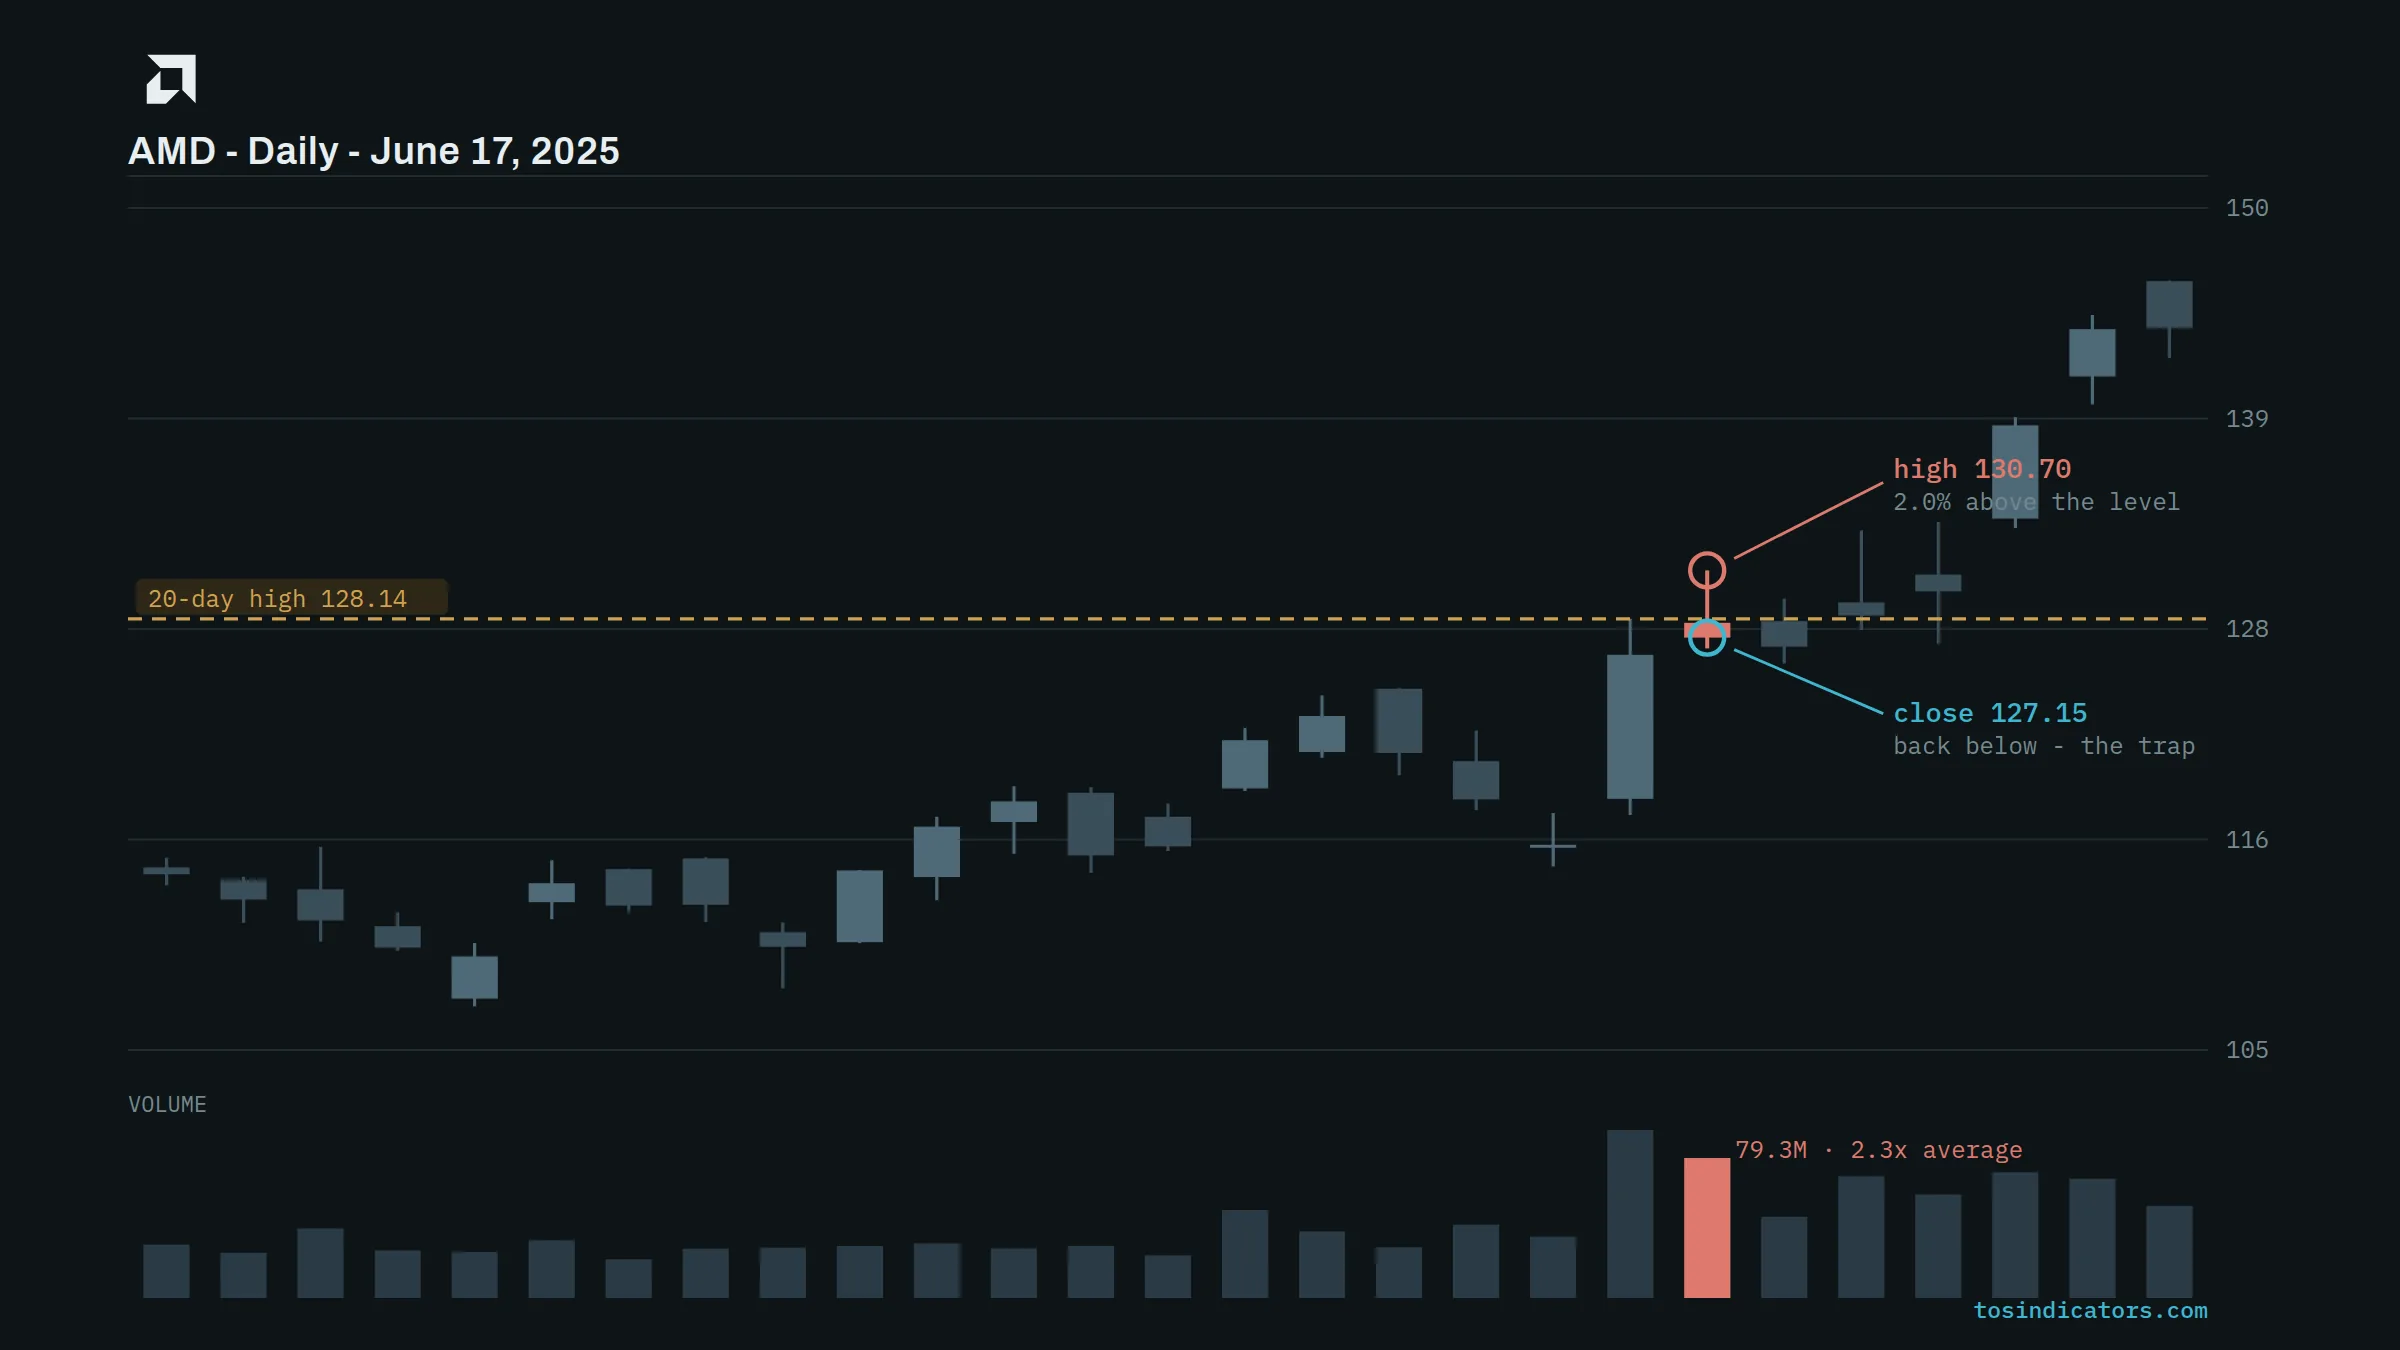
AMD on June 17, 2025 is a textbook fade-up signal. The 20-day high going into the session was 128.14. AMD printed a high of 130.70, which is 2.0 percent above the level, and then closed at 127.10, a full 1.04 below it. Volume on the bar came in at 2.1 times the 20-day average.
Read that bar back as an order flow story. Buyers paid up through a level that had capped the stock for a month, they did it on more than double normal participation, and by the close the entire 3.60 point excursion off the high had been given back. Everyone who bought the breakout above 128.14 finished the day underwater.
GOOGL Example: November 19, 2025
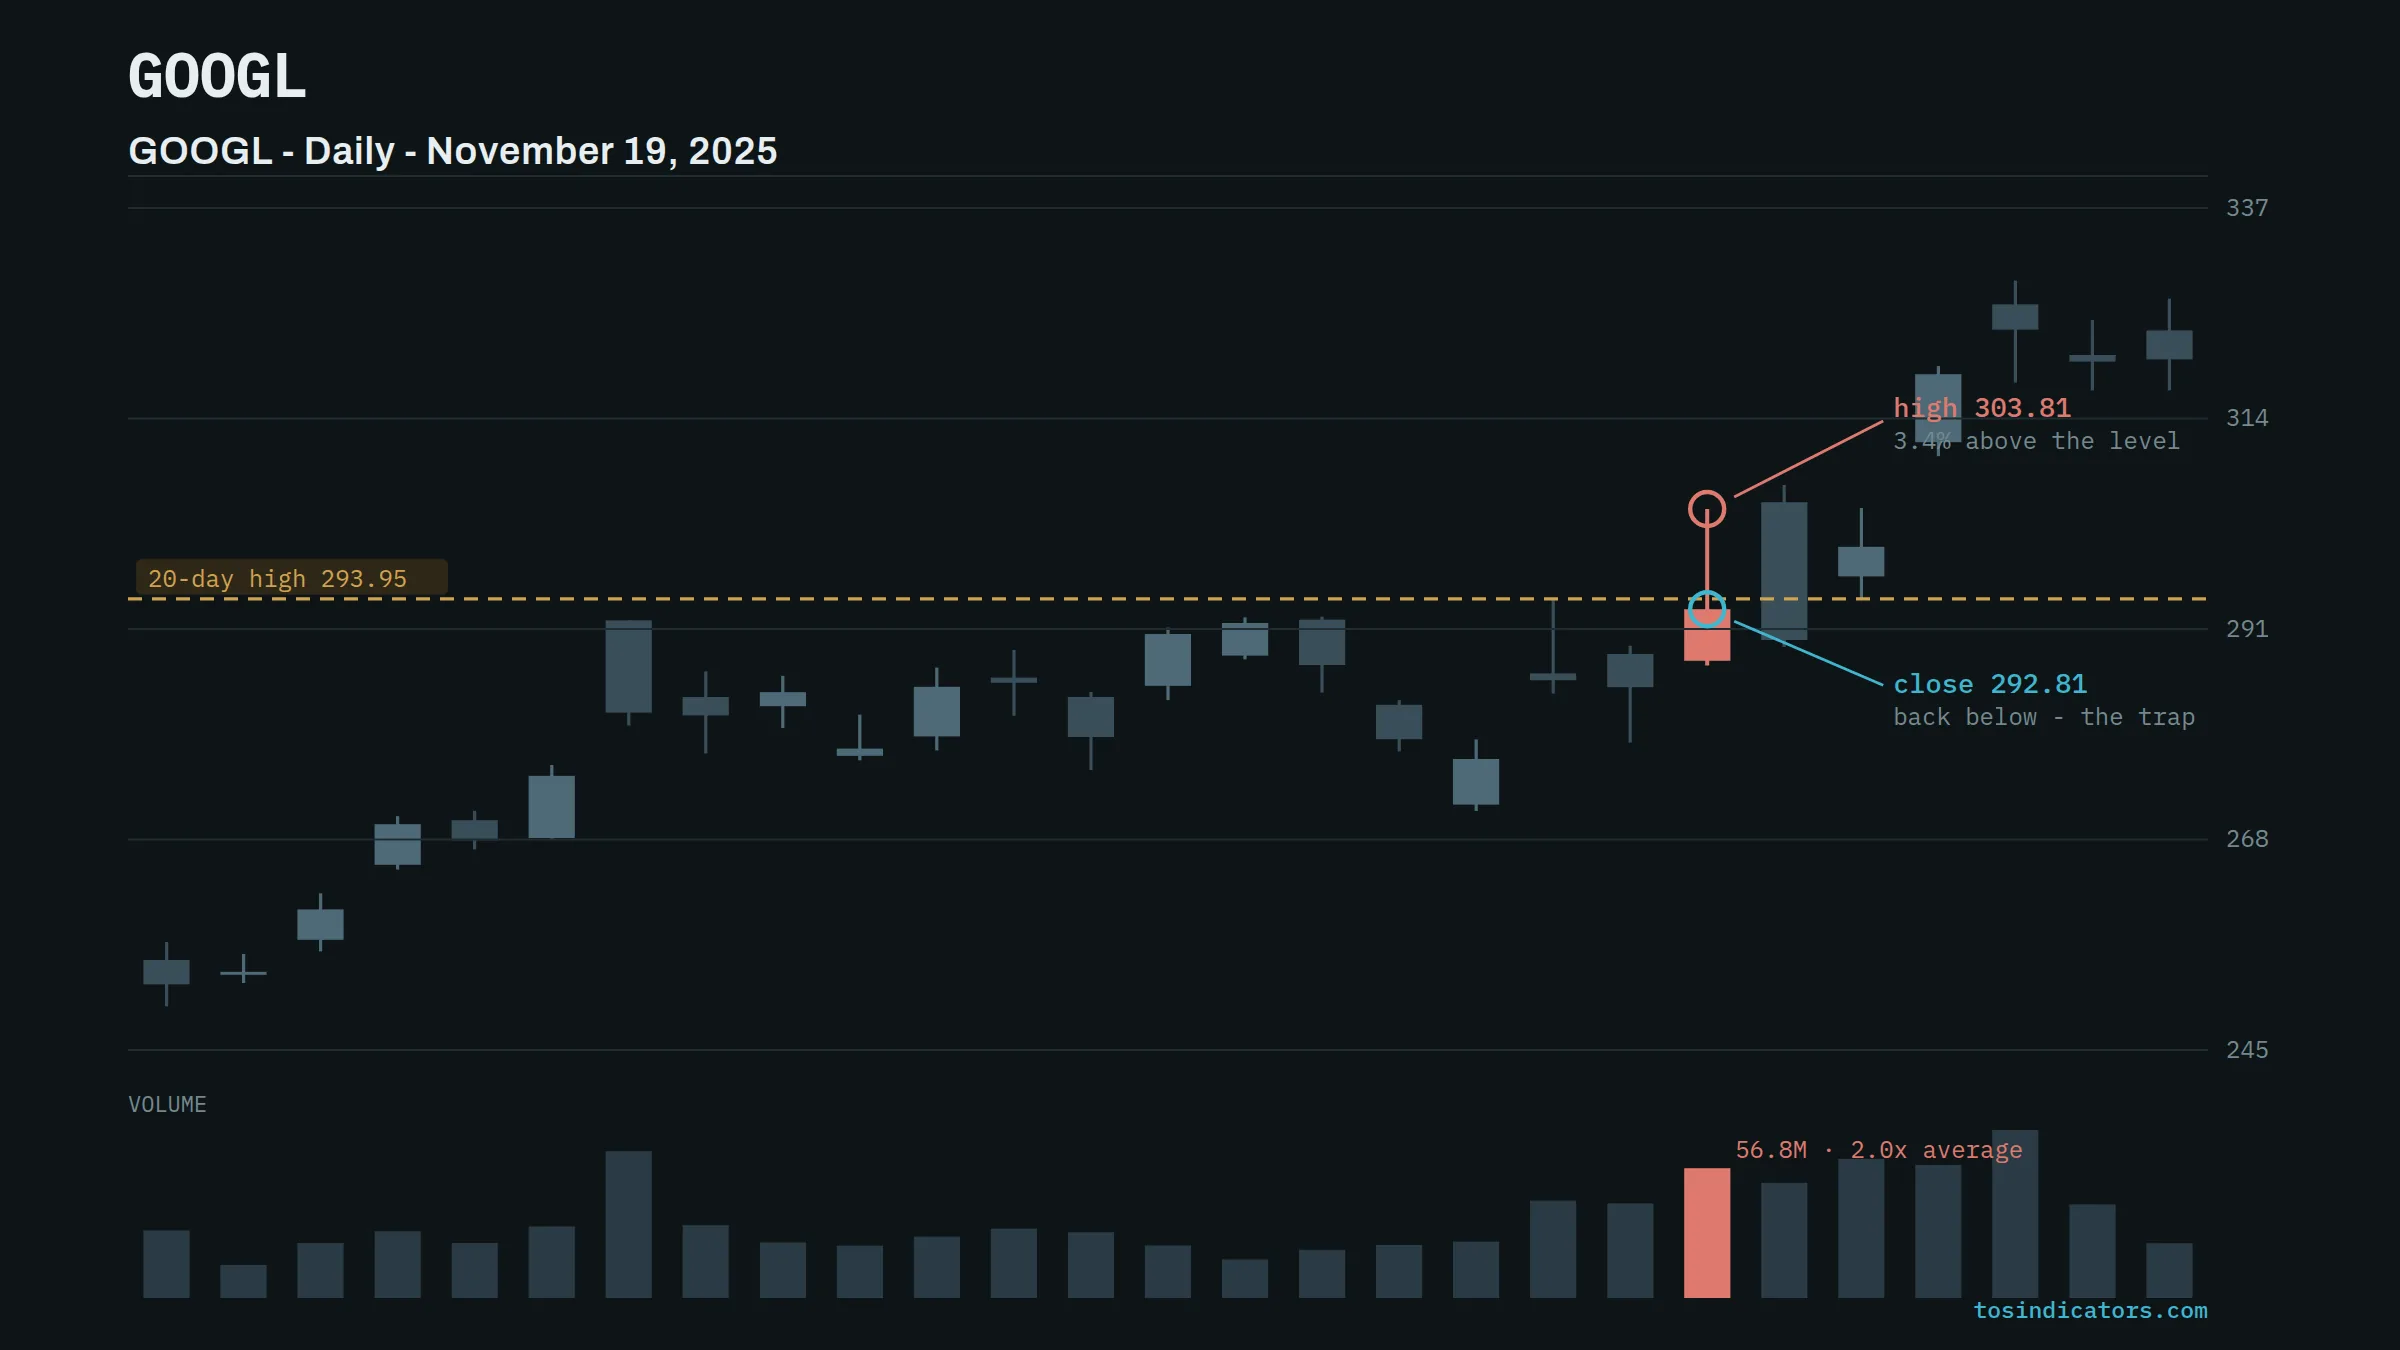
GOOGL on November 19, 2025 shows the same structure with a wider excursion. The 20-day high was 293.95. GOOGL printed 303.81, which is 3.4 percent above the level, then closed at 292.81, back below it by 1.14.
The scan does not care by how much the close finished under the level. The condition is binary: the high cleared the pivot and the close did not hold it. A close that finishes just under the level is arguably the cleaner version of the pattern, because it leaves the level intact as overhead resistance and gives you a tight, well-defined risk point for a short entry.
Tuning the Three Inputs
All three inputs are editable from the Study Filter dialog without touching the code. Here is what each one does to your result count.
| Input | Default | What it controls | Effect of raising it |
|---|---|---|---|
lookbackPeriod |
20 | Bars used to set the pivot high or low | A more significant level, fewer hits, and a longer memory of prior supply |
volumePeriod |
20 | Bars in the average-volume baseline | A smoother baseline that reacts more slowly to a recent volume regime change |
volMultiplier |
1.0 | Minimum volume on the break bar as a multiple of average | Fewer, higher-conviction signals. Set it to 1.5 or 2.0 to demand real participation |
If you are running this on a daily aggregation across a broad universe and getting more results than you can review, raise volMultiplier to 1.5 before you touch anything else. The volume filter cuts the most noise per unit of tuning, because a marginal poke above a level on average volume is the most common low-quality version of this pattern.
Going the other direction, a lookbackPeriod of 5 or 10 turns this into a short-term rejection scan usable on intraday aggregations, where the level is the high of the last few hours rather than the last month.
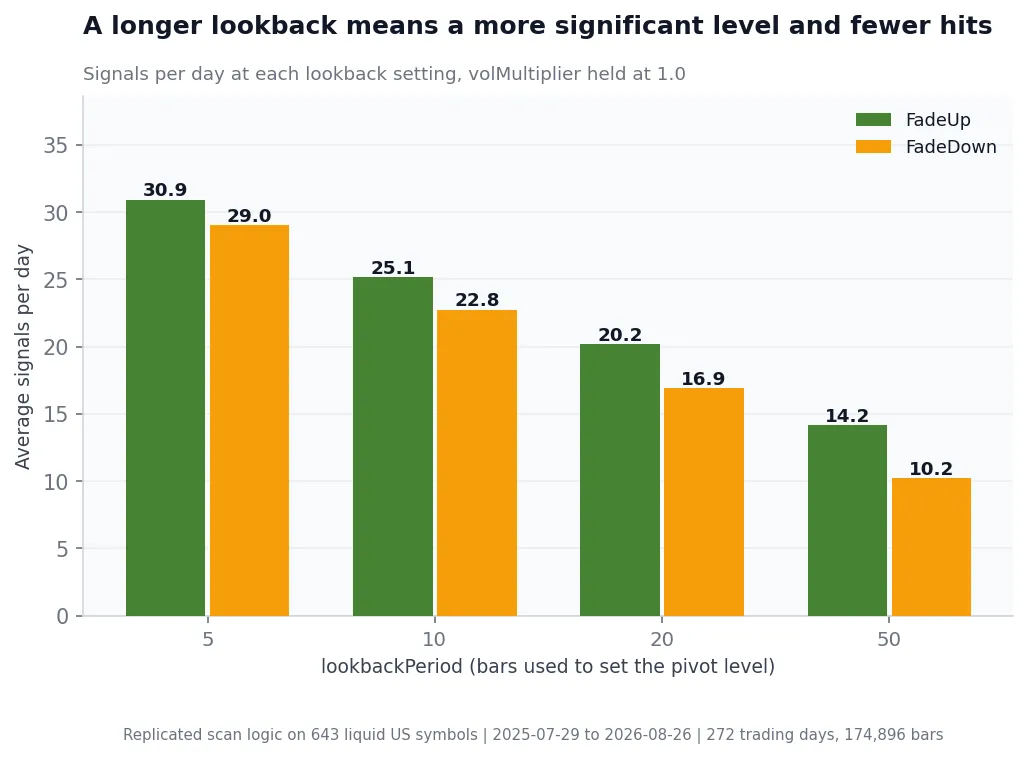
That trade-off is measurable. Dropping the lookback from 20 to 5 raises FadeUp from about 20 signals a day to 31 and FadeDown from 17 to 29, because a five-bar high is a level almost any pullback can clear. Stretching it to 50 cuts FadeUp to 14 and FadeDown to 10, and every one of those bars is rejecting a level that held for roughly ten weeks. Note that the two sides diverge as the lookback grows: over this particular sample, which trended upward, 50-bar failed breakdowns were rarer than 50-bar failed breakouts.
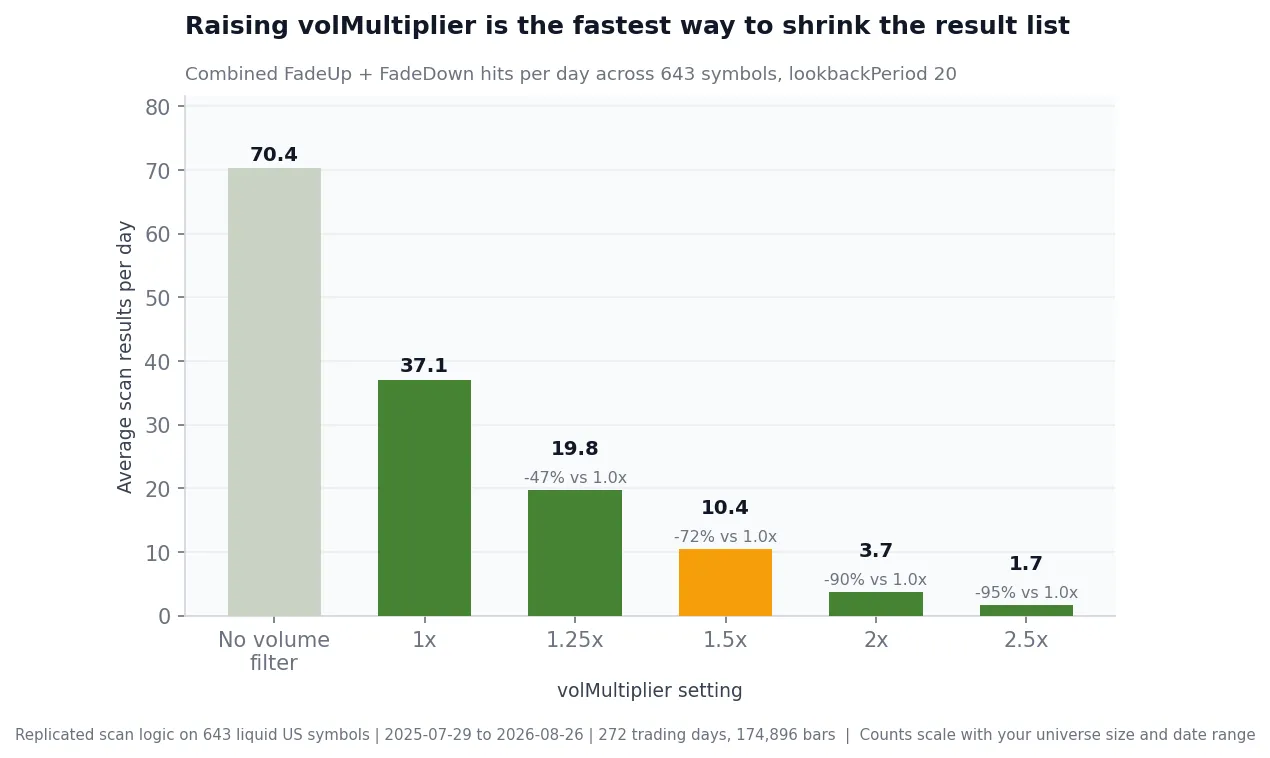
The numbers behind that chart come from running this exact logic over 643 liquid US symbols and 272 trading days. The 1.0 default is already doing real work: without any volume filter the raw price pattern alone fires about 70 times a day across that universe, and requiring merely average volume roughly halves it to 37. Raising the multiplier to 1.5 takes it to about 10 a day, a list one person can actually review before the open. At 2.0 you are down to under four a day, which is a watchlist rather than a scan. Your own counts will differ with universe size, aggregation, and how volatile the period is, but the shape of the decay holds.
How to Trade What the Scanner Returns
The scan is a shortlist builder, not a trade signal. It tells you which names failed a level on real volume. What you do next is a discretionary or rules-based decision that the scan does not make for you.
A common structure for the fade-up setup: enter short on a break of the signal bar’s low, place the stop above the signal bar’s high, and target the opposite side of the range the stock just failed out of. That gives you a risk point defined by the bar itself rather than an arbitrary percentage.
Size the position off the distance between entry and stop, not off a fixed share count. On the AMD example above, the signal bar spanned from a 130.70 high down to a 127.10 close, so a stop above the high is a wide stop in dollar terms and the position size has to shrink accordingly.
We are not publishing a win rate for this pattern, because we have not run it as a full backtest with a stated entry, stop, target, and sample size. A rate without those four things attached is not information. If you want to see what a fully specified breakout ruleset looks like on our side, the opening range breakout indicator and the Volatility Box both publish their levels against defined rules.
Where This Scan Fits Alongside Other Tools
The False Breakout Scanner answers one question: which names failed a level today. It does not tell you whether the broader tape supported that failure, and that context changes how much weight the signal deserves.
For the reasoning behind the pattern itself, including how to read momentum divergence at a failed level, see our longer walkthrough on how to identify and trade false breakouts in ThinkorSwim, which covers the confirmation side that this scan deliberately leaves out.
The scan also defines its level mechanically, as the highest high of the prior N bars. That is deliberate, but it means the level carries no information about how heavily that zone was traded. Overlaying the Supply Demand Edge indicator on the names it returns shows whether the failed pivot sits inside a real supply zone or in thin air.
For the volume side, our breakdown of the best volume indicators for ThinkorSwim covers relative volume, VWAP, and OBV, any of which gives you a second read on whether the participation on the break bar was genuinely unusual.
On the chart side, the free Simple Breakout tool plots the same style of range boundary the scan measures against, so you can see the level the scan used before you commit to fading it.
Known Limitations
- It is a single-bar pattern. The scan evaluates one bar in isolation. It has no concept of trend, so it will return failed breakouts in strong uptrends where fading is the wrong side of the tape.
- The pivot ignores round numbers and prior structure. The level is purely the highest high of the prior N bars. If a more meaningful level sits 30 cents away, the scan does not know about it.
- Results depend on your universe. Run against a low-float small cap watchlist and the volume filter behaves differently than it does against the S&P 500.
- Scan results are end-of-bar. On a daily aggregation the condition can only be confirmed at the close, so the shortlist is for the next session, not for an intraday entry on the signal bar itself.
None of these are defects in the code. They are the boundary of what a three-condition scan can know, and the reason the output is a shortlist rather than an entry.
Download the Scan
Both code blocks above are free to copy. Paste them into the Stock Hacker study filter, set the condition to true, and save each one as its own scan. Every other free scan we publish is on the ThinkorSwim scanners page, and the code patterns behind them are explained in our ThinkScript tutorials.
Educational content only. Nothing here is a trade recommendation or investment advice. Test any scan against your own rules and risk limits before trading it.
False Breakout Scanner.ts
#Written by TOS Indicators 2026

#Home of the Volatility Box

#Scan: False Breakout Scanner (Short Setup)

#Full Tutorial Link: tosindicators.com/scans/false-breakout-scanner/

input lookbackPeriod = 20;

input volumePeriod   = 20;

input volMultiplier  = 1.0;

def pivotHigh = Highest(high[1], lookbackPeriod);

def pivotLow = Lowest(low[1], lookbackPeriod);

def avgVolume   = Average(volume, volumePeriod);

def aboveAvgVol = volume >= avgVolume * volMultiplier;

def highAbove  = high  > pivotHigh;

def closeBelow = close < pivotHigh;
def lowBelow   = low   < pivotLow;
def closeAbove = close > pivotLow;

plot FalseBreakoutUp = highAbove and closeBelow and aboveAvgVol;

#plot FalseBreakdownDown = lowBelow and closeAbove and aboveAvgVol;
Want the .ts file and the one-click import? Both come with a free account.
A false breakout is a bar whose high or low pierces a key level but whose close finishes back on the original side of it. The breakout attempt was made and rejected inside the same bar, leaving traders who entered on the break in a losing position at the close.
The [1] offset excludes the current bar, so the pivot level is set entirely by prior bars and is fixed before the session opens. Without it, a bar making a new 20-day high would define the very level it is being measured against, and the breakout condition could never be true.
No. The pivot level uses a [1] offset, which excludes the current bar, so the level is fixed before the current bar begins. Once a bar closes, its signal state is final and does not change on later bars.
ThinkorSwim evaluates exactly one boolean plot per custom study filter in the Stock Hacker. Combining the fade-up and fade-down logic into one study would leave the scanner with no way to know which condition you wanted to filter on, so the logic ships as TI_FalseBreakoutScanner_FadeUp and TI_FalseBreakoutScanner_FadeDown.
The scan reads whatever aggregation period the Stock Hacker is set to. On a daily aggregation the default 20-bar lookback becomes a 20-day high or low. On a 5-minute aggregation it becomes the high or low of the last 100 minutes, which suits intraday rejection setups better than swing setups.
Without the volume condition the scan returns bars that poked a level on almost no participation, which carries no information about supply or demand. Requiring above-average volume keeps results to bars where a real attempt was made and rejected.
All three inputs are exposed in the Study Filter dialog, so you can change lookbackPeriod, volumePeriod, and volMultiplier without editing the ThinkScript. Raise volMultiplier from the 1.0 default to 1.5 or 2.0 to cut the result count down to bars with heavier participation.
We are not publishing one. A win rate is only meaningful with a stated entry rule, stop, target, universe, date range, and sample size attached, and this scan is a shortlist builder rather than a specified strategy. Define your own exit rules, then backtest that specific ruleset before sizing real risk against it.
Here are some resources that you may find useful:




Ready to Trade With an Edge?
Join 40,000+ traders using institutional-grade tools for ThinkOrSwim.
Get the Bundle