
Opening Range Breakout (ORB) Strategy for ThinkOrSwim
Learn the ORB strategy, build a free ThinkScript indicator, backtest your settings, and find the best breakout opportunities in real-time with our dedicated platform.
ORB Strategy Video Course (6 Parts)
This free video series covers everything you need to trade opening range breakouts — from the basics to a complete daily trading routine.
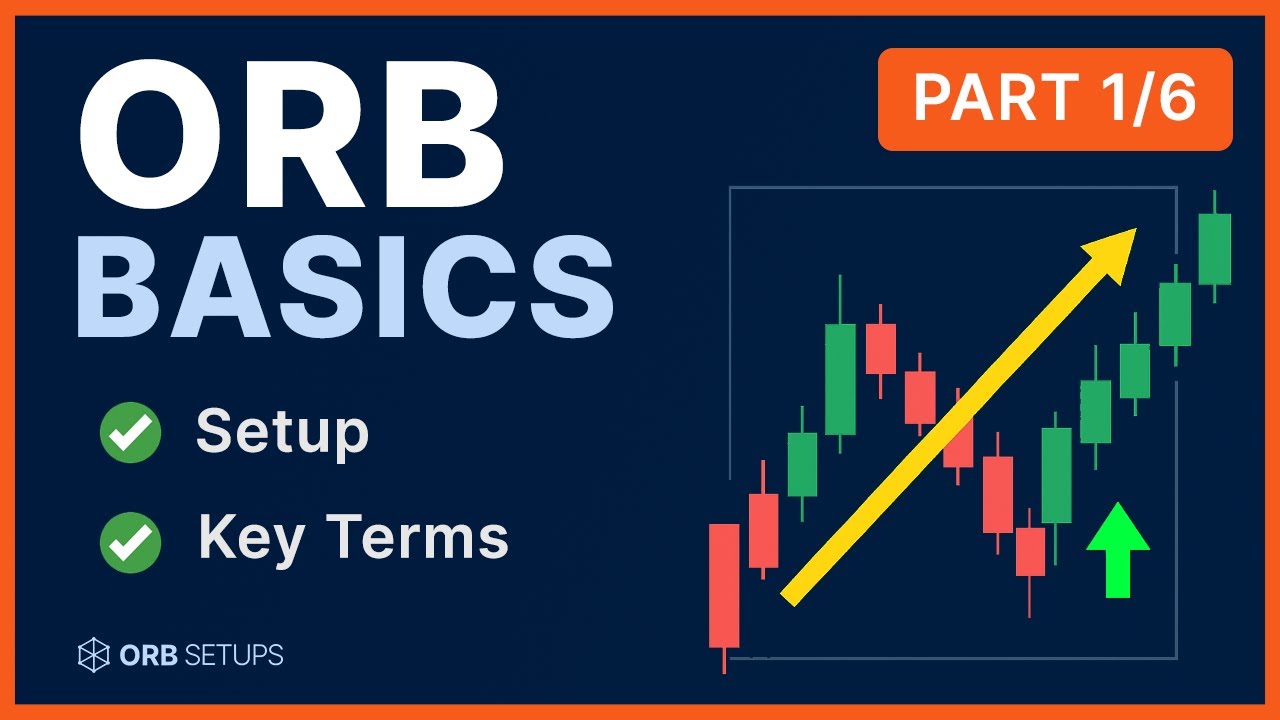 Part 1
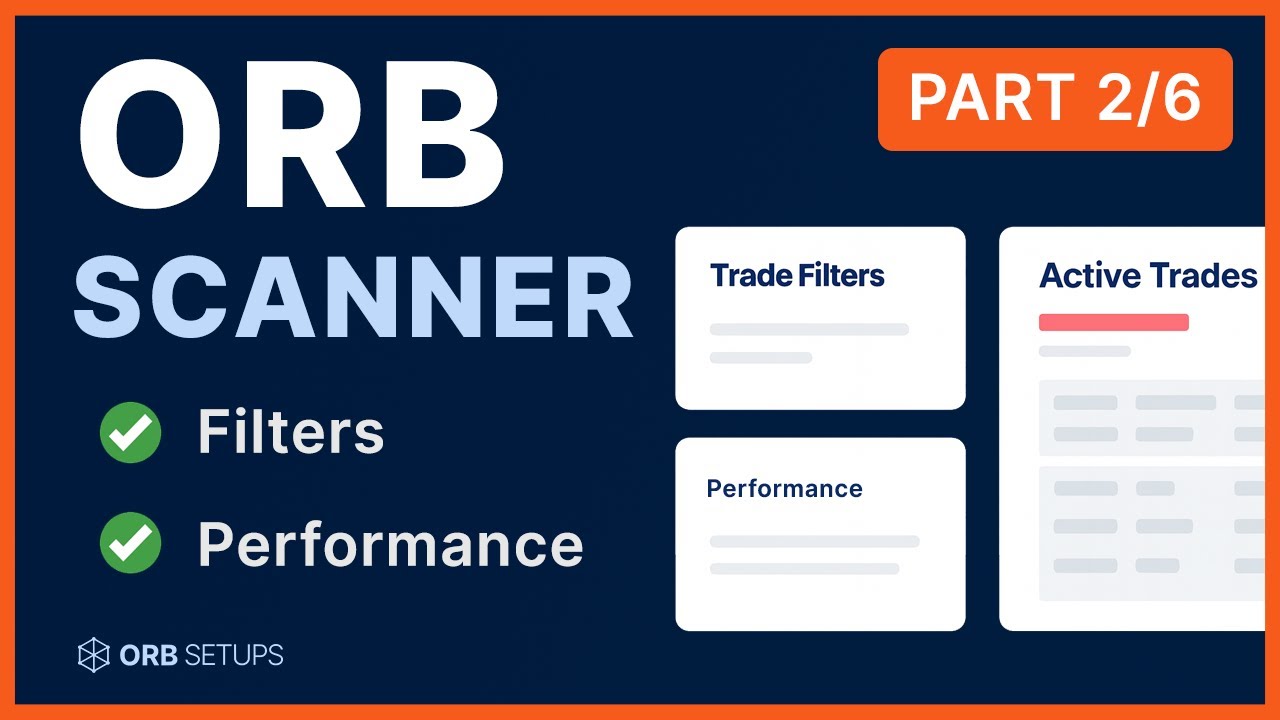 Part 2
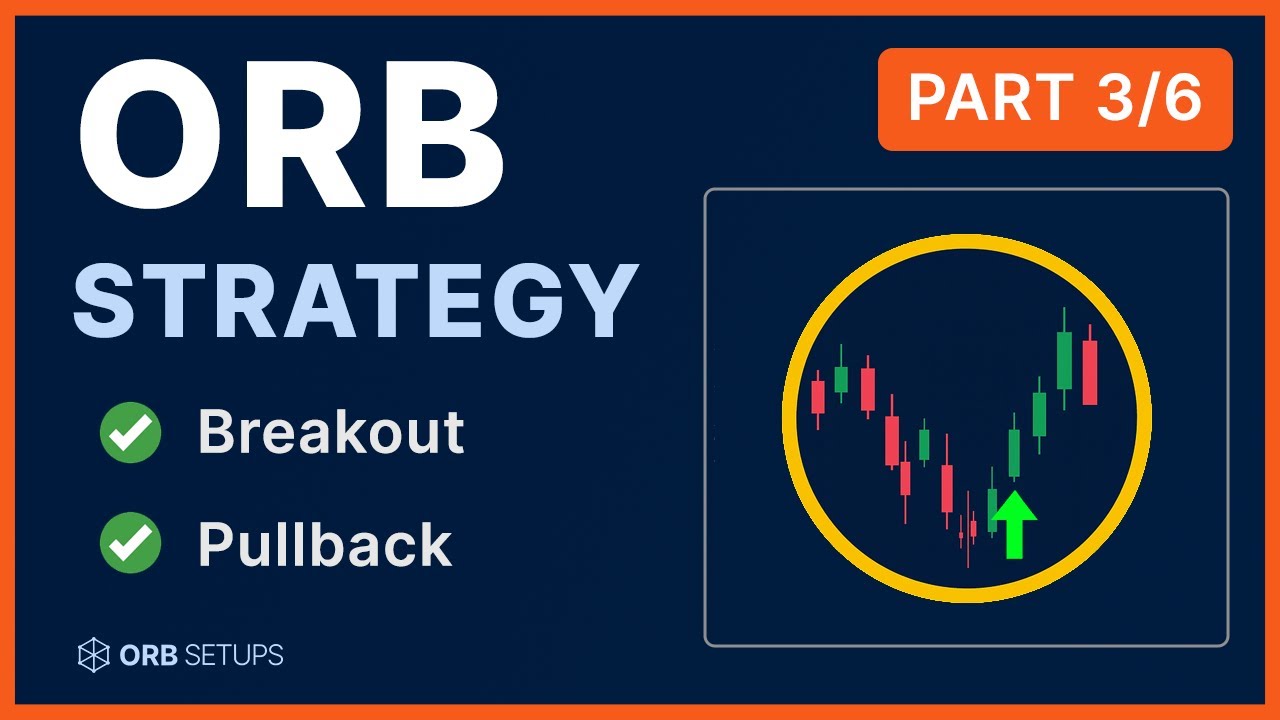 Part 3
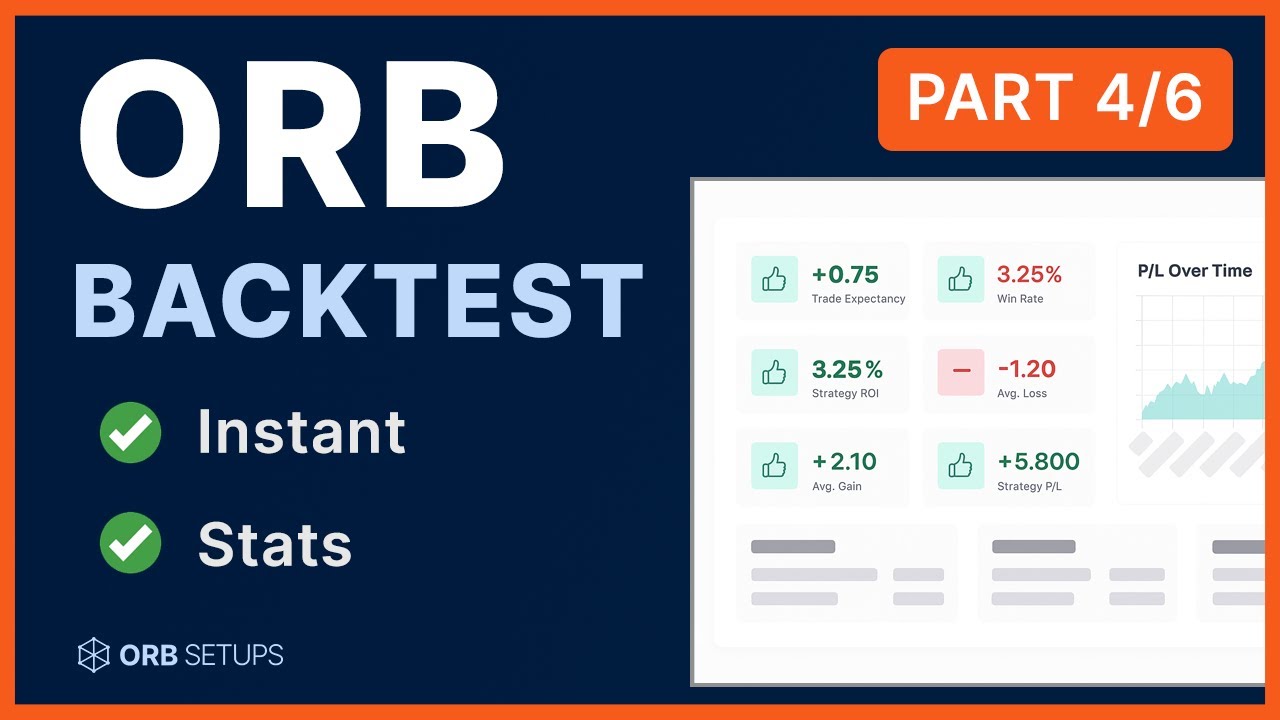 Part 4
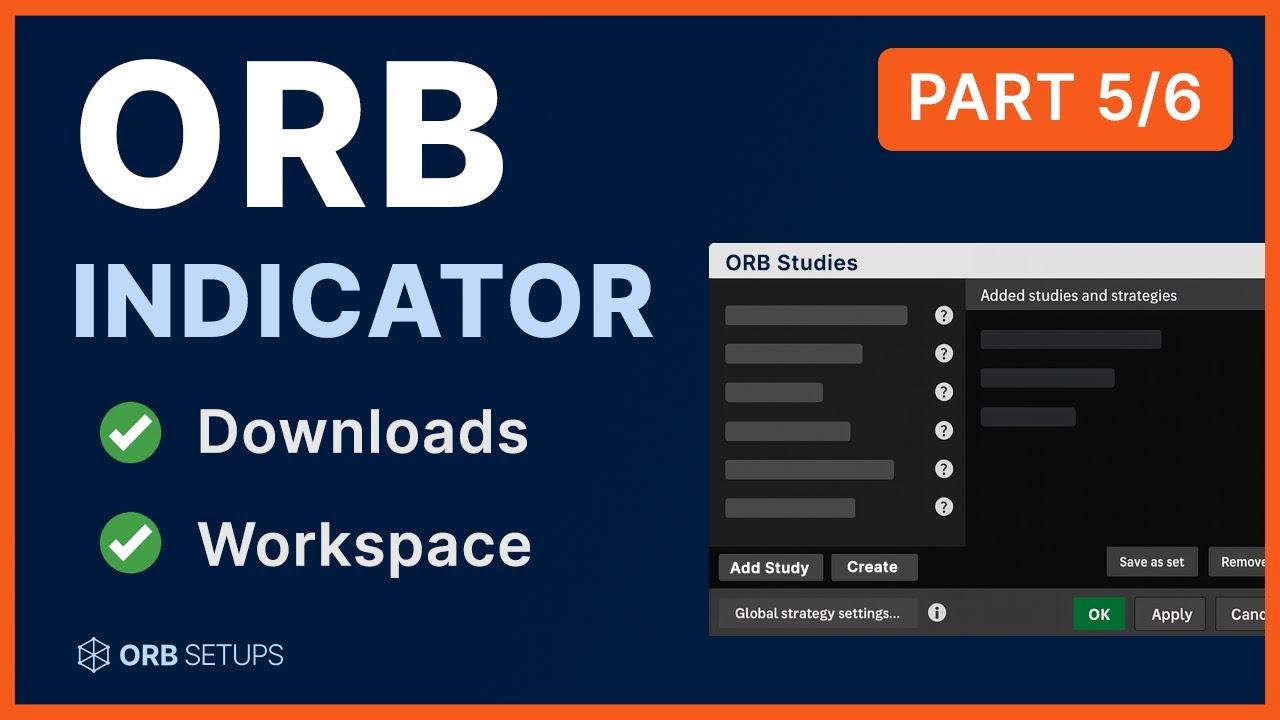 Part 5
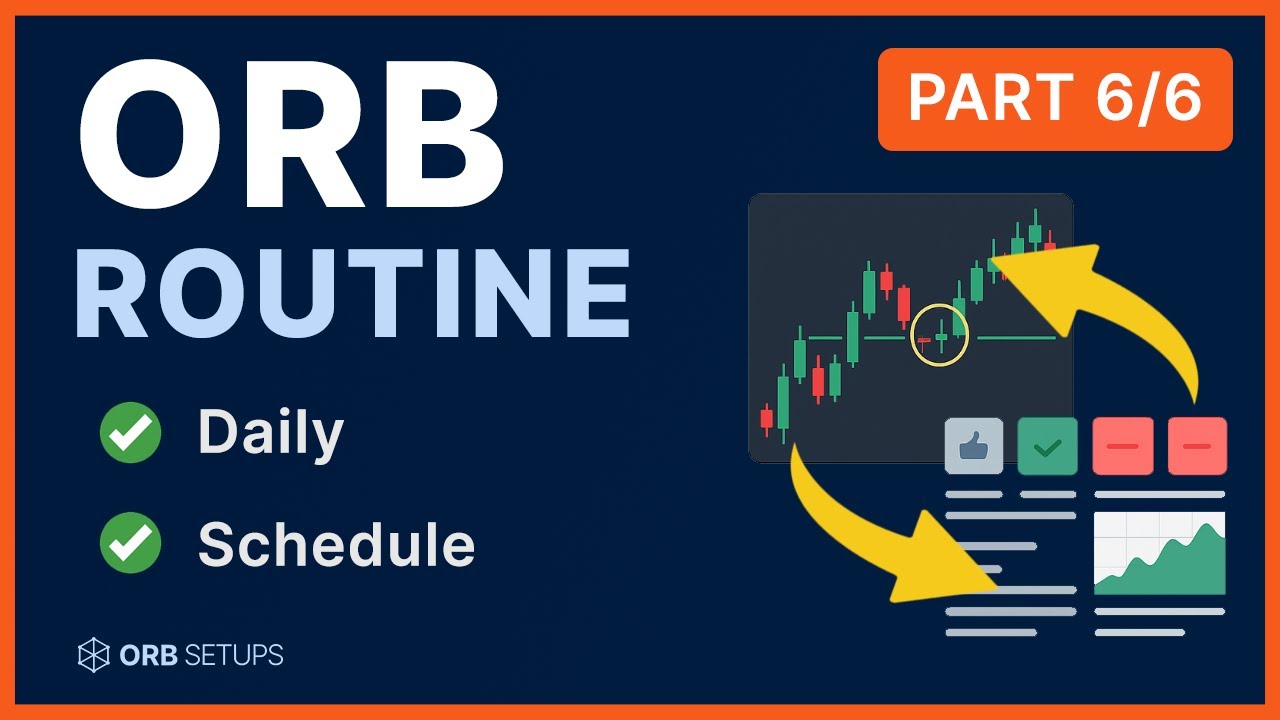 Part 6
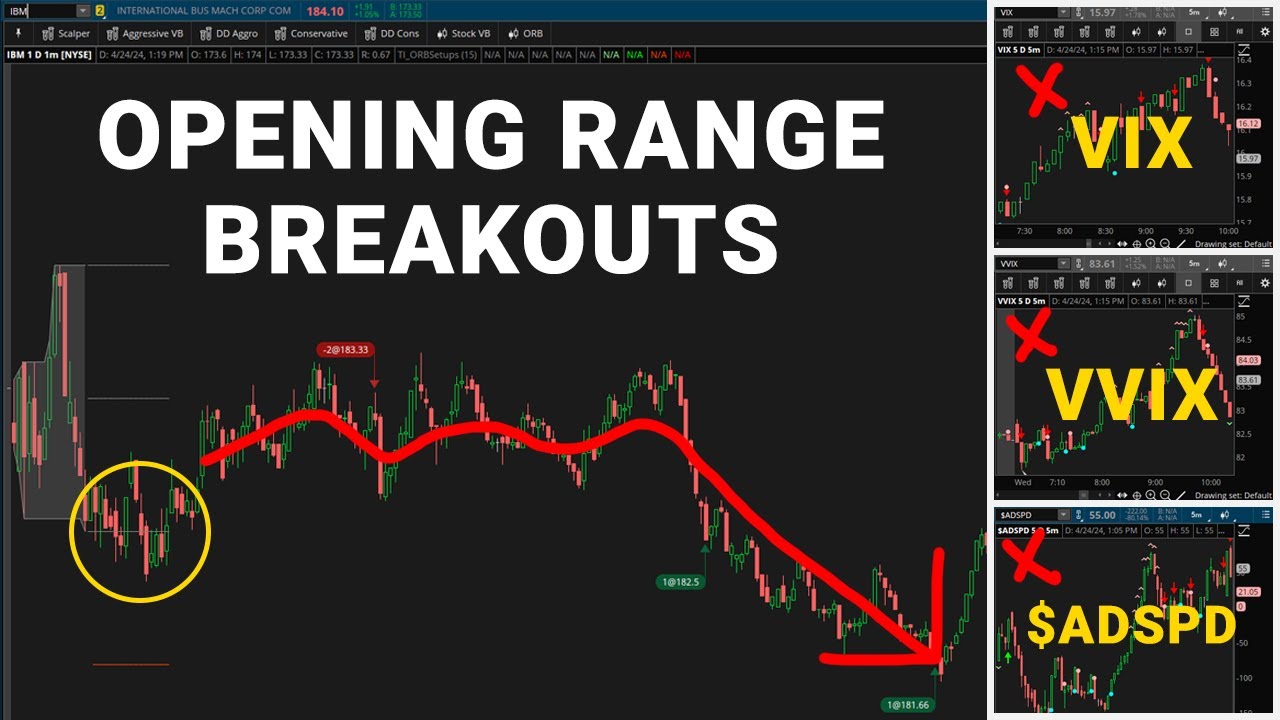
What is the Opening Range Breakout?
The Opening Range Breakout (ORB) is a momentum-based trading setup in which you wait for price to break outside of its morning opening range. The standard opening range spans 9:30-10:00 AM EST (the first 30 minutes). You draw lines marking the highest high and lowest low during this period, creating breakout levels for potential trades.
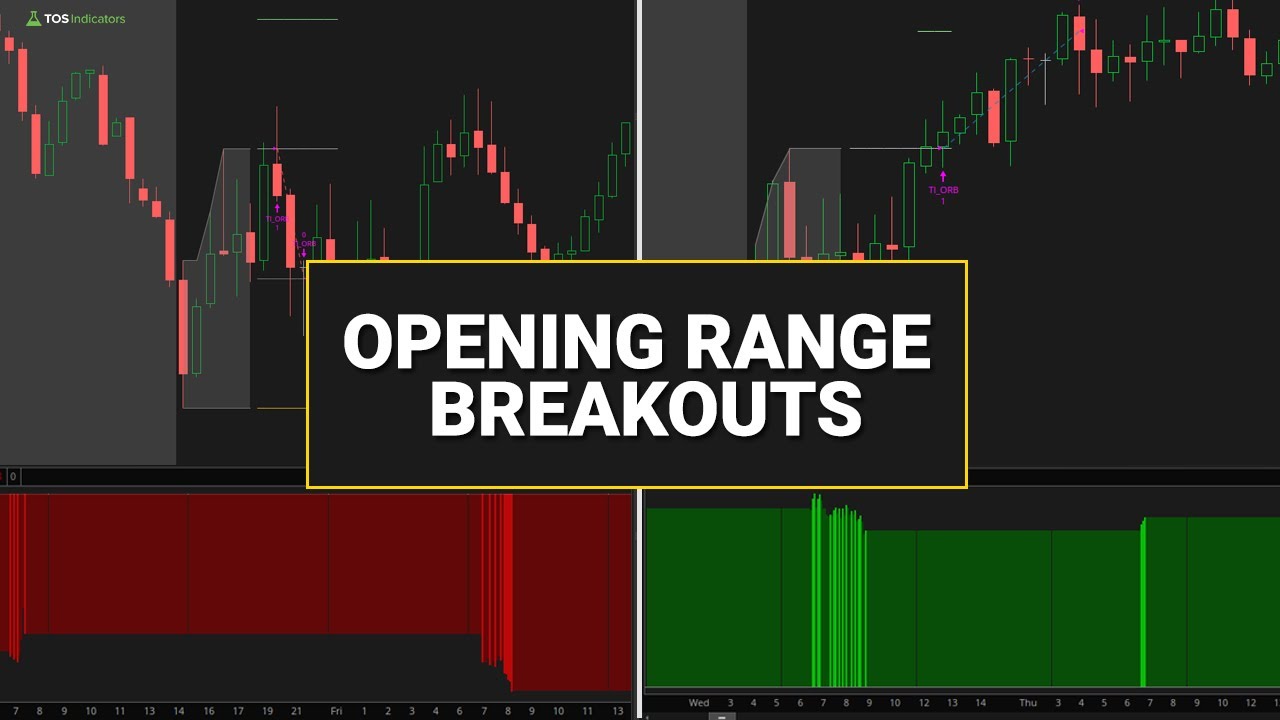
Two Types of Breakouts
There are two primary methods for defining when a breakout occurs:
- Wick Touch — The breakout triggers when price wicks breach the ORB levels. This gives faster entries but weaker confirmation, as the price may quickly reverse.
- Close Above — The breakout only triggers when full candle bodies close beyond ORB levels. This provides worse fills but stronger confirmation of the move.
Most traders start with the "Close Above" method for higher win rates, then experiment with "Wick Touch" as they gain experience.
Key Takeaways
- Opening range typically defined as 9:30-10:00 AM EST (30 minutes)
- Breakout above the high = bullish signal
- Breakout below the low = bearish signal
- Works on stocks, ETFs, and futures (especially SPY, QQQ, ES, NQ)
- Best results between 10:00 AM - 12:00 PM EST
Free ORB Indicator for ThinkOrSwim
We've built a complete ThinkScript indicator that automatically plots the opening range levels, generates breakout signals, and shows profit targets. The indicator includes customizable timeframes, entry mode selection, and built-in alerts.
# Opening Range Breakout Indicator
input openingRangeStartTimeEST = 930;
input openingRangeEndTimeEST = 1000;

# Track the opening range high and low
def ORHigh = if openingRange and !openingRange[1] then high
             else if openingRange then Max(ORHigh[1], high)
             else ORHigh[1];

# ... 80+ more lines of code
Get the Complete Indicator
Full ThinkScript code with step-by-step video tutorial showing exactly how to build and customize the indicator.
- Customizable opening range times
- Entry mode selection (Wick Touch / Close Above)
- Range projections for profit targets
- Built-in breakout alerts
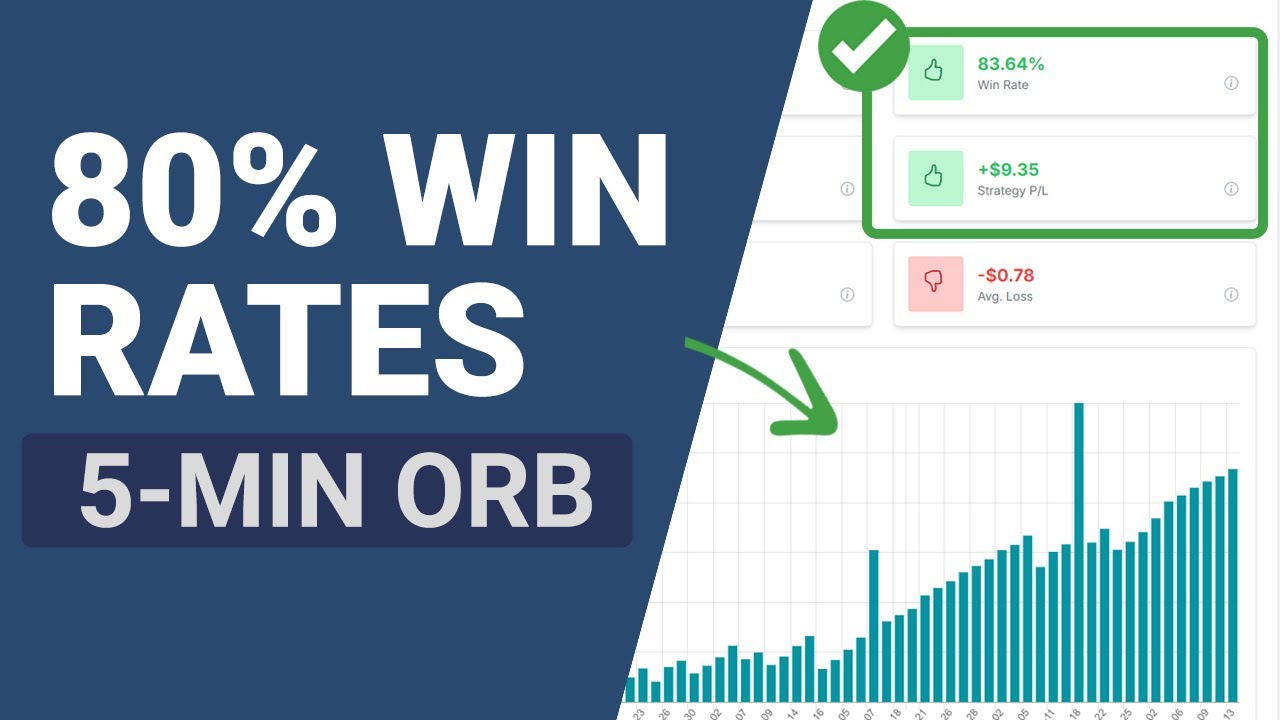
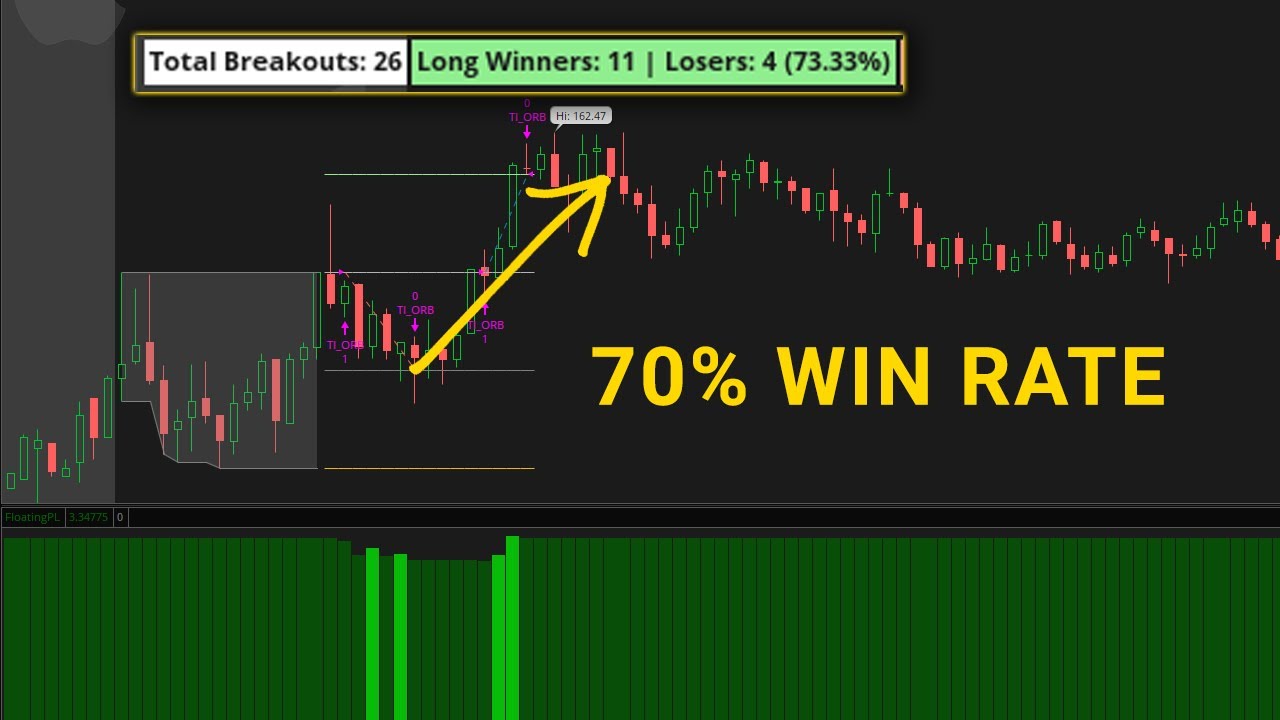
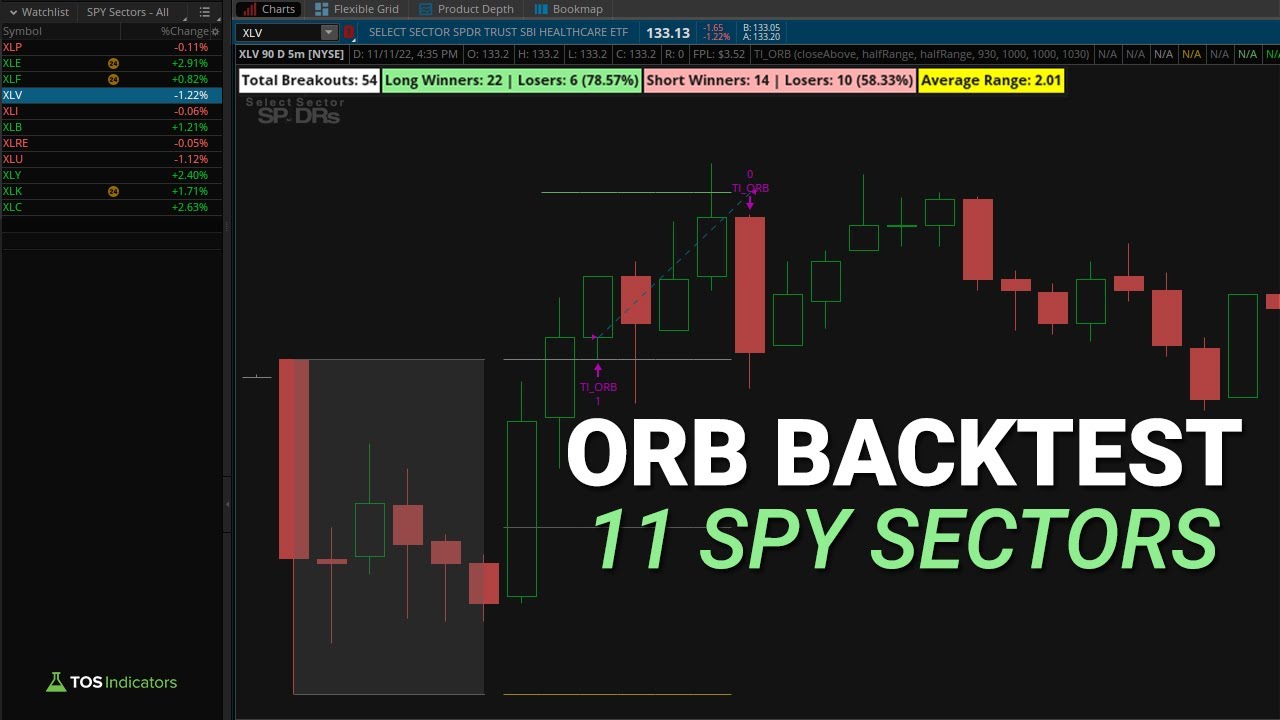
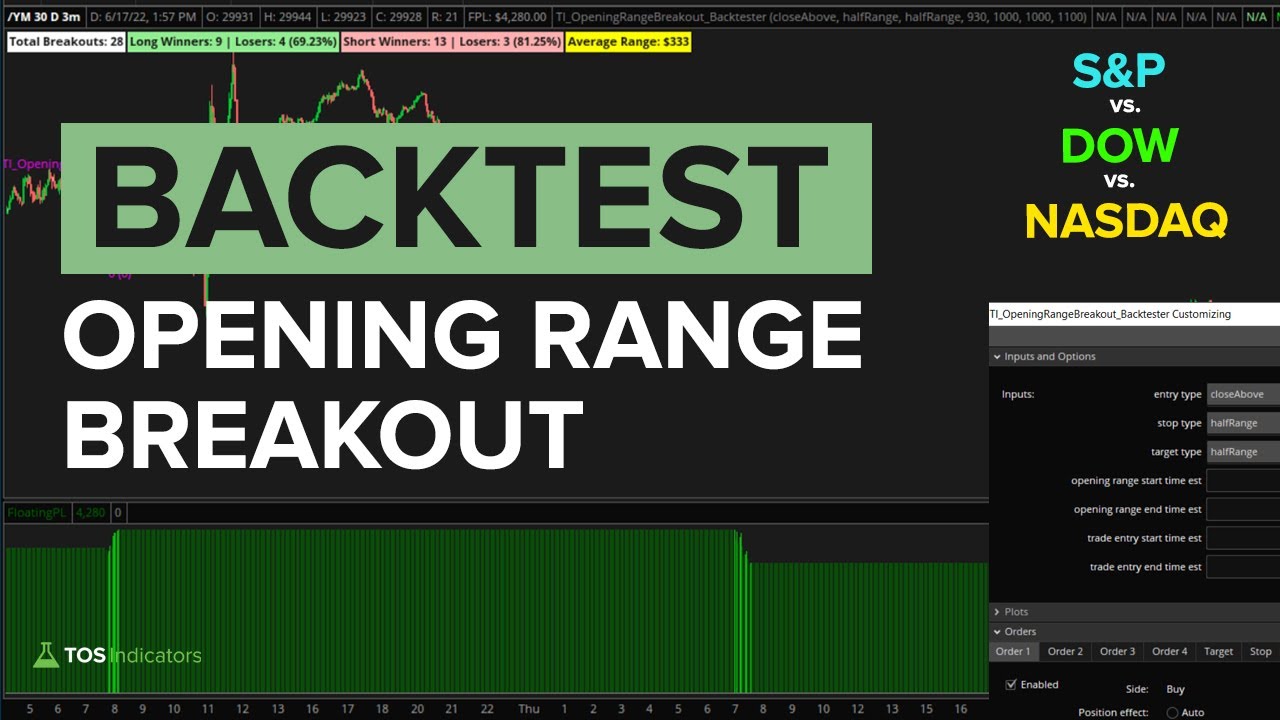
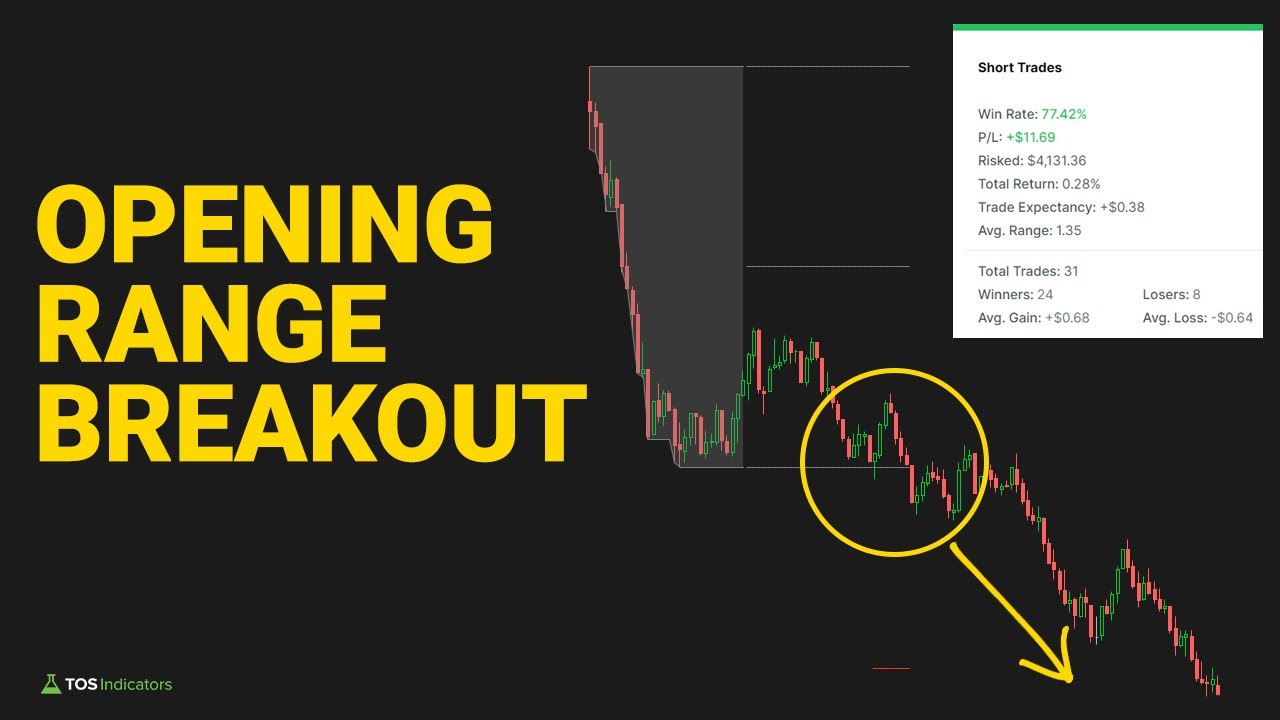
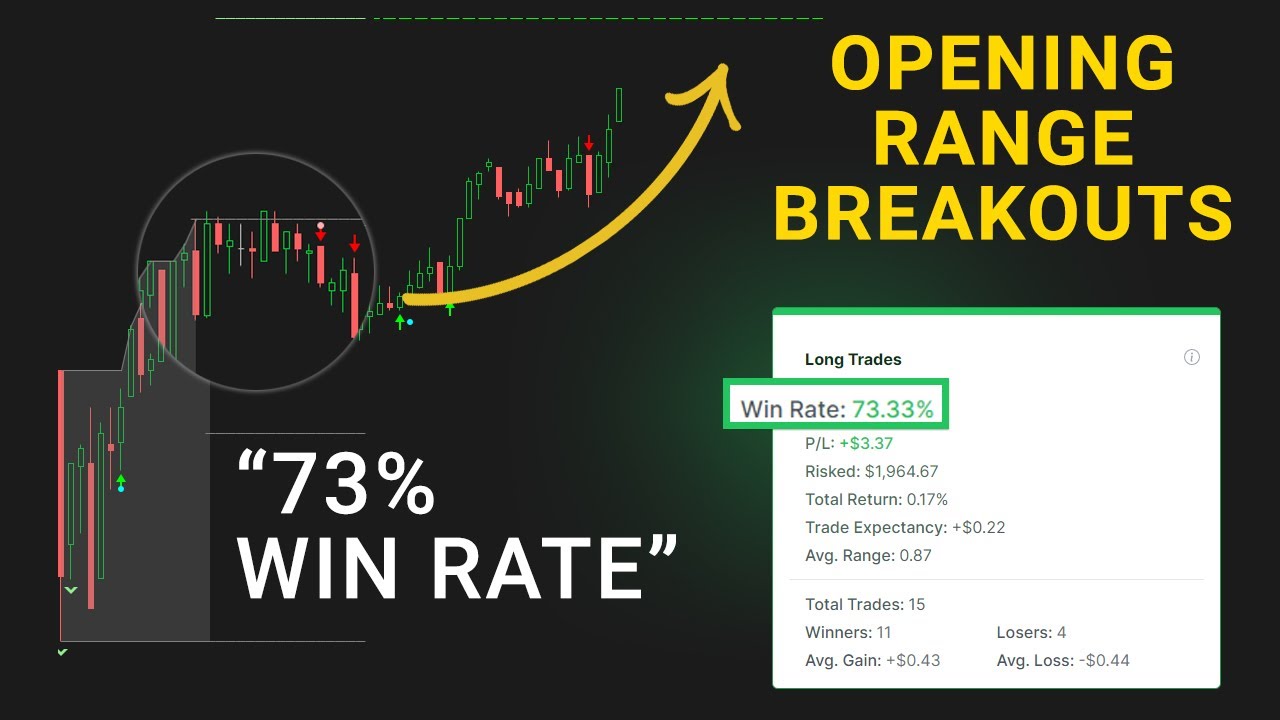
ORB Backtest Results
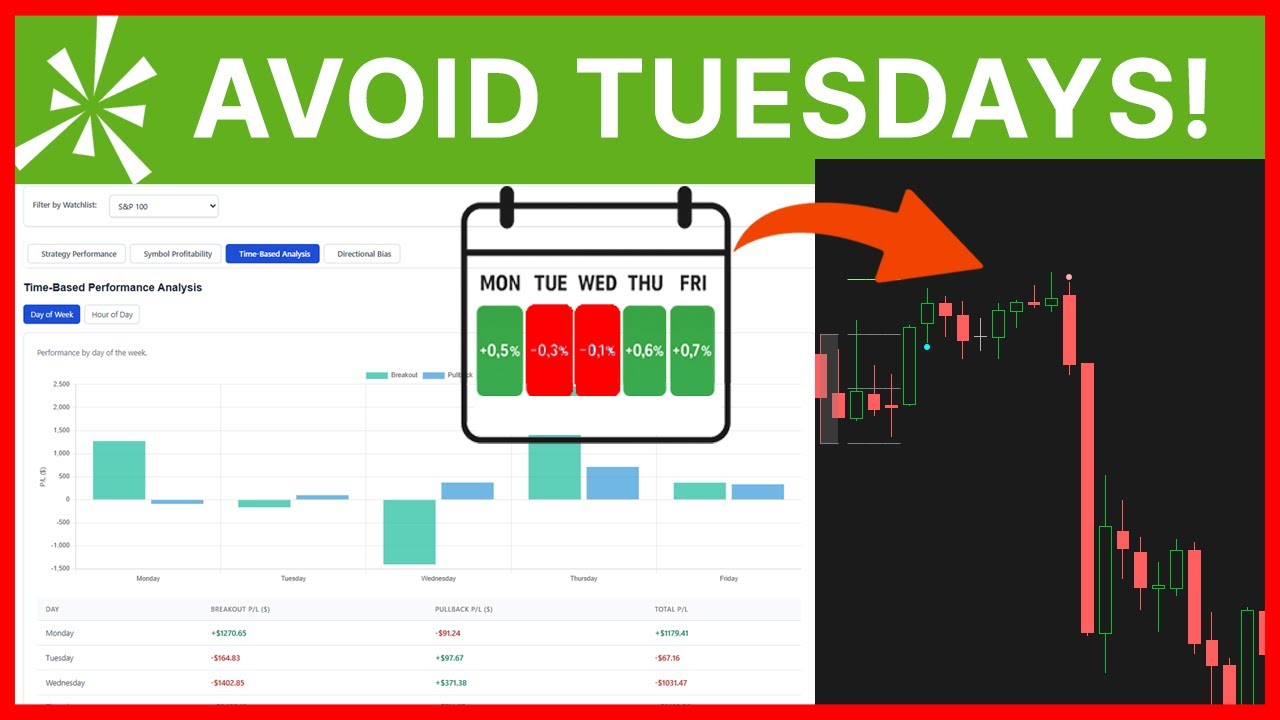
One of the most important insights from backtesting: ORB performance varies dramatically by symbol. You can avoid taking trades in markets where the setup isn't working and focus on where it IS working.
Example Results from Backtesting
- SPY: Negative results over recent 10-day period
- XLE: Consistently profitable with clear trends
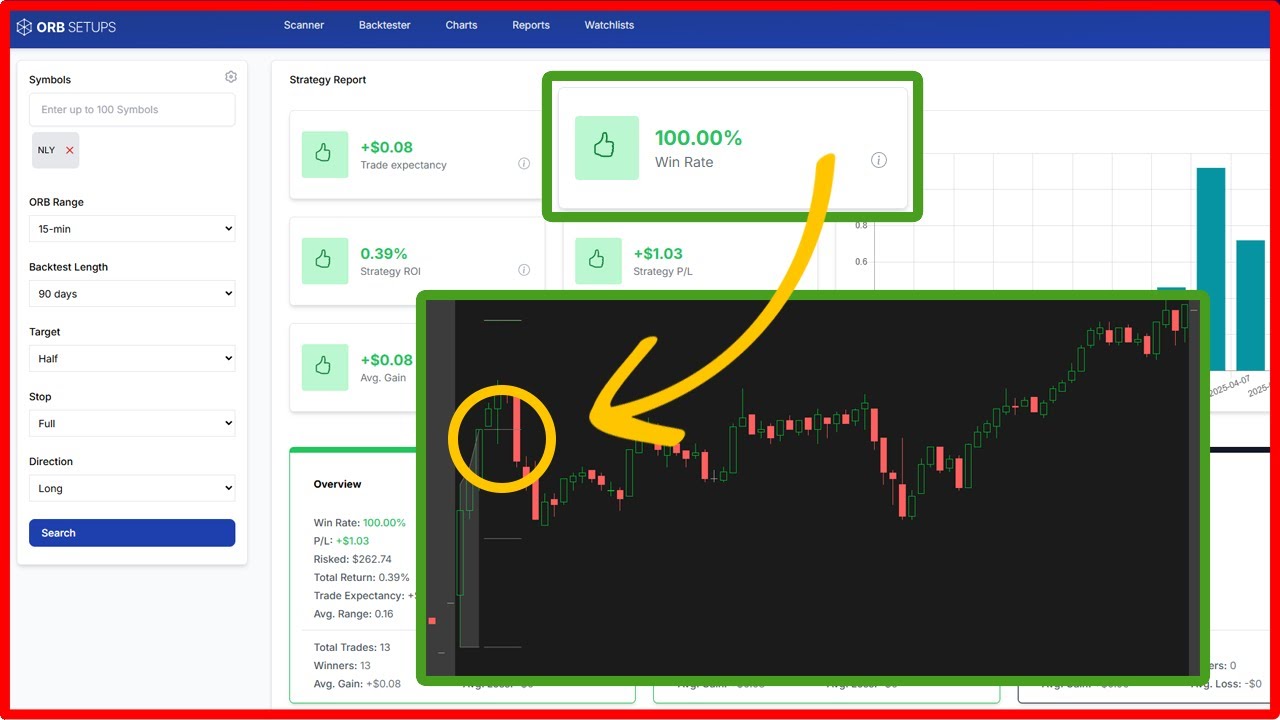
- TEAM: 100% win rate across 6 trades
This is why the backtester is essential — it shows you exactly where to focus your ORB trading.
Backtest Videos
Find ORB Setups Automatically
The ORB Setups platform scans thousands of stocks to find high-probability breakouts each morning — with instant backtesting built in.
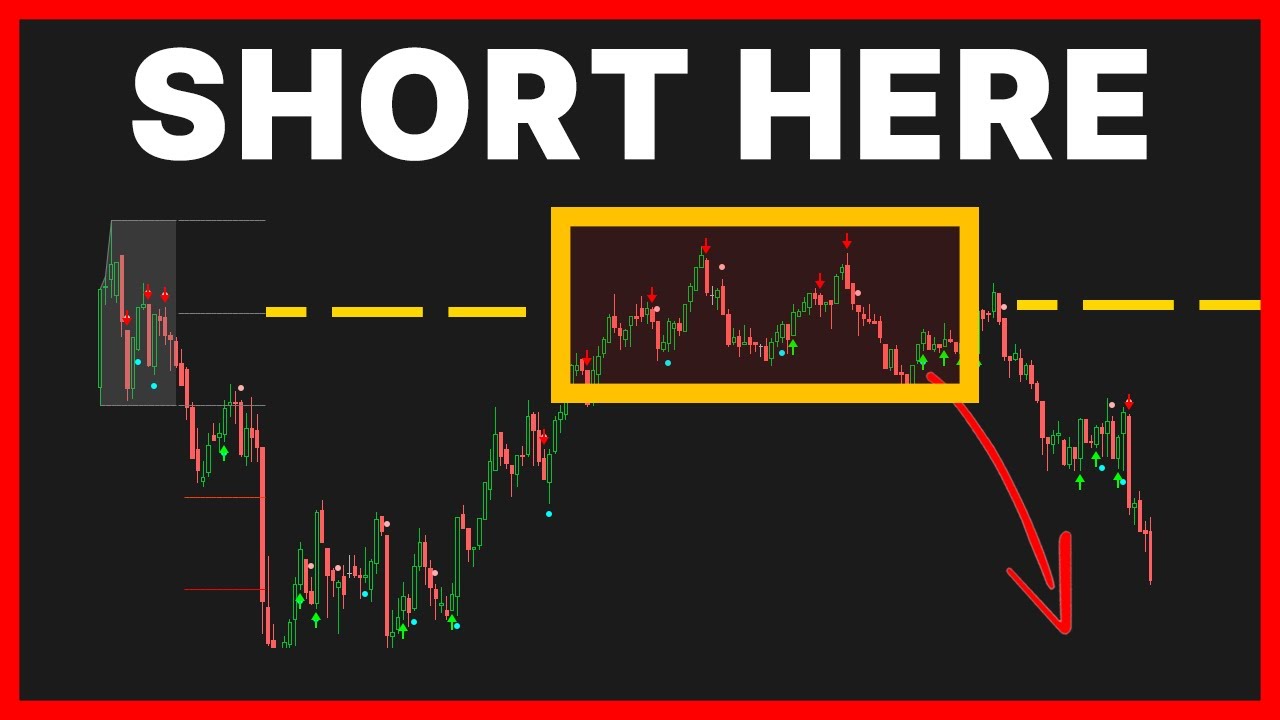
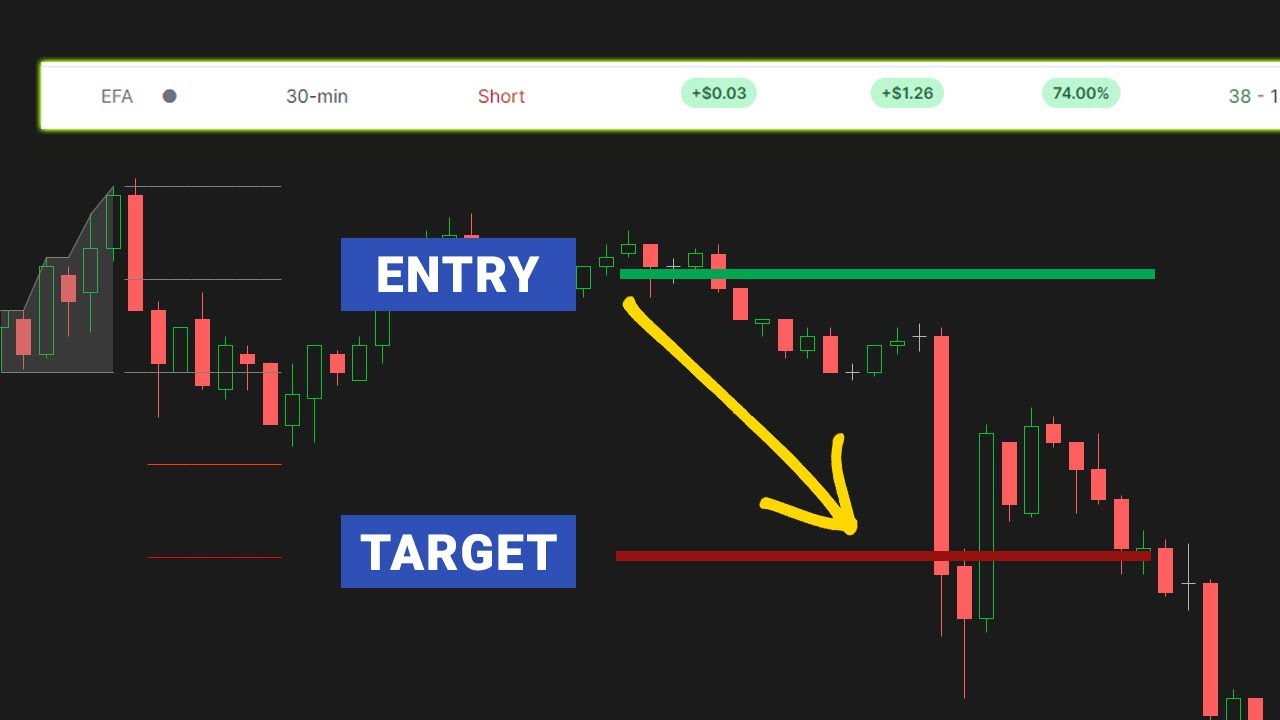
ORB Trade Examples
Watch real ORB setups and how they played out.
ORB Trading Tools
Three ways to trade opening range breakouts — from free indicator to dedicated platform.
ORB Indicator
Free ThinkOrSwim indicator with customizable settings, entry modes, and built-in alerts.
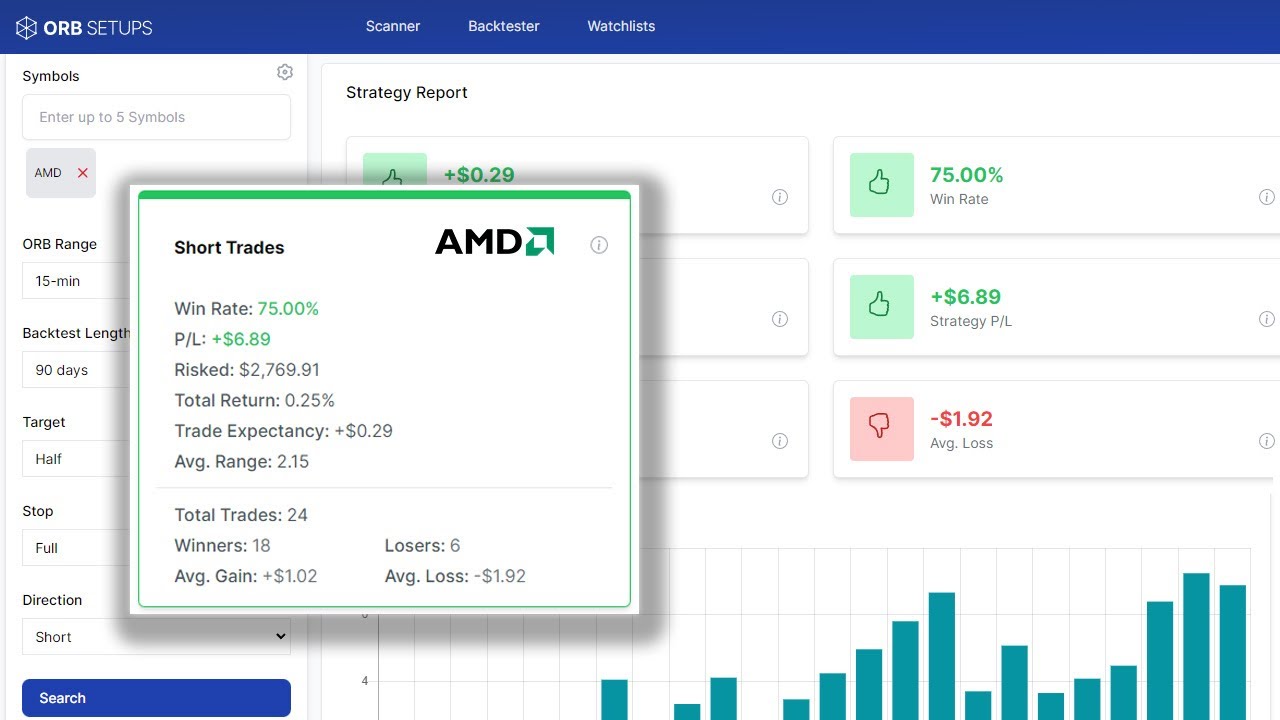
Download Free →ORB Backtester
Test ORB strategies on any symbol directly in ThinkOrSwim. See win rates, avg returns, and optimal settings.
View Backtester →ORB Setups Platform
Real-time scanner that finds the best ORB opportunities across thousands of symbols with instant backtesting.
Visit orbsetups.com →Frequently Asked Questions
The 30-minute opening range (9:30-10:00 AM EST) is the most widely used and tends to offer the best balance between capturing early momentum and filtering out false breakouts. Use 2-minute charts for 15-30 minute ORB ranges, and 1-minute charts for 5-minute ORB ranges.
Yes, ORB is extremely effective on index futures like ES (S&P 500 E-mini) and NQ (Nasdaq E-mini). Futures offer high liquidity, tight spreads, and often cleaner breakouts. You can even use custom pre-market times like 4:00-4:30 AM ET for ES_F with volume filters.
Win rates vary significantly by symbol. Our backtesting shows SPY can have negative results over certain periods, while symbols like XLE show consistent profitability and TEAM achieved 100% win rate across 6 trades. The key is using backtesting to find WHERE the setup is currently working.
Wick touch entries trigger when any part of a candle breaches the ORB level - faster entries but weaker confirmation. Close above entries only trigger when the full candle body closes beyond the level - worse fills but stronger confirmation. Most traders start with close above for higher win rates.
Most ORB edge diminishes after 2:00 PM EST. The strongest moves typically occur between 10:00 AM and 12:00 PM. Our backtesting shows significantly worse performance for entries taken after 1:00 PM. The trade window is configurable in our indicator.
The most common approach is placing your stop at the opposite side of the opening range. For a long breakout above the OR high, your stop goes below the OR low. You can also use the half-range (midpoint) for tighter stops with better risk/reward.
The ORB Setups platform (orbsetups.com) provides a real-time scanner that identifies the best ORB opportunities across thousands of stocks and ETFs. It includes instant backtesting so you can see historical performance for each symbol before trading.
Yes, ThinkOrSwim supports automated trading through its Strategy feature. You can create conditional orders based on ORB levels, or use ThinkScript to build fully automated strategies. Our indicator includes alert conditions you can use as triggers.
Start Trading Opening Range Breakouts
Get the free indicator or find the best setups with our platform.