Unusual Volume
Build 4 scans to easily find stocks with greater than "X" standard deviation volume, with customizable inputs.

For our 20th episode of “How to thinkScript,” we’re going to be building 4 scans all designed to help us find some high probability trade setups, that are happening with unusual volume opportunities.
The goal of this tutorial is simple - I want to show you how you can let ThinkOrSwim do the heavy lifting for you, and go out and find trade opportunities that are interesting setups, with higher probabilities (and logic) supporting the trade.
We’ll write these scans from scratch, using the custom study filters in the TOS scans area, and leverage some built-in studies to help us objectively look at volume.
There are two separate parts of this tutorial:
- Part 1 -- Free for everyone (this tutorial)
- Part 2 -- Free for Volatility Box members (available here)
For our Volatility Box members, we’ve taken this tutorial one step further, to design 4 additional scans (so a grand total of 8), for some of our more popular, unusual volume setups.
In this particular video, we’re going to build four scans:
- In our first scan, we’re looking to find stocks and futures where we have more than 4 SD volume move – this is to say, that we are in extreme volume territory, which is usually followed by a persistent move in one direction or another. This scan will help us get ahead of that.
- The next one that we’ll build is looking for consistent and multiple bursts of greater-than-usual volume (using statistics) over a 5-day period.
- Next, we’ll take this over to the Option’s Hacker to try and get as close to the “Sweep” functionality where you’re to find high buying or selling activity down to particular option strikes.
- And finally, we’ll conclude with building a scan to find unusual volume opportunities setting up near some of our key moving averages, including the 50-Day and 200-Day.
The four additional scans that we build in the Unusual Volume Pro Scanner includes:
- Incorporating all of our knowledge from the Triple Pro Squeeze course, and combining that with unusual volume to find better quality squeeze setups.
- Intra-day unusual volume scanner that alerts us when we have interesting volume happening near important support areas, like the VWAP.
- Flip unusual volume on its head, to find "hidden gem" trade opportunities where we still have an edge to enter the trade
- Combine our overbought/oversold confirmation signals with unusual volume to find ideal entry points on trend pullbacks, reversal areas, etc.
I think this should be a good hands-on tutorial, for those of you looking to learn how to build your own scans. And especially for those of you interested in building volume-related scans for ThinkOrSwim.
All the scan snippets are available for free download below.
Volatility Box Invite
We are TOS Indicators.com, home of the Volatility Box.
The Volatility Box is our secret tool, to help us consistently profit from the market place. We’re a small team, and we spend hours every day, after the market close, doing nothing but studying thousands of data points to keep improving and perfecting the Volatility Box price ranges.
We have two different Volatility Boxes - a Futures Volatility Box and a Stock Volatility Box.
Futures Volatility Box - Trade Major Markets With an Edge
Designed For: Futures, Micro-Futures and Index Market Traders
Supported Models: Hourly Volatility Box models
Supported Markets: 10 Major Futures Markets
The Futures Volatility Box comes with:
- 5 Volatility Models for each market
- Support for 10 Futures Markets (/ES, /NQ, /YM, /RTY, /CL, /GC, /SI, /ZB, /HG, /NG)
- Video Setup Guide
- Trade Plan
- Access to all members-only resources, including Squeeze Course
Learn More About the Futures Volatility Box
Trade futures and micro futures with a consistent volatility edge
Stock Volatility Box - Powerful Web Based Volatility Platform
Designed For: Stock and Options Traders
Supported Models: Hourly and Daily Volatility Box models
Supported Markets: 10,000+ Stocks and ETFs (new markets added frequently)
A Stock Volatility Box membership includes access to:
- Live Scanner - A powerful scanner we've built from scratch, to scan 10,000 symbols every 2 seconds for new volatility breaches
- Dashboard - A quick and easy way to view daily volatility model levels online
- Short Interest Scanner - Short interest, Squeeze, and EMA data to find short squeezes
- Squeeze Course - All of our proprietary squeeze tools, including robust backtesters
- All Members Only Indicators - We don't nickel and dime you. Everything really is included.
- And much more!
Learn More About the Stock Volatility Box
Trade stocks and options with a consistent volatility edge
What is the Relative Volume Standard Deviation indicator?
We use the Relative Volume Standard Deviation indicator, which is built-in ThinkORSwim, to help us assess volume on a relative scale.
With the inclusion of a metric like standard deviation, we now have the power to very easily eliminate a good chunk of the data that we need to analyze. We've also created a much easier, objective way of looking for "greater than usual" (aka unusual) volume.
For those that are curious, the TD Ameritrade documentation page has more information around the indicator, which can be accessed here.
Scan 1: Greater Than 4 Standard Deviation Volume
In order to scan for unusual volume with 4 SD+, we can use the Relative Volume Standard Deviation function's plots, in our scan.
The scan code for this looks something like the following:
plot volumeCondition = RelativeVolumeStDev(50).RelVol >= 4;Scan 2: Multiple Days of Greater Than 3 Standard Deviation Volume
In order to scan for unusual volume, we're searching for places in which we have multiple days with greater than 3 standard deviation volume.
Specifically, we'd like to see 3 out of 5 days have 3 SD+ volume.
The scan code for this looks something like the following:
#defining places in which we have greater than [x] SD of volume
def volumeCondition = RelativeVolumeStDev(50).RelVol >= 3;

#scanning to see where we have greater than 3 SD+ volume, on 3 out of the past 5 days
plot signal = Sum(volumeCondition, 5) >= 3;
Scan 3: Unusual Volume with Option's Hacker
We'll now leverage the first and second scans, and use them in conjunction with the option's hacker.
While we can't truly emulate scanning for specific option strikes, we can get close, by combining high volume in specific option strikes, with unusual volume in the underlying.
Our scan here looks something like this:

Scan 4: Unusual Volume Around 50 SMA and 200 SMA
For our fourth and final scan, we're going to bring in some key moving averages, and use unusual volume to find opportunities around these zones.
We have a few different ways of looking at this:
Price Crosses Above 50 SMA:
def SMA50 = SimpleMovingAvg(close,50);
def SMA200 = SimpleMovingAvg(close,200);

def SMACondition = close crosses above SMA50 and close > SMA200;
Price is Within A Certain Percent of 50 SMA:
def SMA50 = SimpleMovingAvg(close,50);
def SMA200 = SimpleMovingAvg(close,200);

def SMACondition = AbsValue(close - SMA50)/close <= 0.02;
Price is Above 50 SMA and 200 SMA (full scan example):
def SMA50 = SimpleMovingAvg(close,50);
def SMA200 = SimpleMovingAvg(close,200);

def SMACondition = close > SMA50 and close > SMA200;

#defining places in which we have greater than [x] SD of volume
def volumeCondition = RelativeVolumeStDev(50).RelVol >= 3;

plot signal = SMACondition and VolumeCondition;
Mobile Alerts With Scans
In the last part of the tutorial, we'll also discuss a simple way in which you can turn a scan into alerts sent directly to your phone.
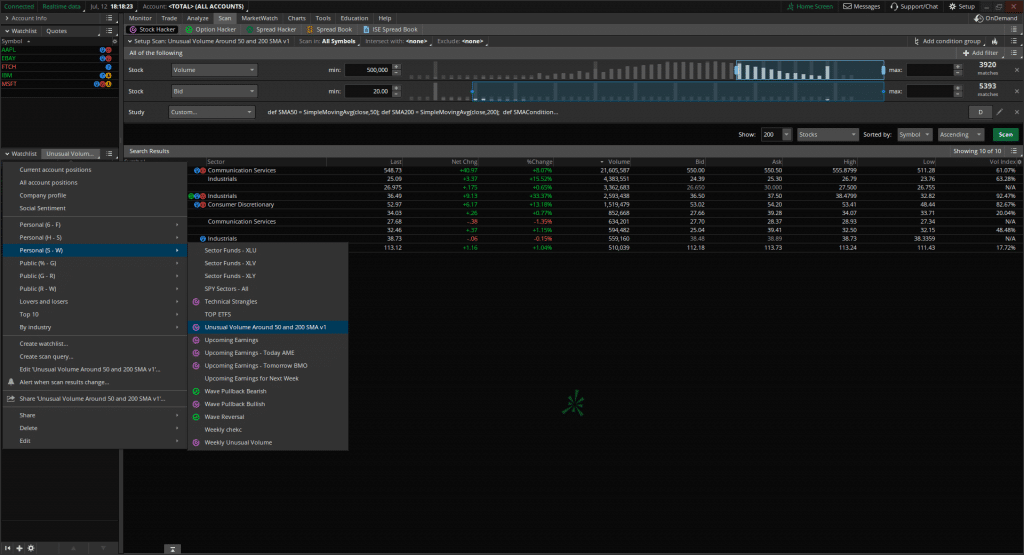
The first step is to save the scan that you've built and written as an individual scan in your platform -- we'll call this "Unusual Volume Around 50 and 200 SMA"

After saving the scan, you can then load it directly into a watch list on the left hand-side of the ThinkOrSwim platform.

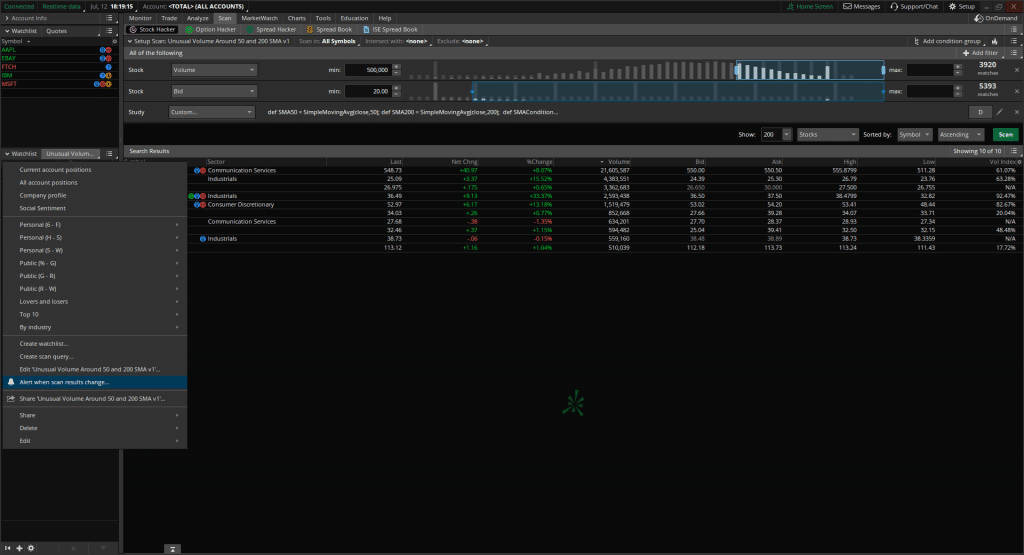
And finally, you can then turn on alerts by using the "Alert when scan results change" notification.

What Else Can I Do?
If you'd like to create 4 additional scans, join us in the premium section of this tutorial, which is free for all Volatility Box members.
The Unusual Volume Pro scanner can be accessed here.
Download
Click the button below to download all 4 of the Unusual Volume Scans for ThinkOrSwim.
