
Search Our Library
Instantly search over 400+ trading videos and tutorials
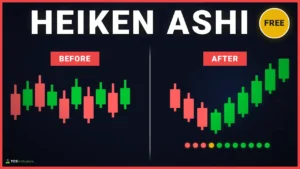
Download our Custom Heiken Ashi indicator for ThinkOrSwim. Full ThinkScript code, formula breakdown, and tutorial. Free Download!
For acceleration signals: trend-following strategies and buying pullbacks. For deceleration signals: short strategies or avoiding new longs. For accumulation signals: position building before breakouts. For outliers: contrarian strategies or skewed risk-reward plays. Combine with Opening Range Breakout tactics for precise intraday execution without overnight risk.

Learn how to create a Post-Election Backtester in ThinkOrSwim to analyze market volatility after U.S. presidential elections. Step-by-step tutorial with code, insights, and tips for optimizing your trading strategy.

Use ChatGPT to build a ThinkOrSwim volume indicator with multi-symbol tracking and volume intensity color-coding for quick, clear analysis.

A step-by-step guide on how to transform candlestick patterns into thinkScript code. This is a beginner-friendly ThinkOrSwim tutorial.

Use ChatGPT to build a ThinkOrSwim volume indicator with multi-symbol tracking and volume intensity color-coding for quick, clear analysis.
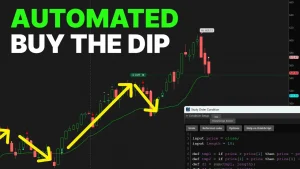
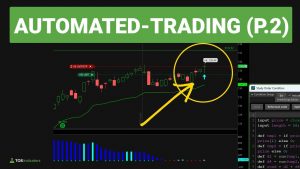
A free automated trading script for ThinkOrSwim to buy the dip on a pullback in strong trends.
Use the Average True Range to find stocks with high and low volatility, triggering high probability setups.
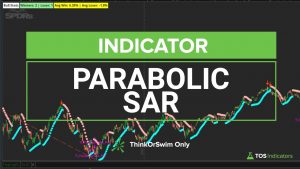
Build a better Parabolic SAR indicator, that allows you to predict reversals before they happen.
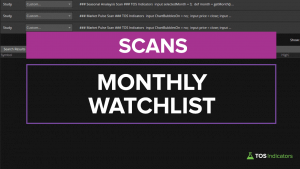
A powerful scan that finds you the best seasonality patterns and trends, every single month.
Learn how to build a powerful MACD indicator with built-in higher time frame analysis. Download for free on our website!
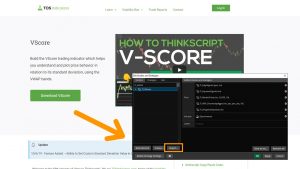
A step-by-step guide on how to import ThinkOrSwim indicators into the TOS platform.
Download this free indicator to easily analyze your favorite markets, and compare red vs. green candles to find patterns and trends.
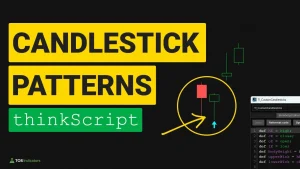
Easily transform your favorite candlestick patterns into a ThinkOrSwim indicator using these simple, but POWERFUL techniques!
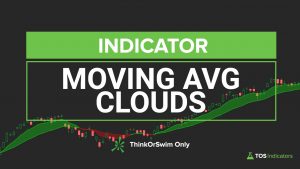
A simple, yet powerful Moving Average Clouds indicator, to easily spot trends and reversals. Free download!
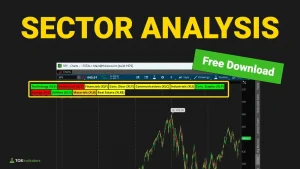
Easily track sector performance and market internals with our free Utility Labels indicator!
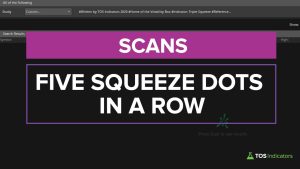
Scan for five TTM Squeeze dots in a row, with stacked moving averages. Download the shared links for free, and learn how to build your own scans.
Learn how to configure a cusom toolbar inside of ThinkOrSwim, to instantly 10x your productivity.