
day trading simplified
Stock Volatility Box
The Stock Volatility Box is a powerful web-based platform, which uses proprietary statistical models to predict where 10,000+ stocks and ETFs are likely to reverse.

How it Works
Institutional Data for Retail Investors
A full-fledged platform to trade volatility using our proprietary volatility models, data, and technology.
Step 1:
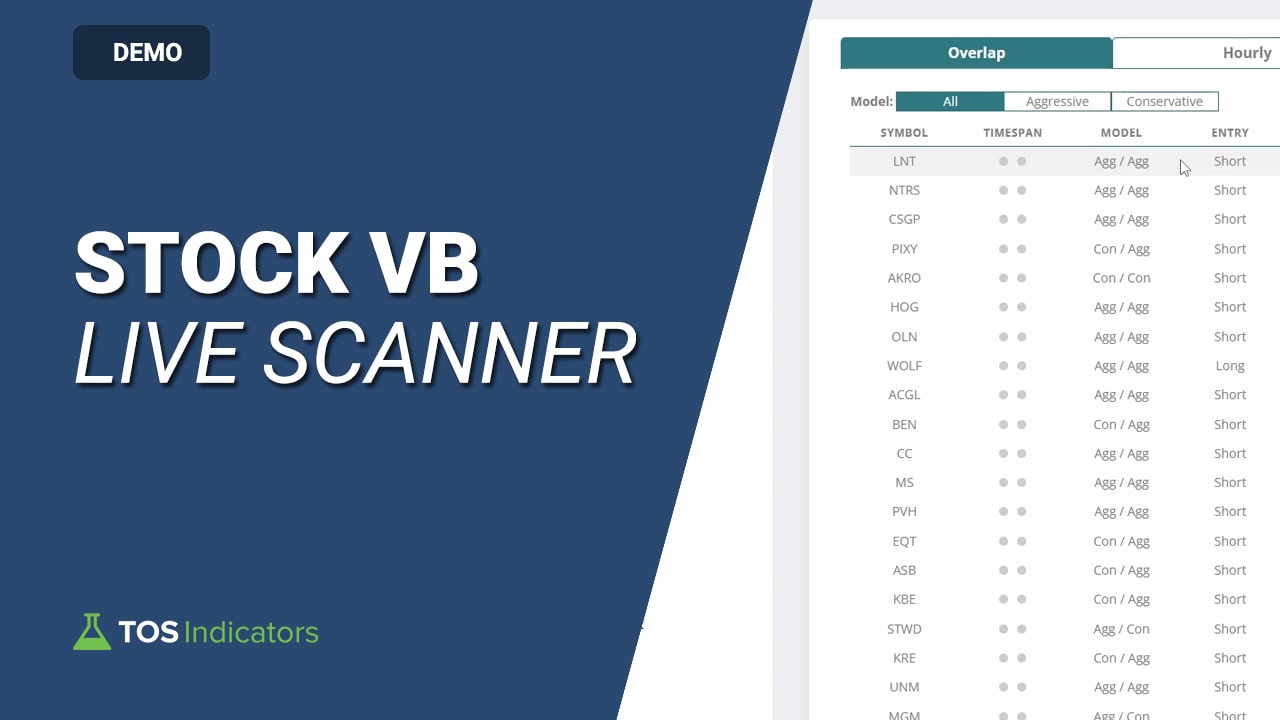
Choose From Our Live Scanner
Our Live Scanner refreshes every 15 seconds with new setups, so that you always know where trade opportunities are setting up.
Here's what the scanner looks for:
Stocks and ETFs at least $10+ with an average volume greater than 1 million
Any symbols in our stock universe breaching our volatility reversal zones
Stocks and ETFs where we have a volatility edge
Step 2:
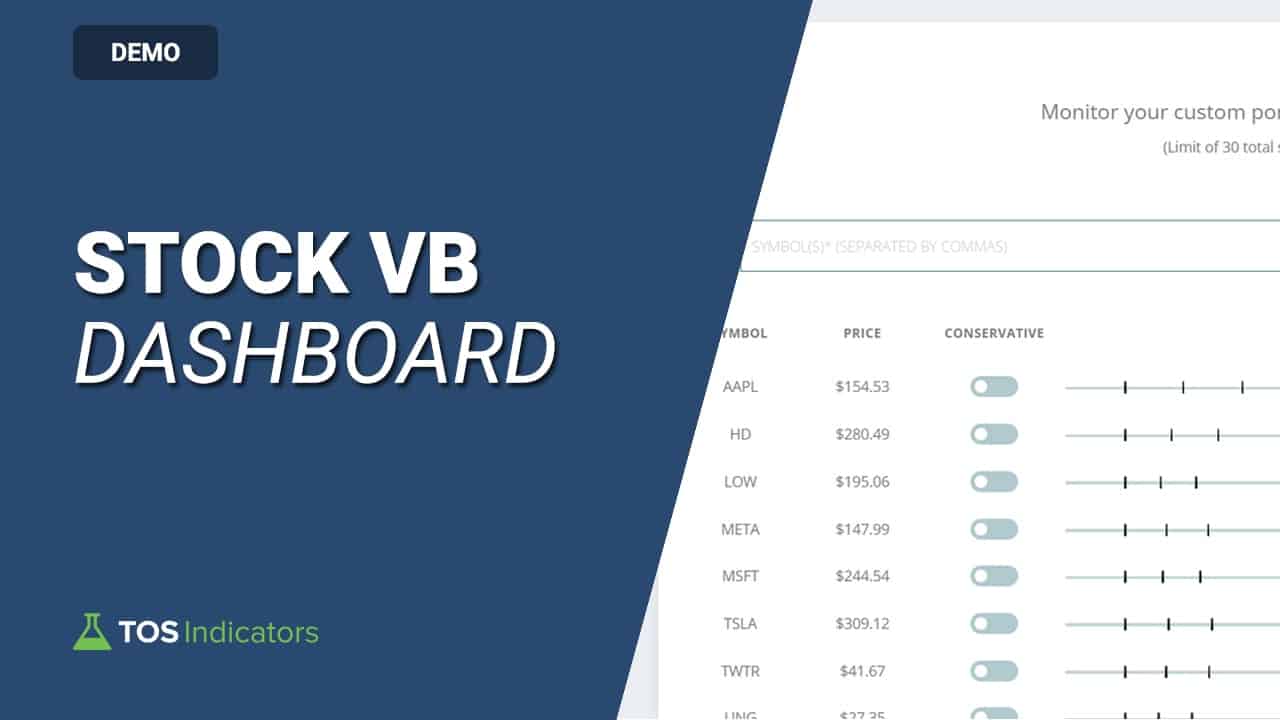
Add to Dashboard
Pick your favorite setups, and add them to your Dashboard for instant and precise volatility price reversal zones.
Generate unlimited ThinkOrSwim indicator file with volatility levels
Fast and easy to use with 1-click to "Add to Dashboard"
Create alerts for your favorite stocks and ETFs
Step 3:
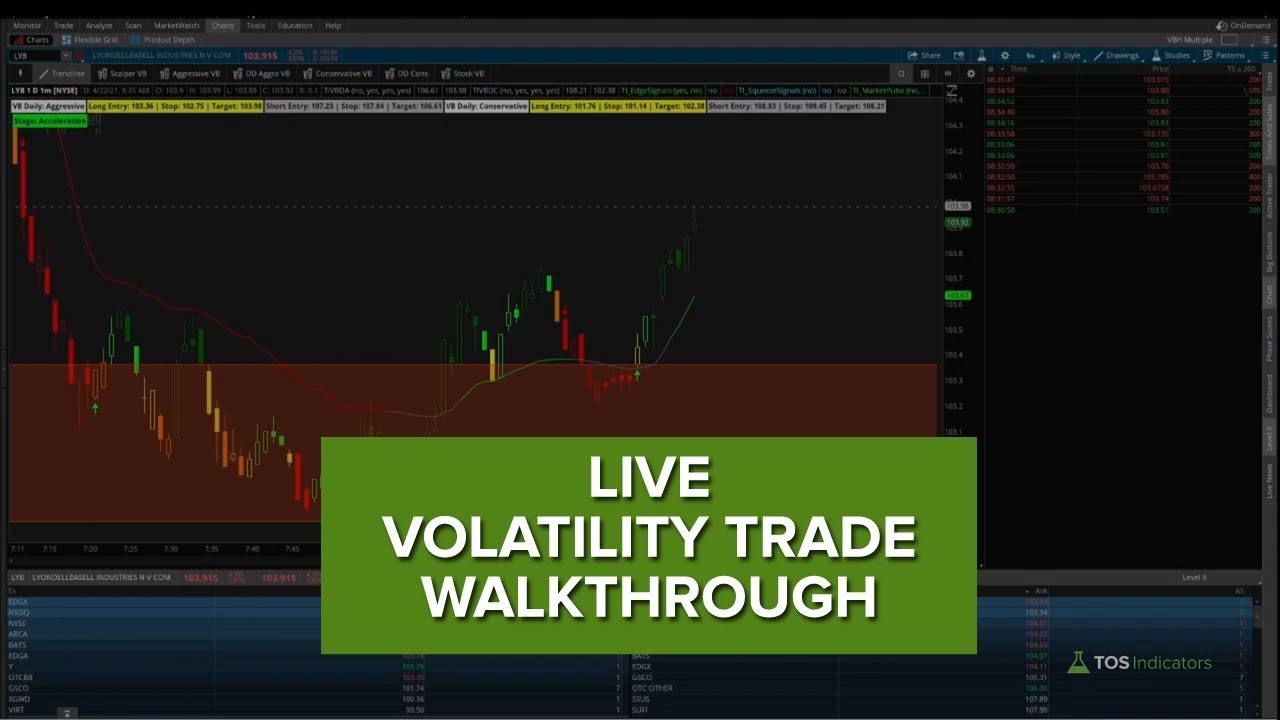
Trade With an Edge
Leverage our proprietary volatility models and platform to profit from volatility mispricing opportunities, in a consistent, process-driven manner.
Our volatility models are updated weekly, every Sunday
Powerful tool to measure and trade volatility, using stock or options
Integrate with your own setups, or use our Volatility Box setups
3 High Probability Trade Setups
Discover more about our setups below, complete with video trade walkthroughs.
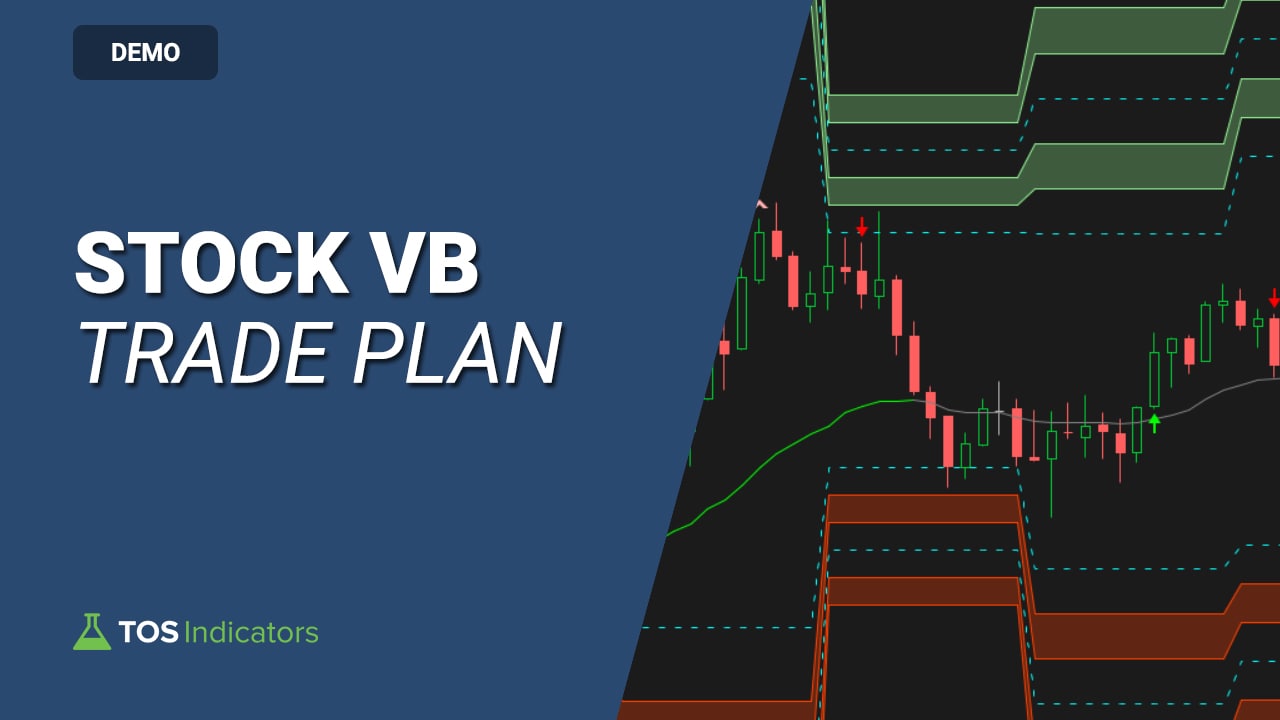
 Volatility Box Fades
Our bread and butter setup, which has 2 simple rules:
- Price must breach our Volatility Box edge, signaling we're in a key volatility reversal area
- Confirm the reversal with a 1-min Edge Signal confirmation of overbought/oversold zones.
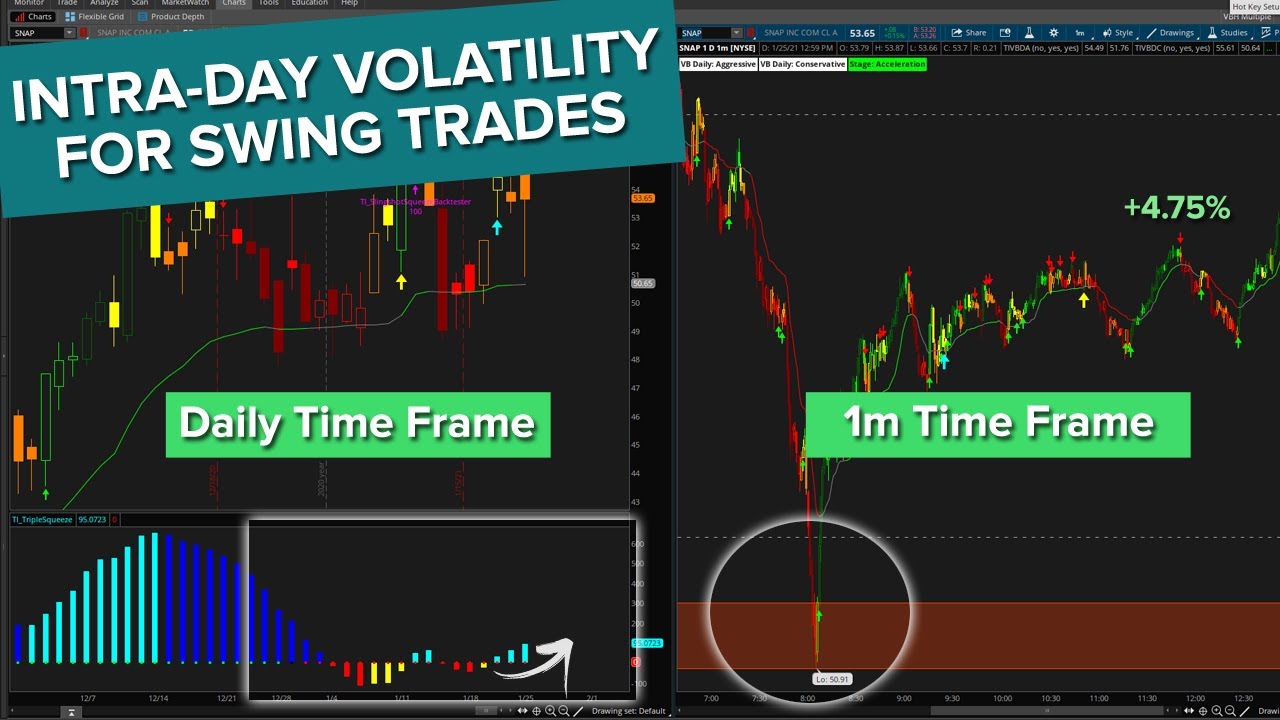
Swing Trade Trends
Take advantage of intraday volatility for better swing trade entries and exits, effortlessly.
- Run your favorite ThinkOrSwim scans (we like the Slingshot Squeeze scans)
- Backtest to find the best setups
- Pinpoint your entry with the Volatility Box models (hourly and daily)
Most Recent Stock Trade Reports
Get a feel for past performance, with 300+ trade videos, going back to mid-2019.

Curevac: Why This Stock Can Earn You a 40% Return
Curevac has weekly bullish momentum signals, after building a nice base. Learn how to use covered calls to trade this idea.

Time to Buy the Dip in NVDA?
Take advantage of the intraday volatility for this buy the dip setup in NVDA.

GOOGL Earnings Patterns
Here are two patterns that you can use to trade GOOGL stock into earnings, like a professional.

Why Lamb Weston Stock is a Swing Trade to Watch Right Now
Lamb Weston is triggering a buy the dip setup, and in this video I’ll share the exact zones to pay attention to.

Archer Aviation – The Company That Wants to Make Flying Cars
Archer Aviation is a stock that stands out for 3 key reasons. I’ll share those reasons in this video, along with an entry zone.

5 Reasons Why I Like This High Dividend REIT
This high dividend REIT has a 21% dividend yield, and looks attractive at its current valuation. Here are 5 key reasons why I started a position.

Gap Fill in NTR Stock and Seasonal Patterns
Take advantage of the gap fill setup in this agricultural stock. We’ll look at the daily, weekly, and 5-min time frames.

Take Advantage of this MACD Divergence in JPM
In this video, I’ll show you how to use the Smarter MACD scans to find powerful swing trading setups, in a few minutes.

Find ETFs on Sale With This Scanner
Here’s an easy way to find swing trade setups in ETFs and their top holdings.

Take Advantage of FOMC Volatility in SPY
Here is a simple way to take advantage of FOMC related volatility in the S&P 500, using SPY.

Buy the Dip in SPY at $500?
Is the S&P 500 a buy at these key levels? Here’s a simple way to use volatility and price channels for a comprehensive look.

Take Advantage of TSLA’s Post-Earnings Volatility
Here’s a simple way to take advantage of these intraday levels in TSLA, as post-earnings volatility continues to increase.

Key Levels in AMD Stock – Buy the Dip Setup
Here are key levels I am waiting for inside of AMD, before looking at a long entry to buy the dip in the bull trend.

4 Monthly Squeezes That Stand Out
Keep an eye on these 4 MONTHLY TTM Squeezes that are building up. Positive backtests, and an entry coming up!

Is TSLA Stock a Buy Here?
TSLA stock fell to $180 post-earnings. Is this a good buy level? Find out the exact levels to monitor in TSLA stock after earnings.

Compare Stock and Futures Market Volatility
A step-by-step guide comparing the volatility between major stocks and futures markets.


3 Crypto Stocks With Increasing Volatility
The three crypto stocks with RISING volatility, and opportunity for traders.

How Google Gemini Affected the Stock Price
Day trade the volatility in Google stock after the release of their new AI model, Google Gemini.

End of Year Volatility Mismatch Opportunities
While the index markets are doing one thing, these stocks are likely to be doing another, giving you a concrete volatility edge.
better entries and exits
Smarter Portfolio Management
Monitor your existing portfolio, along with your wish list of stocks, using our Dashboard with precise entry, exit and stop levels.
- Use 0 DTE Options To Skew Risk to Reward
- Daily "fantasy" prices for your watchlist of stocks
- Volatility-based exit zones to stop leaving money on the table
Volatility Box Membership Includes:
We do our best to make the Volatility Box a no-brainer decision. It is an all-inclusive membership, that includes all of our premium indicators, courses, and ThinkOrSwim tools.