
Turn ThinkOrSwim Into Your
Trading Powerhouse
Institutional-grade volatility models, custom indicators, and systematic trading education. Built exclusively for ThinkOrSwim by traders, for traders.
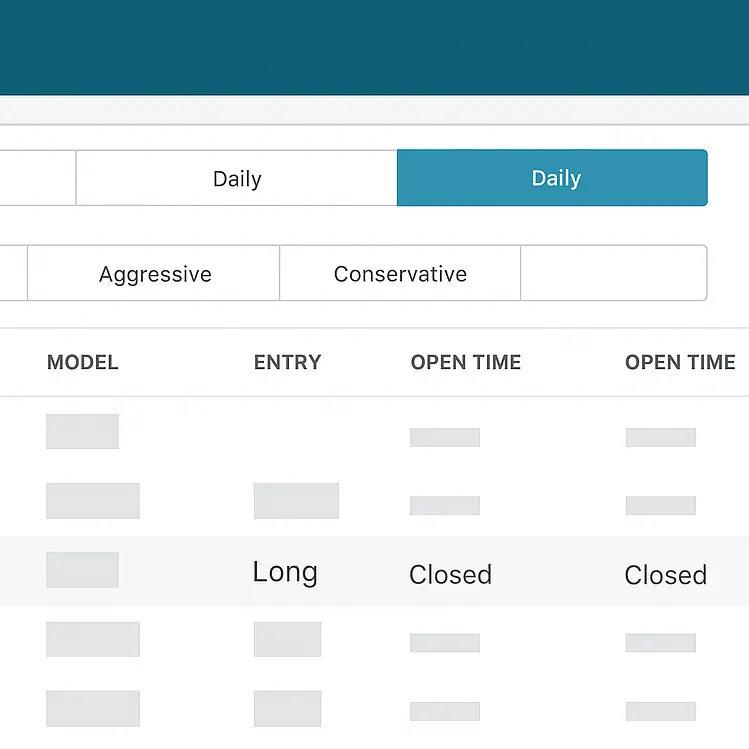
Market Pulse Dashboard
The Market Pulse Dashboard lets you quickly assess...
Backtest Weekly Fisher Transformer Signals in 10 Minutes
In this tutorial, we will build a "back...
TTM Squeeze Dashboard
Build a beautiful TTM Squeeze Dashboard in 25...
Simple Breakout Tool Scans
Scan for bullish and bearish Simple Breakout Tool...
TTM Squeeze Scanner
Scan for five TTM Squeeze dots in a...
Reversion to 50 Day SMA
Learn how to build a "reversion to the...
Increasing Volume
In today's thinkScript tutorial, I'll show you how...
Covered Call Calculator
Build a simple, yet powerful Covered Call Calculator...
Relative Performance Dashboard
Identify specific symbols from a watchlist of 2000+...
Dividend Discount Model
Find undervalued stocks and ETFs using the Dividend...
Stacked Moving Averages
Scan for bullish and bearish stacked moving averages...
How to Scan for Stocks That Hit YTD High on Dec. 31?
Learn how to build a custom scan to...
Hourly Sizzle Index
Find which stocks are on the move every...
Unusual Volume Pro Scans
4 additional scans to find unusual volume overlapping...
MTF Market Pulse
In this members-only thinkScript tutorial, I'll show you...
Build an Election Backtester in 10 Minutes
Learn how to create a Post-Election Backtester in...
Create a TTM Squeeze Watchlist in Seconds
Download these FREE scans to create a TTM...
Aggregation Periods - How to Plot Larger Time Frame Indicators on Smaller Time Frames
A complete beginner's guide to the Aggregation Period...
Opening Range Breakout
Backtest the opening range breakout strategy on any...
How to Create Text Alerts for Extreme $TICK Readings in ThinkOrSwim
I'll walk through how you can create an...
High Short Interest Near 52 Week Highs (thinkScript)
Build a simple scan in which to find...
Trend Squeeze
Use ChatGPT to build a ThinkOrSwim volume indicator...
V-Score Scans
Scan for VScore pullbacks, including our bullish and...
Cumulative TICK
Free Cumulative TICK indicator download for ThinkOrSwim. Master...
TTM Squeeze Histogram Backtester
Backtest the TTM Squeeze Histogram on any market,...
Santa Claus Rally Backtester
Backtest how often Santa Claus Rally occurs in...
Moving Average Crossover Backtester
Test which moving average crossover is best on...
Momentum Cross Indicator
I'll share a simple momentum signal that you...
SPY Meltdown Backtester
Backtest what tends to happen in after a...
Unusual Volume Dashboard
Easily identify where we have greater-than-usual volume, using...
TTM_Squeeze - Backtest Like a Pro
Build a light weight TTM Squeeze Backtester that...
Pre-Earnings Analysis
In this tutorial, we're going to build a...
Keltner Channel Wedges
In this beginner thinkScript tutorial, we'll build an...
Moving Average Pullback Backtester
Test which moving average pullbacks work best on...
Utility Labels Indicator - QUICKLY Track Sector Performance and Internals
Easily track sector performance and market internals with...
Unusual Volume
Build 4 scans to easily find stocks with...
Build Your Own Automated Text Message Alert System in ThinkOrSwim
Learn how to create an automated text message...
How to Fix Bugs in thinkScript Code
I'll share the process that I like to...
Everything You Need.
One Subscription.
Get complete access to Stock Volatility Box, Futures Volatility Box, ORB Setups, every course, and all premium indicators. No upsells, no limits.
Your Bundle Includes:
- Stock Volatility Box - 595 stocks with live scanner
- Futures Volatility Box - 10 major futures markets
- ORB Setups - Opening Range Breakout platform
- The Squeeze Course - 19 modules, 4.5+ hours
- All Premium Courses - Fibonacci, Earnings, V-Reversals
- 20+ Premium Indicators - Exclusive tools & scans
- Weekly Model Updates - Fresh data every Sunday
Cancel anytime. No long-term contracts. Your rate is locked for life.
Three Platforms. Unlimited Edge.
Each platform uses proprietary volatility models to identify high-probability setups with precise entry, stop, and target levels.
 Premium
Stock Volatility Box
595 stocks and ETFs scanned every 30 seconds. 5 unique volatility models identify precise support and resistance zones with conviction scores.
Explore Stock VB → Premium
Futures Volatility Box
Trade ES, NQ, CL, GC, and 6 more major futures with session-aware volatility models. Daily email guidance and trading assistant included.
Explore Futures VB → Premium
ORB Setups
Opening Range Breakout strategies with custom backtesting. Identify the highest probability ORB setups across multiple timeframes.
Explore ORB Setups →Also Included in Your Bundle
Complete Course Library
Squeeze Course (19 modules), Fibonacci Trading, Earnings strategies, and V-Shaped Reversals.
Premium Indicators
20+ exclusive ThinkOrSwim indicators including advanced scans, dashboards, and automation scripts.
Weekly Data Updates
34,000+ volatility data points analyzed and updated every Sunday with fresh market levels.
Start With Free Tools
Download custom ThinkOrSwim indicators, backtesterers, and complete courses right now. No email required, no strings attached.
Learn to Build Your Own Edge
Complete courses teaching systematic trading strategies. Not just signals - learn how to create, backtest, and optimize your own setups.

The Squeeze Course
Master TTM Squeeze from basics to automation. Build 6 indicators, 4 backtesterers, and 3+ scans.

Fibonacci Trading
Use Fibonacci retracements and extensions to identify high-probability entries.

Earnings Trading
Trade earnings announcements with defined risk using options strategies.

V-Shaped Reversals
Identify and trade sharp reversal patterns with systematic entry criteria.
Built for Serious Traders
Built Exclusively for ThinkOrSwim
Every indicator, scan, and strategy is designed specifically for TOS. No workarounds, no compatibility issues. Just paste and trade.
Backtest Before You Trade
Every strategy includes backtesting with 20+ years of historical data. Know your edge before risking real capital.
Learn to Build Your Own Edge
We teach you how to create and optimize strategies, not just follow signals. Develop true trading independence.
Join 40,000+ Traders
A community of independent traders sharing setups, insights, and best practices. You're not trading alone.
Trusted by 40,000+ Traders
Join thousands of traders who have transformed their ThinkOrSwim experience with TOS Indicators.
"The Volatility Box has completely changed how I trade. The levels are incredibly accurate and I finally feel confident in my entries."
"Best investment I've made in my trading education. The Squeeze Course alone was worth 10x the price. Incredible depth."
"Finally, indicators that actually work on TOS without constant issues. The backtesting capabilities are game-changing."
"The futures VB levels are scary accurate. I've been trading ES for years and this tool has significantly improved my win rate."
"Started with the free indicators and was impressed. Upgraded to the Bundle and it's been the best decision for my trading."
"I've tried dozens of indicator services. TOS Indicators is the only one that actually teaches you WHY things work, not just gives signals."
"The weekly data updates are incredibly valuable. Knowing my levels are fresh each week gives me so much confidence."
"As someone who codes their own strategies, the education here is unmatched. I've learned so much about ThinkScript."
"The scanner alone saves me hours every day. Finding high-conviction setups is now effortless."
"Been a member for 2 years. The tools keep getting better and better. Best community in trading."
Frequently Asked Questions
Everything you need to know about TOS Indicators and the Bundle membership.
Ready to Trade With an Edge?
Join 40,000+ traders using institutional-grade tools built for ThinkOrSwim.