
 Fair Value Gap
 False Breakout Scanner
 Heiken Ashi Trend
 Stock Volatility Box
 Futures Volatility Box
 ORB Setups
 Squeeze Setups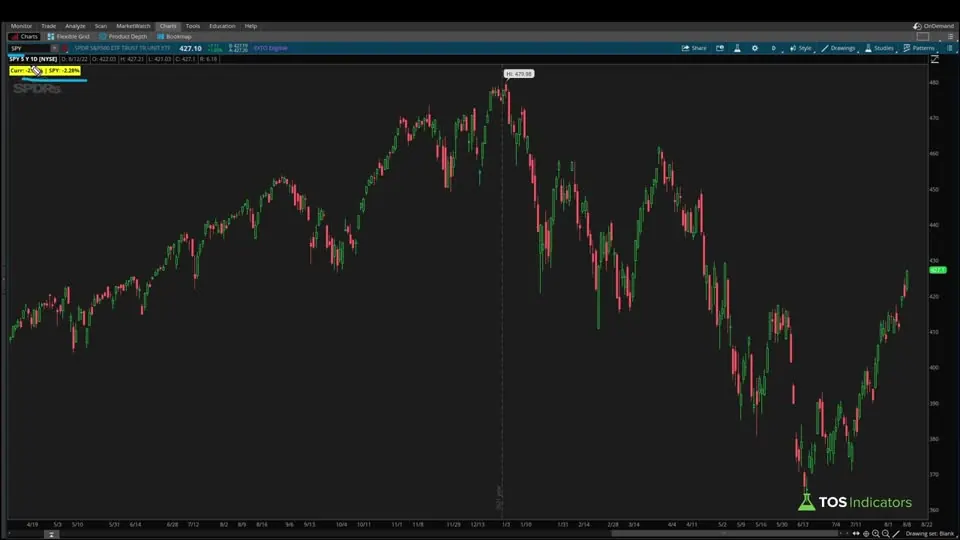
On this page
Overview
In this tutorial I build a relative performance indicator for ThinkOrSwim. It measures the percent return of the symbol on your chart and of one benchmark, SPY by default, over the same stretch: the last 30 bars or every bar since a date you choose. A label then tells you whether the chart is ahead of the benchmark, in one word or with both percentages.
I write the code from scratch in the thinkScript editor and test each piece against the chart. It's for traders who want to know whether a stock is beating the S&P 500, QQQ or its own sector ETF before they spend time on the chart.
Key Takeaways
- The relative performance indicator compares the percent return of the symbol on your chart with the return of one benchmark symbol over the same period. The default benchmark is SPY.
- The benchmarkType input sets the period: the last 30 bars (bars, the default) or every bar since a date you enter (date, default 20220217).
- Both returns use one formula: the current close minus the starting close, divided by the starting close.
- A green Outperform label means the chart's symbol returned more than the benchmark. A yellow Underperform label means it returned the same or less. A second label, on by default, shows both percentages.
- In the video, Tesla returned 33.66% over 30 bars against 17.88% for QQQ, and Apple returned 1.91% from February 17, 2022 while SPY returned -2.28%.
What Is Relative Performance?
Relative performance compares how much one market returned with how much a benchmark returned over the same period. Set next to the return of SPY, QQQ or its sector ETF, a stock's return shows whether it led or lagged.
The video has a clear case. From February 17, 2022 to the day I recorded, SPY was down 2.28% and Apple was up 1.91%, so Apple outperformed the S&P 500 by about 4 percentage points.
Relative performance is often called relative strength, which is a different measure from the Relative Strength Index (RSI). RSI compares one symbol's own average gains with its average losses and reads from 0 to 100. Relative performance always needs two symbols: the one you're studying and the one you measure it against.
The benchmark you pick decides the question you're asking. In the video I use the indicator three ways: a stock against an index ETF, a stock against its parent sector ETF, and any two markets against each other. For comparisons at the sector level, see our research article on how to spot sector rotations.
What the Relative Performance Indicator Shows
The relative performance indicator prints two labels on the chart and draws no plot. Both labels turn green when the chart's symbol returned more than the benchmark over the period, and yellow when it didn't.
| Label | When it shows | What it says |
|---|---|---|
| Simple label | Always | Outperform in green, or Underperform in yellow |
| Detailed label | When detailedLabels is yes, the default | "Curr:" and the chart's return, then the benchmark symbol and its return, both as percentages |
The detailed label reads the benchmark's name from the input, so it always shows the symbol you chose: SPY by default, XLK if you switch to the tech sector. If your chart already carries a lot of labels, set detailedLabels to no and keep the one-word version with its color.
Relative Performance Indicator Settings
The relative performance indicator has 5 inputs, and you can change all of them from the study's settings without opening the code.
| Input | Default | What it does |
|---|---|---|
| benchmarkType | bars | bars measures from the close lookbackPeriod bars ago. date measures from the close on the date input. |
| lookbackPeriod | 30 | How many bars back the bars mode starts. In the video I mention raising it to 90. |
| date | 20220217 | The start date for date mode, written YYYYMMDD. The default is February 17, 2022. |
| benchmark | SPY | The symbol to compare against: QQQ, a sector ETF such as XLK, another stock, or a futures or forex symbol. |
| detailedLabels | yes | Shows the label with both percentages. Set it to no to keep only the one-word label. |
The bars setting counts bars of whatever timeframe the chart uses. On a daily chart, 30 bars is 30 trading days. On a 5-minute chart, the same 30 bars cover 150 minutes.
Bars or Date: Choosing the Period
The relative performance indicator measures over a rolling window in bars mode and from a fixed start in date mode. Bars mode moves forward with each new bar, so it always covers the most recent 30 bars. Date mode keeps the same starting close until you change the date.
In the video, switching Apple's comparison from February 17, 2022 to 30 bars changed both numbers at once, because the window moved to more recent price activity. Use bars for a running read on what has led lately, and a date when you want performance from one particular day.
How to Add the Relative Performance Indicator to ThinkOrSwim
The relative performance indicator download is a zip file with one study, TI_RelativePerformanceSTUDY.ts. You can import that file, or build the study yourself the way I do in the video:
- In ThinkOrSwim, click the Studies icon on a chart, then Create to open a new study.
- Name it. I called mine TI relative performance.
- Delete the code ThinkOrSwim puts in a new study and paste the code from the Code tab on this page.
- Click OK, then Apply. The labels show on the chart.
- Open the study's settings to pick the benchmark, the bars or date mode, and the lookback.
To import the .ts file instead, follow our guide on how to import a study into ThinkOrSwim. You'll find more free studies on our indicators page.
How the Relative Performance Code Works
The relative performance code is 20 lines of thinkScript, not counting the header comments, in four parts: inputs, the starting closes, the two returns and the labels. I checked the starting closes and the benchmark's return with a label before moving on, and those checks are worth repeating if you change anything.
1. The Inputs
This step’s code is free with an account. Create one or sign in.
benchmarkType uses curly brackets to give a dropdown with two choices, and default marks bars as the starting choice. The other inputs hold the lookback, the date and the benchmark symbol, which goes in quotes because it's text.
2. The Starting Closes
The starting closes are the prices both returns are measured from. The code declares them with no value and fills them in inside a switch that reads benchmarkType:
This step’s code is free with an account. Create one or sign in.
In bars mode, close(symbol=benchmark)[lookbackPeriod] is the benchmark's close 30 bars ago, and close[lookbackPeriod] is the chart's own close 30 bars ago. The symbol parameter is what lets one study read a second market's prices.
In date mode, getYYYYMMDD() returns each bar's date as a number. On the bar whose date matches the input, the code records that bar's close. On every other bar it carries the saved value forward with [1], so each later bar knows the close from that date.
benchmarkClose, the benchmark's latest close, sits above the switch because it's the same in both modes.
3. Checking the Closes With a Test Label
Before writing the returns, I put the chart's starting close in a temporary yellow label to make sure the switch worked. This line is for testing only and isn't in the final code:
This step’s code is free with an account. Create one or sign in.
On the Tesla chart in bars mode, the label read 673.42. Counting back 30 bars, that candle closed at 673.42. In date mode the label changed to 876.35, which matched the close on February 17, 2022.
4. The Two Returns
This step’s code is free with an account. Create one or sign in.
Both lines use the same percent change formula: the latest close minus the starting close, divided by the starting close. The result is a decimal, so 0.05 means 5%. Because both returns are percentages over the same bars, a low-priced stock and a high-priced benchmark compare directly.
I checked the benchmark side on an SPY chart. From February 17, 2022, the label showed -2.28%, and checking against the candles put it at about -2.25% to -2.28%. Small gaps like that come from rounding and reading the close off the chart.
In bars mode this is the same percent change over a set number of bars that ThinkOrSwim's ROC study measures, run on two symbols. Our Rate of Change indicator tutorial covers that measure for a single symbol.
5. The Labels
This step’s code is free with an account. Create one or sign in.
The first label prints Outperform or Underperform.
The second, shown when detailedLabels is yes, builds its text from pieces: "Curr: ", the chart's return through AsPercent, a divider, the benchmark symbol from the input, and the benchmark's return.
Putting the benchmark input inside the text keeps the label correct when you switch from SPY to XLK. Both labels run the same color test. Our AddLabel tutorial covers the function's text and color arguments.
Relative Performance Examples From the Video
The relative performance examples in the video cover an index, a sector and two unrelated markets. The table lists the ones with a stated period. They're readings from the days I recorded, so the same comparison on your chart will differ.
| Chart | Benchmark | Period | What the labels showed |
|---|---|---|---|
| Tesla | QQQ | Last 30 bars | Outperform: Tesla 33.66%, QQQ 17.88% |
| Procter & Gamble | S&P 500 | The same 30 bars | Underperform |
| Apple | SPY | Since February 17, 2022 | Green detailed label: Apple 1.91%, SPY -2.28% |
| Apple | XLK | Last 30 bars | XLK returned 18.48% |
| Microsoft | XLK | Last 30 bars | Underperform |
| Nvidia | XLK | Last 30 bars | Outperform |
| Visa | XLK | Last 30 bars | Underperform |
| Mastercard | XLK | Last 30 bars | Underperform |
The simple label is quickest when you cycle through a sector's holdings. With XLK as the benchmark, I flipped from Microsoft to Nvidia, Visa and Mastercard and read one word on each chart. In my opening examples, Apple outperformed XLK and Microsoft underperformed it.
Two more comparisons show that the benchmark doesn't have to be an index. With Lowe's on the chart and Home Depot as the benchmark, Lowe's was ahead by a small margin. With a gold ETF measured against a Bitcoin ETF, gold underperformed by a wide margin over the same 30-bar lookback.
How I Use the Relative Performance Indicator
The relative performance indicator sorts stocks into leaders and laggards against a benchmark you choose. I use it to find outperformers and underperformers, and then use that read to shape a trade on the chart. Checking a stock against its sector ETF shows whether it's ahead of or behind its own sector.
The label is a filter. It says nothing about where to enter, and a stock that led for 30 bars can turn on the next one. Decide where your stop goes before you trade a name it flags, and size the position so a stop-out costs a small, fixed share of your account.
For a trend read on the same chart, our free Market Pulse indicator labels the market stage. If you track sector ETFs, our sector performance tutorial is a related read.
Comparing a Whole List: the Relative Performance Dashboard
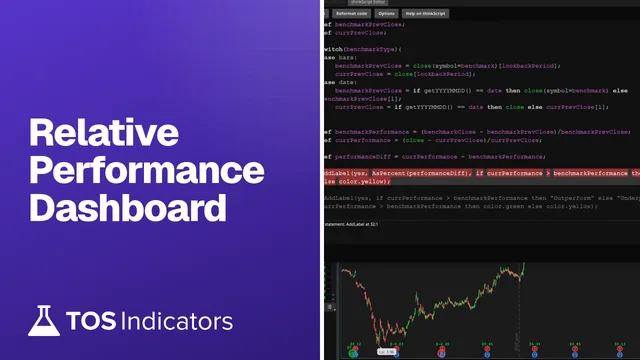
The relative performance indicator compares one chart with one benchmark at a time. In the follow-up video I turn the same code into a custom column for a watchlist or the scan tab, the Relative Performance Dashboard, which shows the gap between each stock's return and the benchmark's for a whole list and lets you sort by it.
In this video I describe it as a way to use ThinkOrSwim as a database: a list of up to 2,000 stocks instead of 1, with your own studies layered on to narrow it down. Our Market Pulse Dashboard is built the same way, as custom columns for trend stages, and the dashboards page lists the rest.
Common Problems and Fixes
- The label says Underperform on an SPY chart. When the chart and the benchmark are the same symbol, both returns match. The label needs the chart's return to be greater, so a tie reads Underperform in yellow. Change the chart or the benchmark.
- Date mode shows no usable numbers. The code records a close only on the bar whose date equals the input exactly. Use a trading day written as YYYYMMDD, such as 20220217, on a chart that reaches back that far. A weekend, a holiday or a date older than the chart's first bar leaves it nothing to record.
- The numbers change with the timeframe. Bars mode counts the chart's own bars, so 30 bars on a daily chart and 30 bars on a 5-minute chart are different periods.
- Too many labels on the chart. Set detailedLabels to no to keep only the one-word label.
Relative performance on real charts
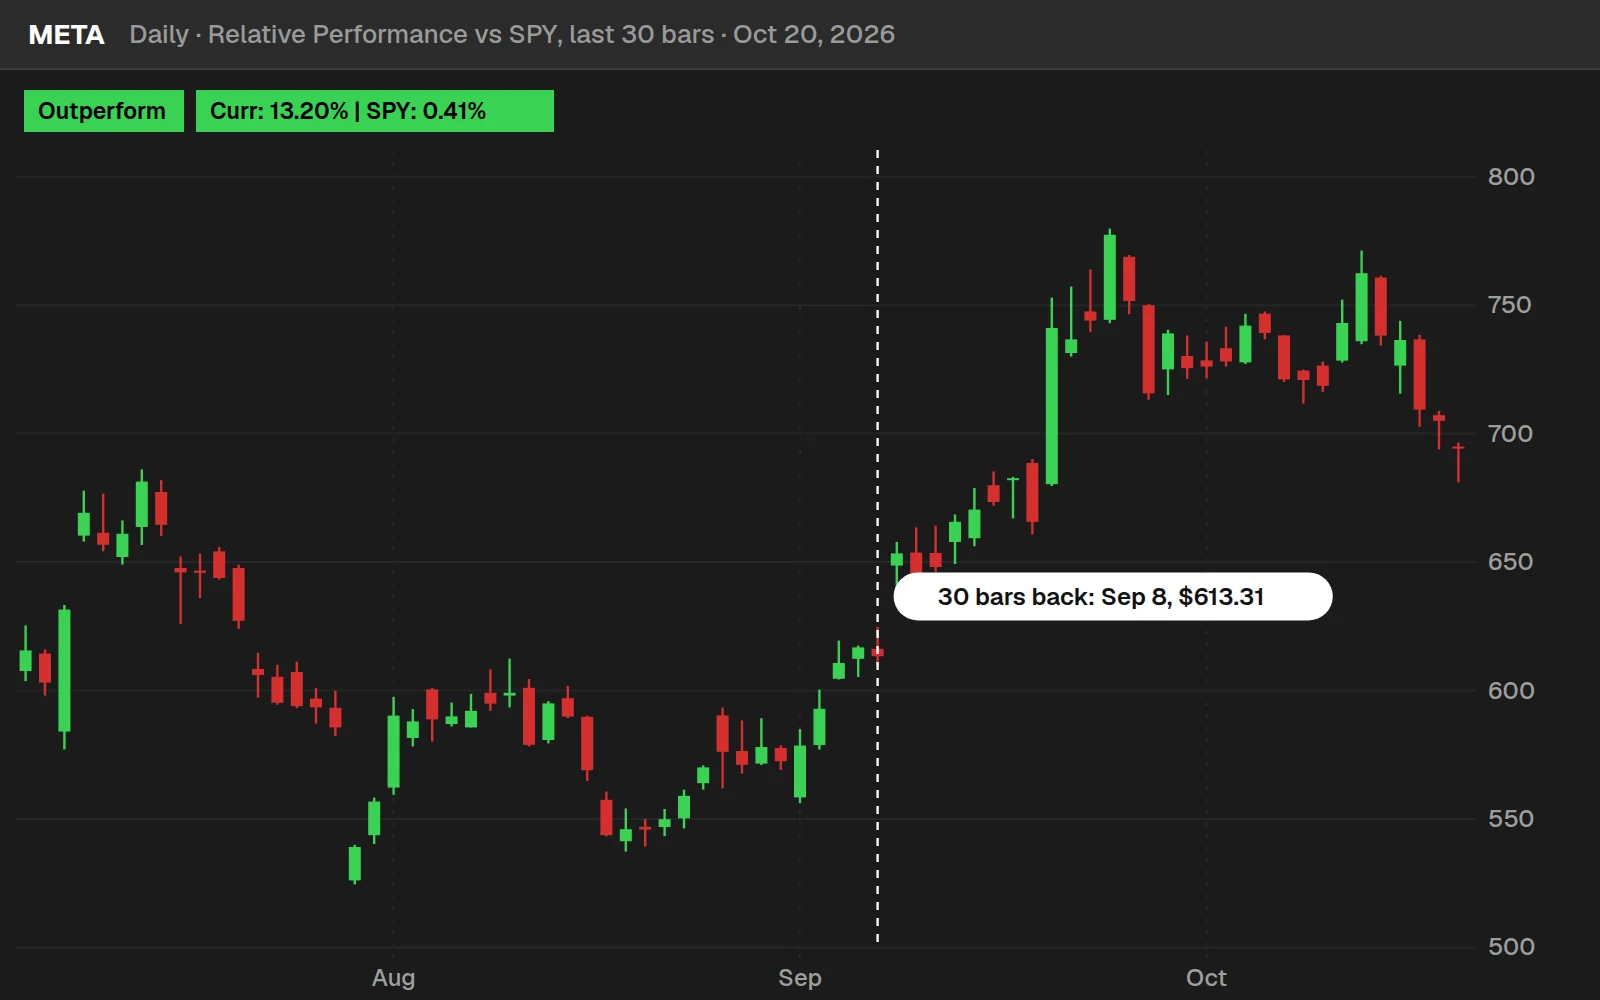
Drawn from real daily bars with the code on this page, through Oct 20, 2026. With the default settings the indicator compares the percent change of the chart's symbol over the last 30 bars with SPY's over the same 30 bars, and the label says Outperform or Underperform. The dashed line on each chart is where the 30 bars start.
META: the strongest of 43 names
ORCL: the weakest
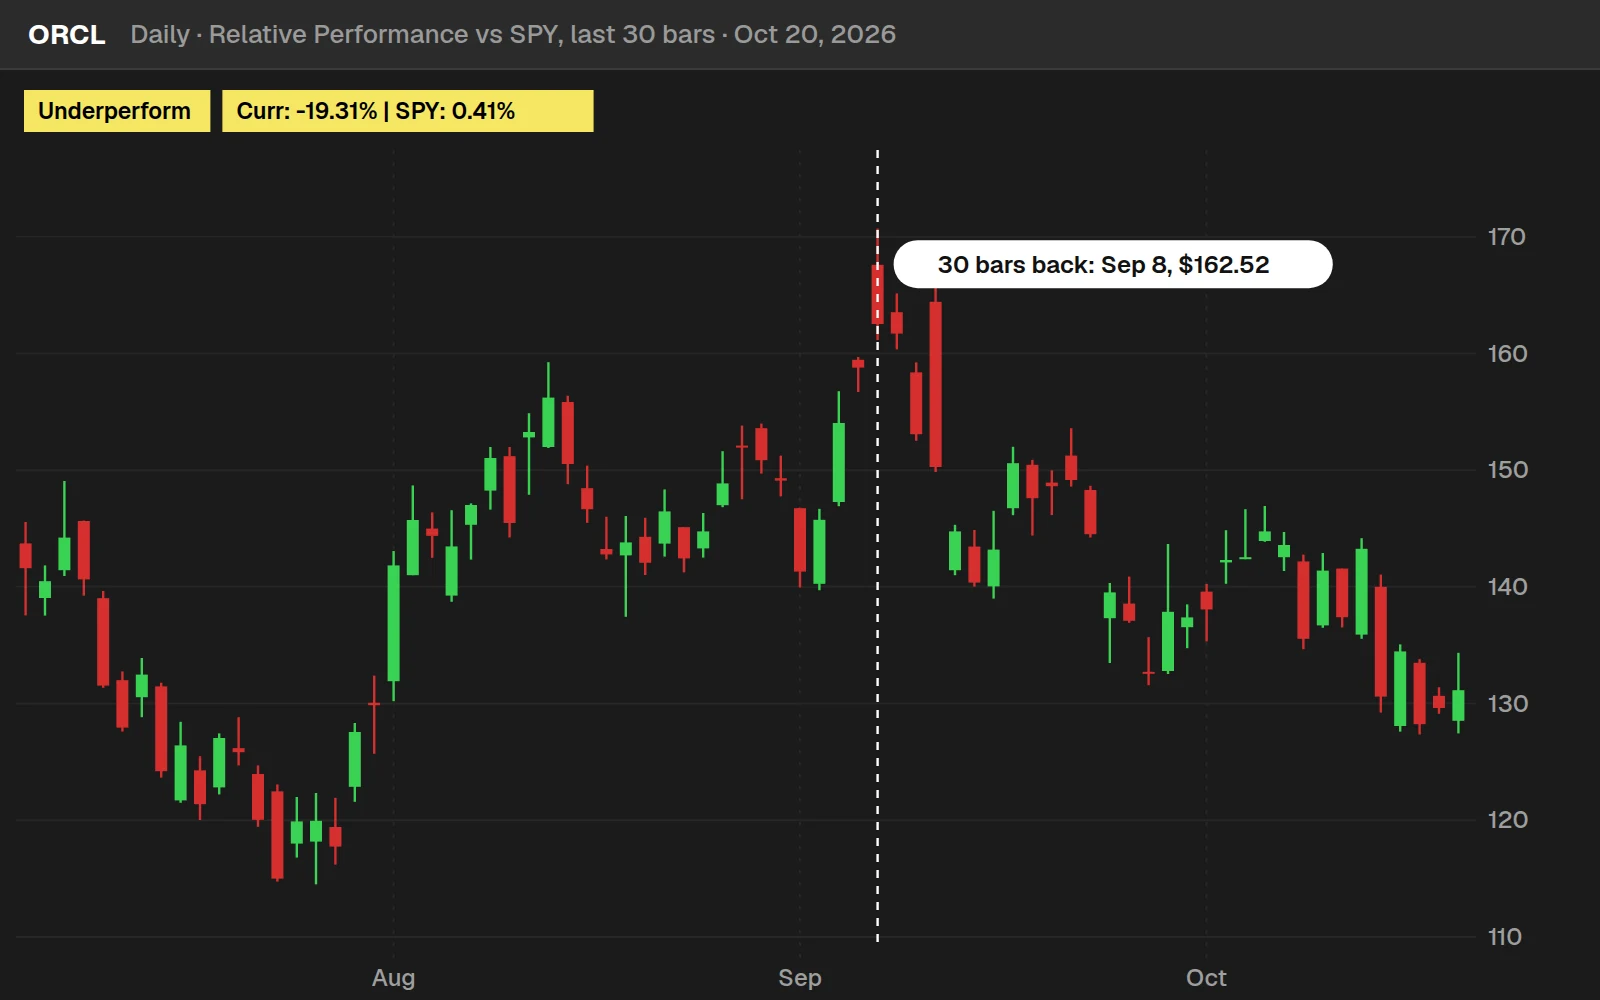
Over the 30 bars to Oct 20, 2026, SPY moved +0.41%. Of the other 43 well-known stocks and ETFs, 20 outperformed it. META led at +13.20% and ORCL trailed at -19.31%.
The sector ETFs on Oct 20
| Sector ETF | Last 30 bars | Label |
|---|---|---|
| XLV | +7.57% | Outperform |
| XLE | +4.94% | Outperform |
| XLP | +4.44% | Outperform |
| XLY | +1.30% | Outperform |
| XLK | -1.29% | Underperform |
| XLB | -1.39% | Underperform |
| XLF | -2.76% | Underperform |
| XLRE | -3.45% | Underperform |
| XLU | -3.60% | Underperform |
| XLI | -4.37% | Underperform |
SPY over the same 30 bars: +0.41%. Communication services (XLC) is not in our data.
Does a lead carry over?
On the 13 other ETFs since 2016, stepping 30 bars at a time, a fund that beat SPY over one 30-bar stretch did the same over the next one, or trailed in both, 49.1% of the time (1,170 stretches). A coin flip would be 50%. The label tells you who has been leading, not who will.
Full thinkScript code
Create a free account or sign in to copy all 33 lines and download the file.
Download
Download the free Relative Performance indicator for ThinkOrSwim. The download is a zip file with one study file, TI_RelativePerformanceSTUDY.ts: the finished code from the video, with the bars and date modes, the benchmark input and both labels. Unzip it and import the .ts file, or copy the code from the Code tab into a new study. If you haven't imported a study before, here's how to import into your ThinkOrSwim platform.
Questions
What is a relative performance indicator?
A relative performance indicator compares the percent return of one symbol with the return of a benchmark over the same period. Ours, for ThinkOrSwim, measures the chart's symbol against SPY by default, over the last 30 bars or since a date, and labels the result Outperform in green or Underperform in yellow, with both percentages in a second label.
How do I add the relative performance indicator to ThinkOrSwim?
Click the Studies icon on a chart and choose Create, name the study, delete the default code and paste the code from the Code tab on this page. Click OK, then Apply. You can also download the zip, which holds one file, TI_RelativePerformanceSTUDY.ts, and import it like any other study.
How do I change the benchmark from SPY to QQQ or a sector ETF?
Open the study's settings and type the new symbol in the benchmark input. You don't need to touch the code. In the video I switched from SPY to XLK this way, and the detailed label changed to show XLK and its 18.48% return over 30 bars. Futures and forex symbols go in the same box.
What is the difference between the bars and date settings?
Bars measures both returns from the close a set number of bars ago, 30 by default, so the window rolls forward with each new bar. Date measures from the close on one date you enter as YYYYMMDD, 20220217 by default, and keeps that start fixed. You pick the mode in the benchmarkType input.
What do the green and yellow labels mean?
Green means the symbol on your chart returned more than the benchmark over the chosen period, and the simple label reads Outperform. Yellow means it returned the same or less, and the label reads Underperform. The detailed label uses the same colors and adds both percentages, such as Tesla's 33.66% against 17.88% for QQQ in the video.
How is relative performance calculated in the code?
Each return is the latest close minus the starting close, divided by the starting close. The code runs that once for the chart's symbol and once for the benchmark, using close(symbol=benchmark) to read the second market. The chart outperforms when its return is greater than the benchmark's.
Is relative performance the same as RSI?
No. The Relative Strength Index measures one symbol's own average gains against its average losses and reads from 0 to 100. Relative performance, often called relative strength, compares two symbols' returns over the same period. This indicator reports the second kind: the chart's return next to the benchmark's.
Can I compare a whole watchlist against SPY at once?
The indicator compares one chart with one benchmark at a time. For a list, the follow-up video turns the same code into the Relative Performance Dashboard, a custom column for a watchlist or the scan tab that shows the gap between each stock's return and the benchmark's and sorts the list by it.
Related tools
 Relative Performance DashboardDashboard · Free
 Utility Labels Indicator - Quickly Track Sector Performance and InternalsthinkScript tutorial · Free
 Utility Labels Indicator UpdatedthinkScript tutorial · Free
 Rate of ChangeIndicator · Free
 Multiple Time Frame Moving AveragesIndicator · Free
 Opening Range BreakoutIndicator · Free
Get each new indicator by email
One email on Sundays with the week's new tool and its code. A free account also unlocks every .txt download.
No credit card. Unsubscribe anytime.