Table of Contents
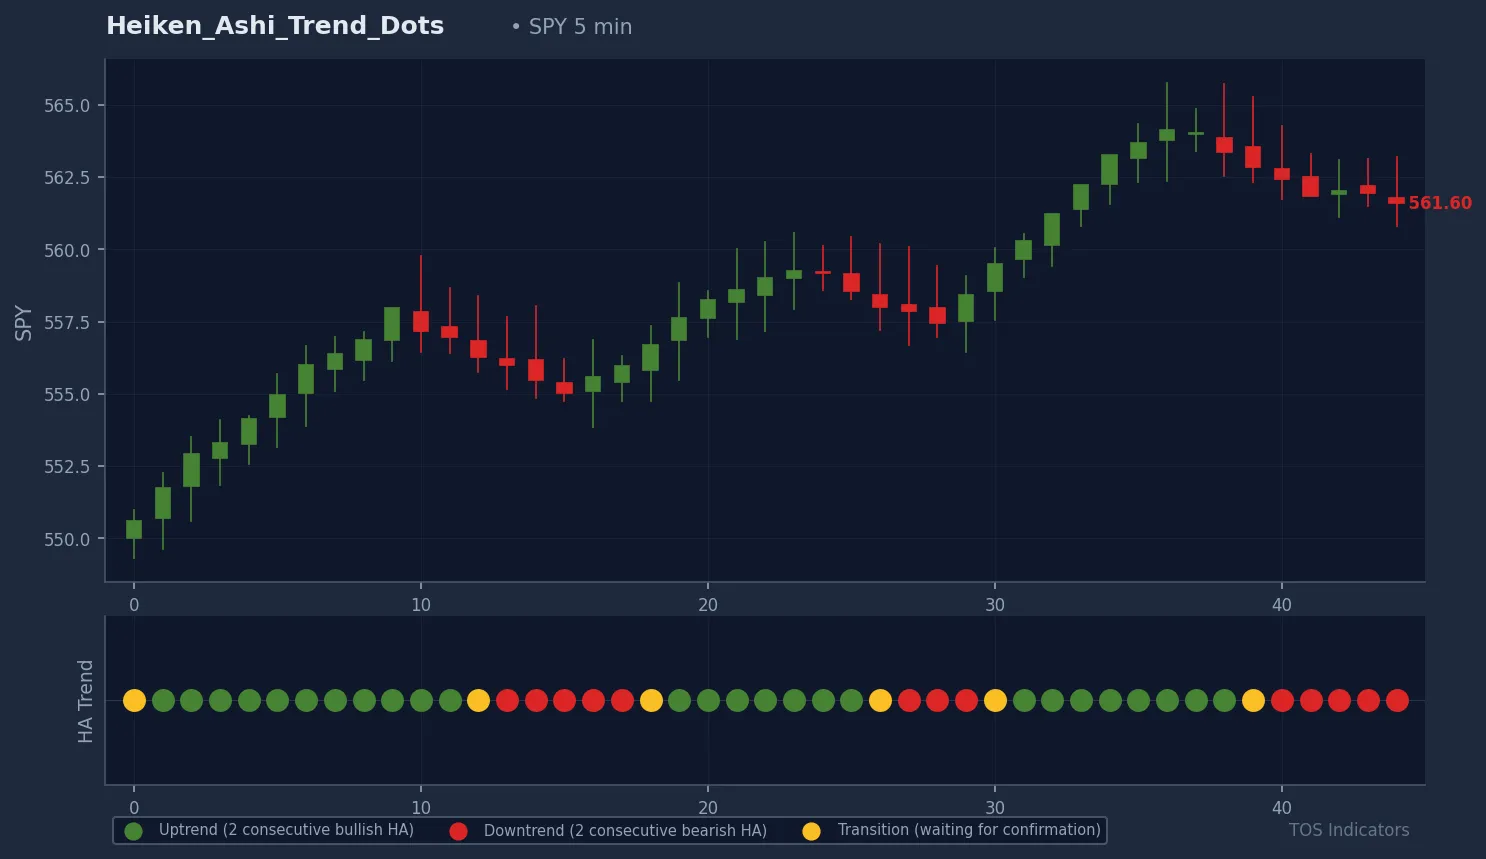
This tutorial walks through building the Heiken Ashi Trend Dots indicator from scratch in ThinkOrSwim. By the end you will have a lower-panel indicator that plots a single colored dot on every bar: green when the trend is confirmed bullish, red when it is confirmed bearish, and yellow during transitions where neither direction has two consecutive bars yet. We build it line by line so you can see what each piece does, not just paste a finished script.
What Is Heiken Ashi and Why Traders Use It
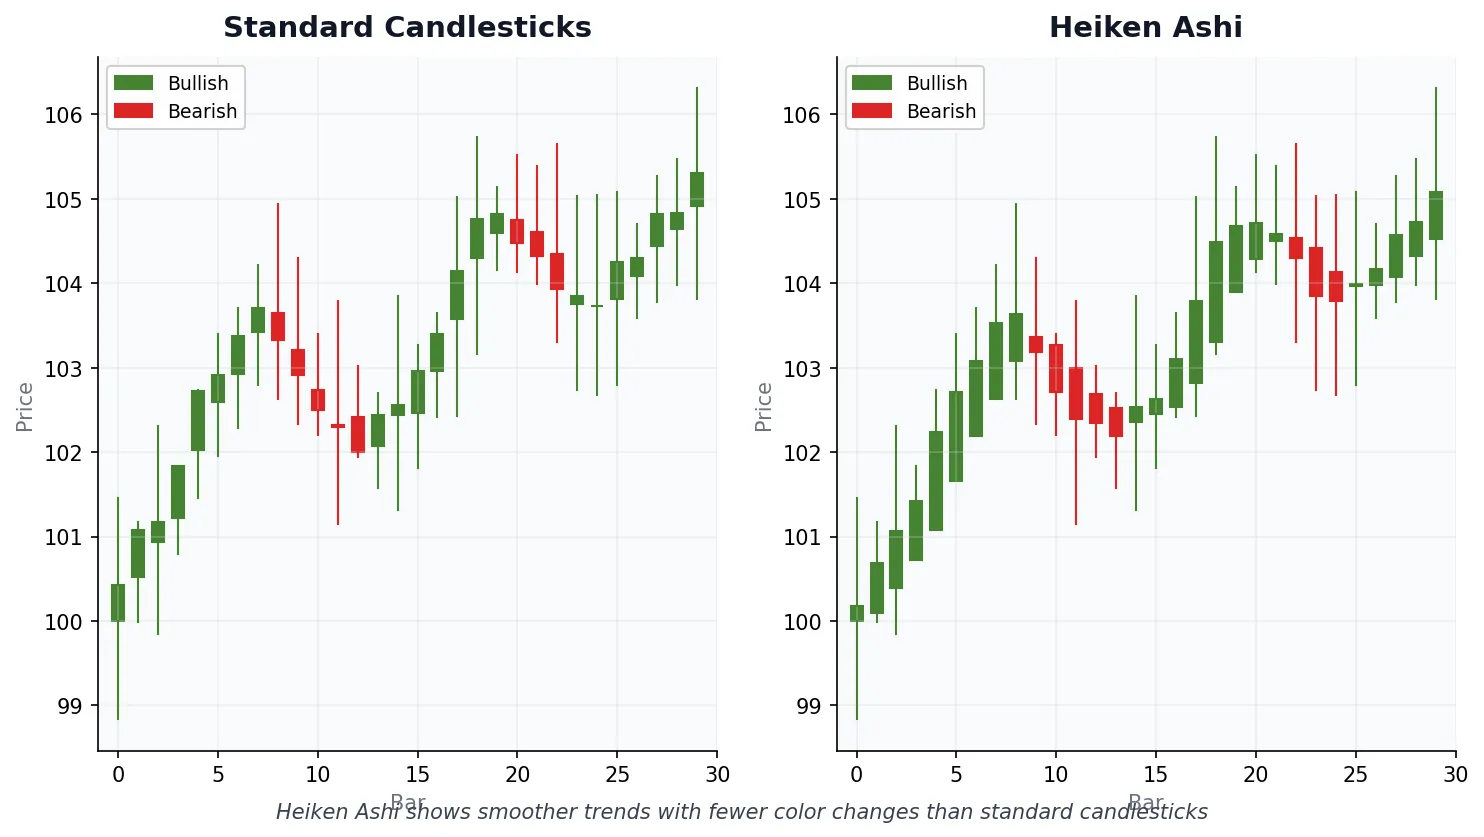
Heiken Ashi means “average bar” in Japanese, and that is the whole concept. Instead of plotting the raw open, high, low, and close on every candle, Heiken Ashi averages those values with the previous bar. The result is a chart that smooths out single-candle noise so trend direction stops flipping on every minor move.
Pull up any ThinkOrSwim chart and you will see a mix of green, red, green, red candles flipping back and forth. That makes it hard to tell whether you are in a real uptrend or just chopping. Because Heiken Ashi averages the data, you get long runs of the same color during real trends. In a clean uptrend you might see eight, ten, even fifteen green candles in a row. When the trend flips, the candle colors flip with it, which makes reversals much easier to spot.
The Heiken Ashi Formula
Before writing any code, the formula is worth understanding because it makes the rest of the build click. Heiken Ashi has four components.
Heiken Ashi Close. The average of the current bar’s open, high, low, and close. Add the four together, divide by four. ThinkScript has a built-in shorthand for this exact calculation: ohlc4.
Heiken Ashi Open. The average of the previous Heiken Ashi bar’s open and close. This is the recursive piece. Each bar’s open depends on the previous bar’s modified values, not the raw price. That dependency is what creates the smoothing effect.
Heiken Ashi High. The highest of three values: the actual bar high, the Heiken Ashi open, and the Heiken Ashi close.
Heiken Ashi Low. The lowest of those same three values: the actual bar low, the Heiken Ashi open, and the Heiken Ashi close.
The key insight is that the open and close are averages. That is why Heiken Ashi trends appear as long runs of the same color, while raw candlesticks flip on every minor wiggle.
Why Use Heiken Ashi
Three practical benefits.
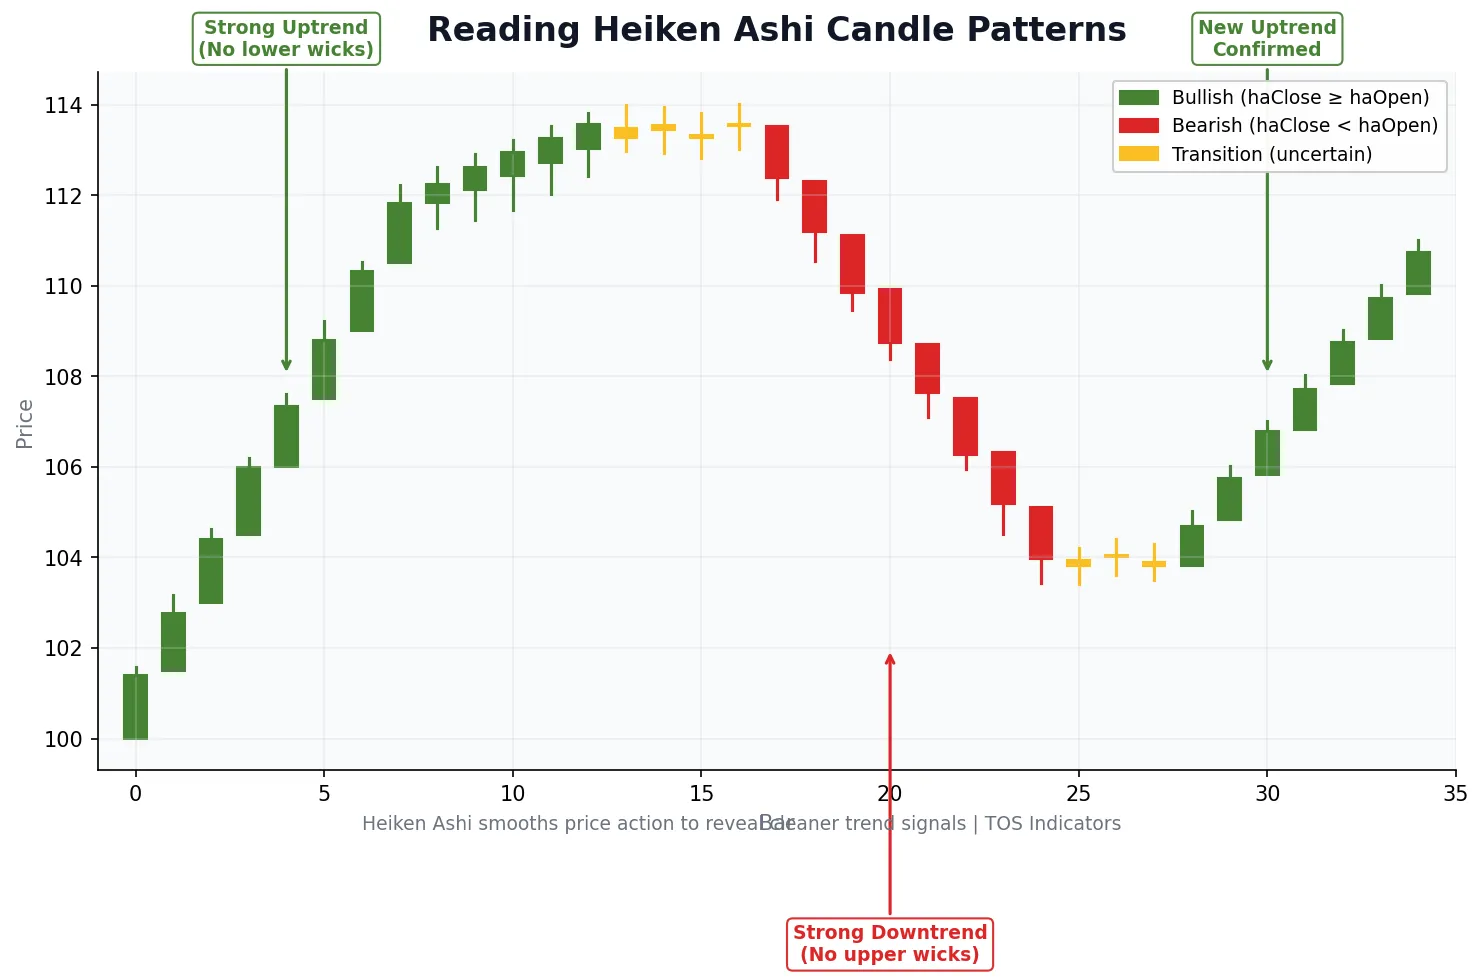
Trend identification. Long runs of the same color make direction obvious at a glance. Less interpretation, less brain power spent second-guessing the chart.
Fewer false signals. Minor pullbacks inside a trend usually do not flip the candle color. A single red bar inside an uptrend will not shake you out of position because the bar simply stays green.
Cleaner reversals. When the color does change, it tends to mean something. It is not just noise.
The tradeoff is lag. Heiken Ashi will never catch the exact top or bottom because the values are averaged. That is by design. Many traders use Heiken Ashi on a higher timeframe for directional bias and then drop down to standard candlesticks on a lower timeframe (two-minute, five-minute, whatever fits) for actual execution.
Building the Indicator Step by Step
Now we build it. The plan: a lower-panel indicator that plots a single dot per bar, colored green when two consecutive Heiken Ashi candles are bullish, red when two are bearish, and yellow during transitions. We add the code one piece at a time so you can see what each line does.
Step 1: Create the Study
Open ThinkOrSwim, click the studies icon, then click Create. The code editor panel opens. Name the indicator TI_HeikenAshi_Dots.
Step 2: Declare a Lower-Panel Indicator
The first thing we tell ThinkOrSwim is that this indicator belongs in a lower panel. We do not want it overlaying the price chart.
declare lower;That single line keeps the indicator below price and out of the way.
Step 3: Calculate the Heiken Ashi Close
The Heiken Ashi close is the average of the current bar’s open, high, low, and close. ThinkScript ships with ohlc4, which gives us exactly that.
declare lower;

def HeikenAshi_Close = ohlc4;
The Heiken Ashi close value is now stored in HeikenAshi_Close.
Step 4: Calculate the Heiken Ashi Open
The Heiken Ashi open is the average of the previous Heiken Ashi bar’s open and close. In ThinkScript, [1] means “the previous bar’s value of this variable.” So we reference HeikenAshi_Open[1] and HeikenAshi_Close[1], add them, divide by two.
declare lower;

def HeikenAshi_Close = ohlc4;
def HeikenAshi_Open = (HeikenAshi_Open[1] + HeikenAshi_Close[1]) / 2;
This is the recursive part. Every bar’s open depends on the previous bar’s values, which is what creates the smoothing.
Step 5: Detect Trend Direction on Each Bar
If the Heiken Ashi close is at or above the Heiken Ashi open, that bar is bullish. If it is at or below, bearish. We capture both as 1/0 flags.
def HeikenAshi_TrendUp = if HeikenAshi_Close >= HeikenAshi_Open then 1 else 0;
def HeikenAshi_TrendDown = if HeikenAshi_Close <= HeikenAshi_Open then 1 else 0;
At this point we know the direction of the current bar. But a single bar is too jumpy to act on. We need confirmation.
Step 6: Require Two Consecutive Bars for Confirmation
Instead of reacting to every bar, we wait for two same-direction bars in a row before calling the trend confirmed. If the current bar is bullish AND the previous bar was bullish, the signal is 1. If both are bearish, the signal is -1. Anything else is neutral (0).
def HeikenAshi_TrendSignal =
    if HeikenAshi_TrendUp == 1 and HeikenAshi_TrendUp[1] == 1 then 1
    else if HeikenAshi_TrendDown == 1 and HeikenAshi_TrendDown[1] == 1 then -1
    else 0;
That extra bar of confirmation is what cuts out the back-and-forth noise you would otherwise get on every bar.
Step 7: Plot a Dot at the Zero Line
Now we put something on the chart. We want one dot per bar, sitting at the zero line in the lower panel. The !IsNan(HeikenAshi_Close) check just confirms we have data for that bar; if we do, plot at zero, otherwise skip it.
plot HeikenAshi_Dots = if !IsNan(HeikenAshi_Close) then 0 else Double.NaN;Step 8: Make the Dots Visible
By default the plot would draw as a faint line. We want big, obvious dots. Two settings handle that: SetPaintingStrategy tells ThinkOrSwim to render points instead of a line, and SetLineWeight bumps the size. Line weight accepts values from 1 to 5; we use 5, the heaviest.
HeikenAshi_Dots.SetPaintingStrategy(PaintingStrategy.POINTS);
HeikenAshi_Dots.SetLineWeight(5);
Step 9: Color the Dots by Signal
Last piece. Green when the trend signal is 1 (confirmed bullish), red when it is -1 (confirmed bearish), and yellow for everything else (transition or neutral).
HeikenAshi_Dots.AssignValueColor(
    if HeikenAshi_TrendSignal == 1 then Color.GREEN
    else if HeikenAshi_TrendSignal == -1 then Color.RED
    else Color.YELLOW
);
Save the study and apply it to a chart. Green dots line up under confirmed uptrends, red dots under confirmed downtrends, and yellow dots mark the transition zones where direction has not yet flipped both bars in the same direction. The full assembled code is in the Code tab above.
How to Use the Indicator
The simplest application is to take trades only in the direction of the dots. Longs when dots are green or transitioning yellow-to-green, shorts when dots are red or transitioning yellow-to-red. When dots flip from a confirmed color back to yellow, that is your cue to lighten up, pull back, or get out.
This works as a trend filter, not a complete entry system. Pair it with a trigger you already trust: an Edge Signals indicator, a moving average crossover, or a momentum read like RSI. The trend filter tells you which direction to trade. The trigger tells you when. Together they give you a much more complete picture than either alone.
It works on any symbol and any timeframe. Higher timeframes give you fewer but more reliable signals. Lower timeframes give you more signals at the cost of more noise.
TradingView (PineScript) Version
Trading on TradingView instead of ThinkOrSwim? We have published the same indicator as a free PineScript on TradingView. The logic is identical: Heiken Ashi close and open computed from raw OHLC, two-bar confirmation for trend signal, dots colored green / red / yellow at the zero line in a sub-panel.
Get it here: Heiken Ashi Trend on TradingView. Click Add to favorite indicators and it will be available in your indicators dialog inside the chart.
Limitations
Lag is built in. Heiken Ashi averages price, so signals always trail raw price action. You will never catch the exact top or bottom. Accept it as the cost of a cleaner read.
Modified prices are not real prices. The Heiken Ashi values are averages, not actual OHLC. Do not use them for stop placement or limit-order pricing. Reference standard candles for any price-level decision.
Choppy markets produce yellow. When the market is genuinely sideways, the indicator will sit on yellow and refuse to confirm. That is the indicator working correctly. Either trade a different setup or stand aside until direction returns.
Heiken Ashi Indicator.ts
# TI_HeikenAshi_Dots

# Plots a colored dot per bar in a lower panel based on

# Heiken Ashi trend confirmation:

#   green  = two consecutive bullish HA candles

#   red    = two consecutive bearish HA candles


// ... 11 more lines ...Heiken Ashi candles use modified OHLC values calculated by averaging price data across consecutive bars. Regular candlesticks show raw price data without any smoothing. This makes Heiken Ashi better for trend identification but unsuitable for precise entry and exit pricing.
The two-candle requirement filters out false signals caused by single-bar reversals. A single color change could be noise. Two consecutive same-colored candles provide stronger confirmation that a real trend shift has occurred. The yellow transition dots alert you when confirmation is pending.
The indicator works on any timeframe, but the appropriate choice depends on your trading style. Day traders often use 5-minute or 15-minute charts. Swing traders may prefer daily charts. Higher timeframes produce fewer but more reliable signals. Lower timeframes generate more signals with more noise.
Yes, but this indicator is designed for a lower panel to keep your main chart uncluttered. To plot Heiken Ashi candles directly on the price chart, you would need a different indicator that replaces or overlays the candle visuals. The Trend Dots approach lets you maintain standard candlesticks for precise price levels while monitoring Heiken Ashi trends below.
The indicator works for any instrument that produces OHLC price data, including stocks, ETFs, futures (ES, NQ, CL), and forex. It does not work for options Greeks or implied volatility displays because those are not OHLC-based. For options trading, use this indicator on the underlying stock or index chart to determine directional bias.
The indicator includes built-in alert inputs. Set useAlerts to yes, then in ThinkorSwim go to Setup > Alerts and create a new alert on the study. You can configure separate sounds for buy and sell signals using the buySound and sellSound inputs. Alerts trigger when haSignal changes from 0 to 1 (bullish) or 0 to -1 (bearish).
A yellow dot indicates a transition period where the trend has not yet been confirmed in either direction. This happens when the current Heiken Ashi candle color differs from the previous candle. The indicator requires two consecutive same-color candles before signaling green (uptrend) or red (downtrend). Yellow dots are periods to wait rather than act.
Yes. Common pairings include using the Trend Dots for direction confirmation alongside volume indicators like RVOL for entry timing, or with support and resistance levels from the Opening Range Breakout. The dots work well as a trend filter: only take long setups when dots are green, short setups when red, and stay flat during yellow transitions.
Here are some resources that you may find useful: