Covered Call Calculator
In under 30 minutes, we'll teach you how to build a simple, yet powerful Covered Call Calculator for ThinkOrSwim to find the most profitable calls to sell

In today's tutorial, we are going to be building a Covered Call Calculator. The whole idea behind this calculator is that we can very easily take a look at an options chain, and get an idea as to which calls equate to what percentage, as a return on our capital.
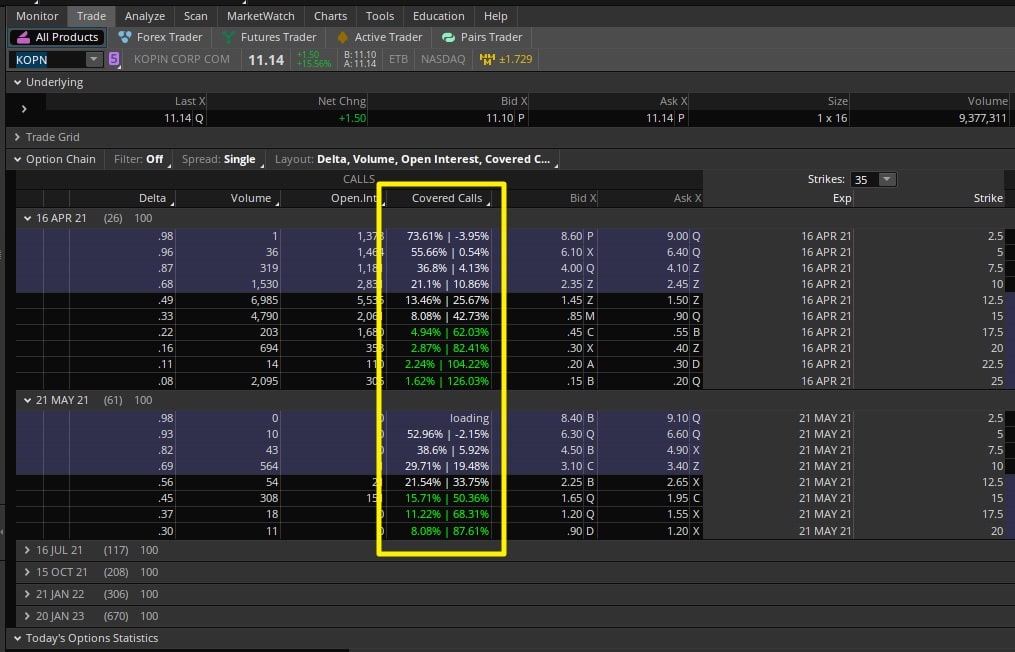
If you are already familiar with covered calls and want to skip the coding exercise, you can use the link in the description box to download the final version of the calculator.
For Volatility Box members, I’ve built a more advanced version of the Covered Call Calculator, which allows you to run this analysis on stocks you already own, where you can input your cost-basis, and evaluate the return percentages.
The tutorial will be released early this week, and we will send out an email once the code/tutorial are available.
The way I have laid out this tutorial is in 4 different parts:
- Part 1: Real-estate analogy for covered calls
- Part 2: We will build out the calculator in a very simple Excel sheet
- Part 3: We will then translate the calculator into ThinkOrSwim code
- Part 4: We will apply the calculator and compare different options chains
So, let’s get started!
Volatility Box Invite
We are TOS Indicators.com, home of the Volatility Box.
The Volatility Box is our secret tool, to help us consistently profit from the market place. We’re a small team, and we spend hours every day, after the market close, doing nothing but studying thousands of data points to keep improving and perfecting the Volatility Box price ranges.
We have two different Volatility Boxes - a Futures Volatility Box and a Stock Volatility Box.
Futures Volatility Box - Trade Major Markets With an Edge
Designed For: Futures, Micro-Futures and Index Market Traders
Supported Models: Hourly Volatility Box models
Supported Markets: 10 Major Futures Markets
The Futures Volatility Box comes with:
- 5 Volatility Models for each market
- Support for 10 Futures Markets (/ES, /NQ, /YM, /RTY, /CL, /GC, /SI, /ZB, /HG, /NG)
- Video Setup Guide
- Trade Plan
- Access to all members-only resources, including Squeeze Course
Learn More About the Futures Volatility Box
Trade futures and micro futures with a consistent volatility edge
Stock Volatility Box - Powerful Web Based Volatility Platform
Designed For: Stock and Options Traders
Supported Models: Hourly and Daily Volatility Box models
Supported Markets: 10,000+ Stocks and ETFs (new markets added frequently)
A Stock Volatility Box membership includes access to:
- Live Scanner - A powerful scanner we've built from scratch, to scan 10,000 symbols every 2 seconds for new volatility breaches
- Dashboard - A quick and easy way to view daily volatility model levels online
- Short Interest Scanner - Short interest, Squeeze, and EMA data to find short squeezes
- Squeeze Course - All of our proprietary squeeze tools, including robust backtesters
- All Members Only Indicators - We don't nickel and dime you. Everything really is included.
- And much more!
Learn More About the Stock Volatility Box
Trade stocks and options with a consistent volatility edge
How Covered Calls are Similar to Real Estate?
Let's start by first comparing how covered calls are similar to real estate.
And instead of using made-up numbers, let’s use a real example. This is a piece of property that’s on sale in Indiana. I’ve blacked out the address, but we can see the rest of the details here.
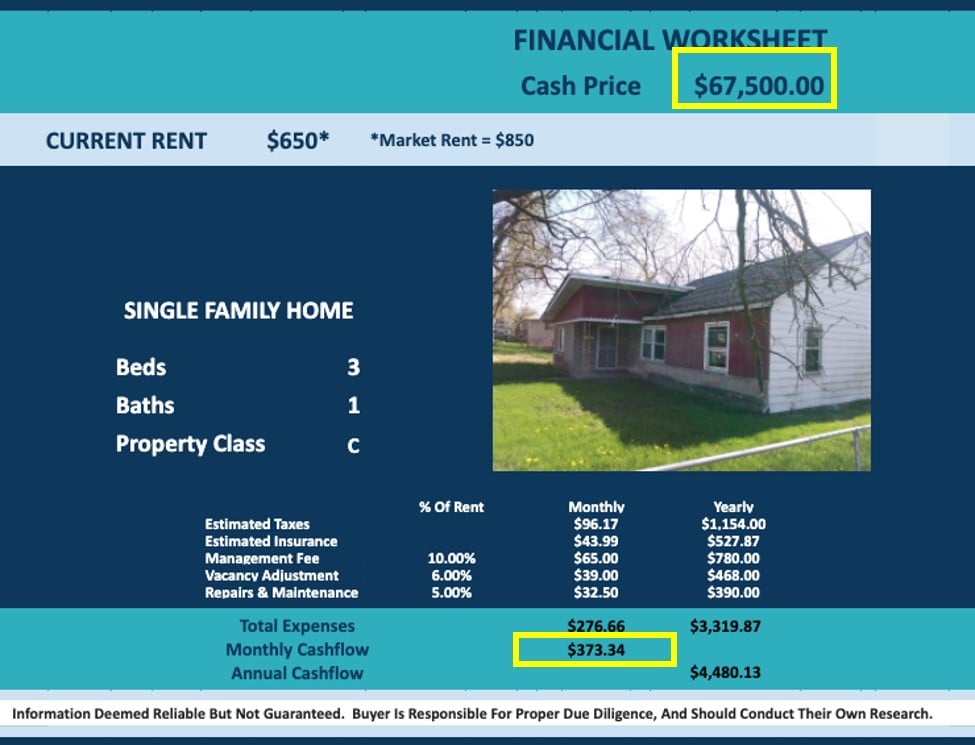
This worksheet is made by the folks trying to sell the property, so keep in mind, the numbers are most likely a bit inflated. And even THEN, you will find, that using the covered call ThinkOrSwim calculator, you can very easily find better opportunities.
The cash list price for this house is $67,500.
The monthly cash flow, after expenses, is approximated to be $373.34.
That’s a monthly cash flow of 1%.
So let’s say this a different way - with $67,500 invested, we expect to make a 1% return every 30 days, in the form of “rent.” Equity appreciation is separate, and we’ll leave it as a non-factor for this exercise.
And before we even get to comparisons, let’s state the obvious - real estate is a much different asset class, with a different set of goals and risk parameters, and comparing the two is akin to comparing apples to oranges.
Yet, we try to do it anyways in the next section.
Now, let’s compare the rental income to covered call income.
We’ll use the same $67,500 as our starting point, to assess how many shares of a certain company we can buy, and how many calls we can sell against those shares.
For this example here, I’ve laid out 3 different stocks and their respective returns.
| ATM calls | T (Low Volatility) |
FSLY (Mid Volatility) |
CURI (High Volatility) |
AMC (Very High Volatility) |
| 16 APR 21 IV | 25.28% | 74.49% | 119.76% | 196.03% |
| Return % if calls not exercised | 1.44% | 5.3% | 9.32% | 19.02% |
| Return % if calls exercised | 2.25% | 11.23% | 18.01% | 19.53% |
As you can see, in all scenarios, ranging from a stock like AT&T (T), which has only 25% IV, all the way up to a stock like AMC (AMC), we outperform the 1% from real estate.
The “risk” here is the fluctuation in the price of the underlying, which could go against you much quicker than that of a house. And that’s why, I’ve laid out different volatility regimes, for transparent comparison.
The most important question, that I think your answer has to be “yes” to, is if you are comfortable being long shares of the underlying that you are l booking at.
If the answer to that is no, keep going down your candidate list.
Covered Call Calculator in Excel:
Let’s start by building a covered call calculator in Excel first.
A side note before we get started -- this process is even easier in Google Sheets, where you can use the Google Finance function to automate cells, such as the current price of the stock, etc.
This doesn’t need to be polished, so let’s keep it efficient.
We will need a list of symbols, their current stock price, the strike of the option we’d like to sell, along with the premium received. And using that information, we can calculate two different return percentages.
One return percentage will be based around if the shares do not get called away, and the second return percentage will be based around if the shares do get called away.
The scenario in which our Out-Of-The-Money (OTM) covered call gets exercised is analogous equivalent to selling a piece of property with at least (some) equity appreciation.
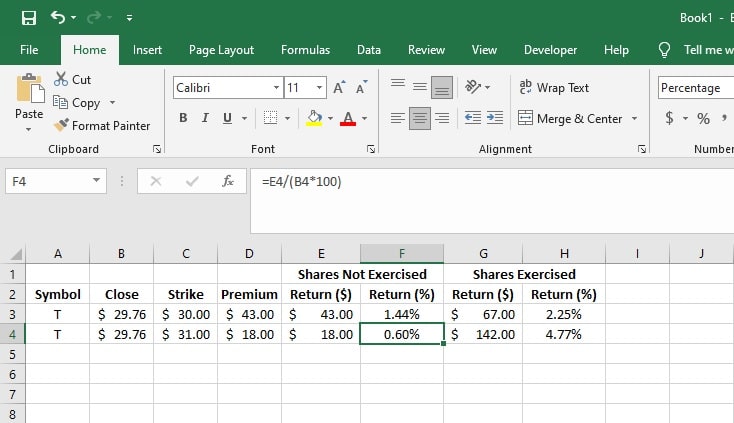
Here is the formula for calculating the return percentage, for shares that do not get called away (per 1-lot / 100 shares):
- Premium Collected / Current Price
Here is the formula for calculating the return percentage, for shares that are called away (per 1-lot / 100 shares):
- (Premium Collected + Profit From Selling Shares) / Current Price
And that's the calculator built in Excel. We now need to translate this entire Excel worksheet into thinkScript code, which allows this entire process to be automated.
Covered Call Calculator in ThinkOrSwim:
For Part 3 of this tutorial, we’re going to translate the formulas that we’ve built into Excel into thinkScript.
There are 2 key benefits to having our covered call calculator live inside of ThinkOrSwim:
- You can quickly compare different strikes, across different expirations, for a single stock
- You can quickly compare a group of stocks, and rank by return percentages
Let’s start out.
If you are pasting in the final downloaded code, this is the process you will need to follow as well.
First, we need to come into the “Trade” tab inside of our ThinkOrSwim platform.
This code will live inside of a “Custom Quote” in TOS, which is also shared by the dashboard columns.
To create a custom quote, we can click the drop down, and select “Customize”
After choosing “Customize,” you can select “Custom Quotes” from the drop down menu, and click the scroll icon to create a new custom quote.
Inside of the custom quote, we can start by first defining our base variables. These include our base share count, and our base contract count.
def maxShares = 100;
def maxContracts = 1;
By defining them separately, this allows us to change the value of these variables in one place, instead of every line in the code.
After that, we can start by defining the formula for our return percentage for the scenario in which our call is not exercised:
def totalStrikePriceGainPct = (totalStrikePriceGain + premiumCollected)/(MaxContracts*100*close(getUnderlyingSymbol()));

def premiumCollectedPct = premiumCollected/(MaxContracts*100*close(getUnderlyingSymbol()));
Great. Next, we need to define the formula for our second scenario - the one in which our call does get exercised, and our shares taken away from us:
def strikePriceGain = GetStrike() - close(getUnderlyingSymbol());
def totalStrikePriceGain = strikePriceGain * maxContracts * 100;
def totalStrikePriceGainPct = (totalStrikePriceGain + premiumCollected)/(MaxContracts*100*close(getUnderlyingSymbol()));
That’s it. We have the two different pieces that help us make this calculation.
Now, we need to plot the values in a neat manner, using labels.
AddLabel(totalStrikePriceGain,AsPercent(premiumCollectedPct) + " | " + AsPercent(totalStrikePriceGainPct), color.white);
Click Save. And apply to our charts.
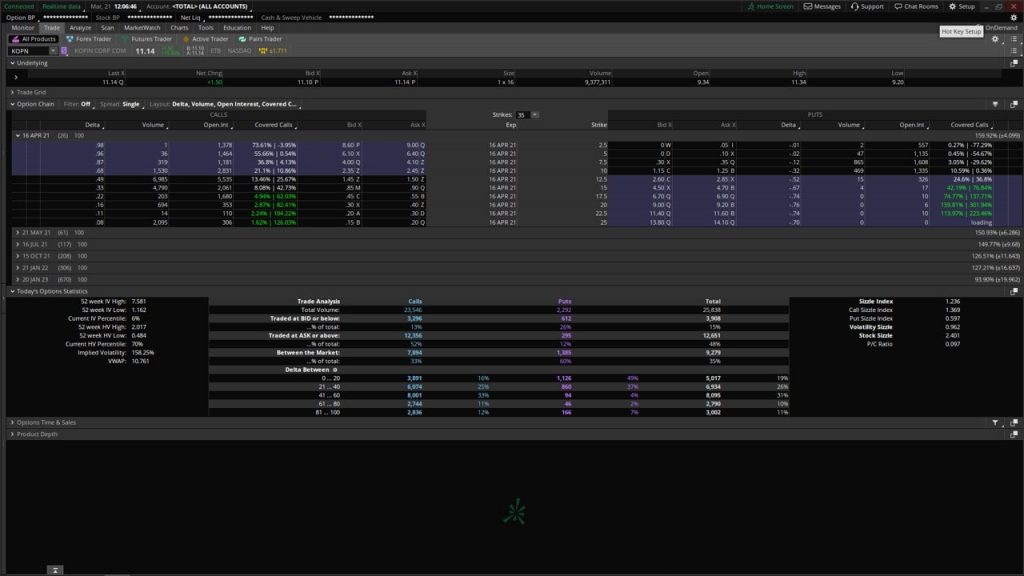
And just like that, we have an extra column inside of our options chain, that calculates for us the returns for each option’s strike, across a variety of different expirations.
Applying the Covered Call Calculator on KOPN:
Let’s apply our new Covered Call Calculator to the stock, KOPN.
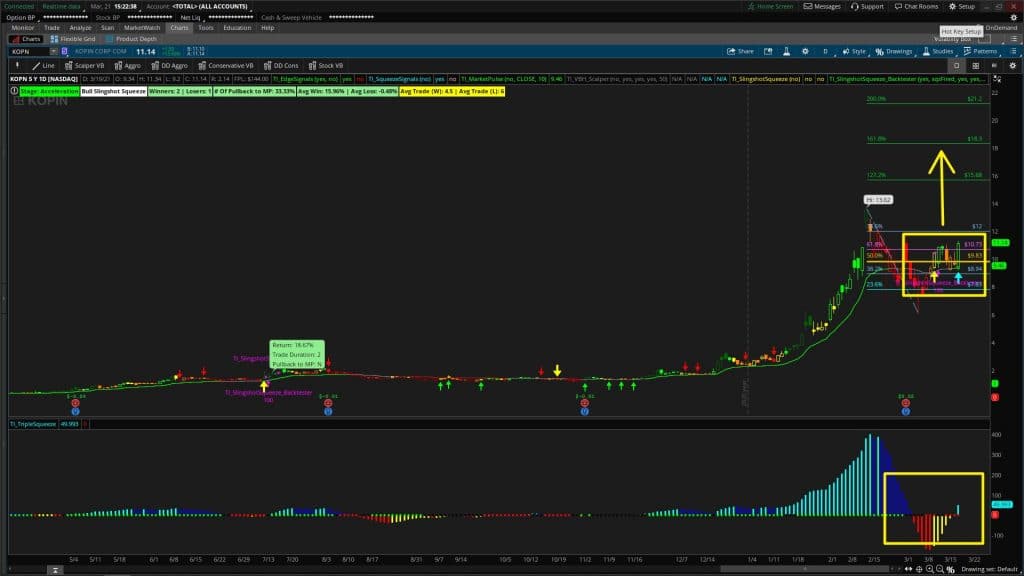
There are a few reasons why KOPN is on our radar:
- Trend - We have a bullish Market Pulse line, confirming a bullish trend
- Squeeze - We had a recent Slingshot Squeeze signal fire long, which has 2 winners and 1 loser over the past 5 years. Average winner is 15.96%, while the 1 loser was -0.46%.
- Squeeze - We had a Squeeze Signal fire long with Friday’s activity, suggesting continued bullish movement, and for the squeeze to fire long
Now, if we come in to the option’s chain, let’s evaluate what we have. We’ll start with the April monthlies first.
On our charts, $16 and $18 are the two Fibonacci Extensions that we have, where we expect price to pause and reverse.
The closest strike we have which accounts for both of those levels is the $20 strike. That’s a delta 16 call option, in which your return percentage for just the premium is 2.87%, and if your calls are exercised, is 82.41%.
Not bad.
If we move one strike closer to In-The-Money (ITM), we have the $17.50 strike, which would alter those percentages to 4.94% and 62.03%, respectively.
Now, if we switch to a different expiration cycle - let’s navigate to the 21 May ‘21 time series.
For the same $20 strike, the percentages have shifted from the 2.87% and 82.41% to 8.08% and 87.61%.
A different way of saying the same thing is that you are being compensated with 5.21% in additional premium, for taking on the risk of another 35 days.
The downside is the much lower liquidity in the $20 strikes in the May series, compared to the April series.
Conclusion:
That brings us to the end of our tutorial. We built an entire Covered Call Calculator for the options chain in ThinkOrSwim, and it really didn’t take us a whole lot of time to build it.
If covered calls were part of your trading plan or strategy, you can now use this calculator to help make that process more efficient, and target the call that helps you meet your trading goals.
Conversely, if covered calls were previously not a part of your trading plan, I hope this tutorial helped demonstrate how they can be powerful, if used correctly.
Download
Click the button below to download the Covered Call Calculator for ThinkOrSwim.
