Table of Contents
- Why is the VScore Important?
- How is the Z-Score Related to Trading?
- Differences Between Upper and Lower VScore Indicators
- How is Our VScore Indicator Different?
- Build the Lower VScore Indicator (thinkscript):
- Build the Upper VScore Indicator (thinkscript):
- VScore Trading Setup Rules: Fades with the VScore
- VScore Trading Setup Rules: Trend Continuation
What is the VScore?
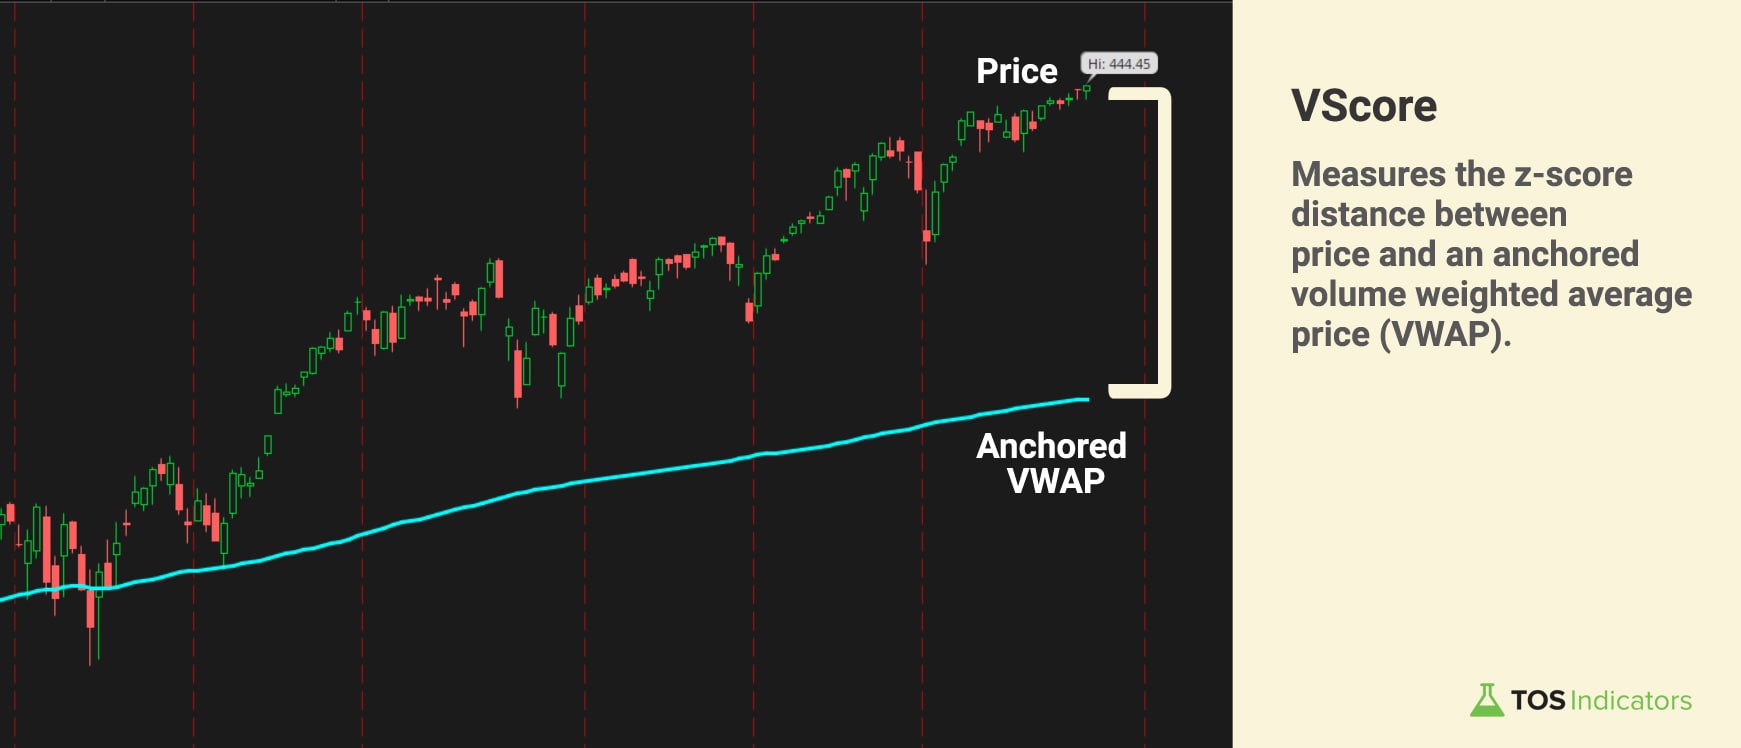
The VScore is a free trading indicator that helps you understand and plot price behavior in relation to its standard deviation, and distance from the Volume Weighted Average Price (VWAP).
There are 3 key things that the VScore helps you do:
- Understand Trend: Whether you’re predominantly above or below the mean provides you context around price action from a given date and time.
- Reversion to the Mean: Easily spot a reversion to the mean using the z-score distance between price and VWAP (down to a single stock price)
- Support and Resistance: Upper and lower standard deviations representing support and resistance are visually obvious, and statistically relevant.
You can anchor our VScore to any particular date, and use the tool to understand whether we’ve pulled back enough to a place where the symbol has usually found support, or where resistance has generally presented itself.
Why is the VScore Important?
The VScore is a derivative of the z-score, which measures the volatility in prices for different securities and indexes, when compared against the volume weight average price (VWAP).
As an example, using the VScore, you can get a more accurate reading on what direction an index may head in next. This could help you, as a trader/investor, identify potential buying opportunities in stocks with retests of key standard deviation levels.
Additionally, with a common anchor point (such as the beginning of every hear ie. January 1, 2021), you have a quick and easy method to evaluate stocks, ETFs and futures on a relative basis:
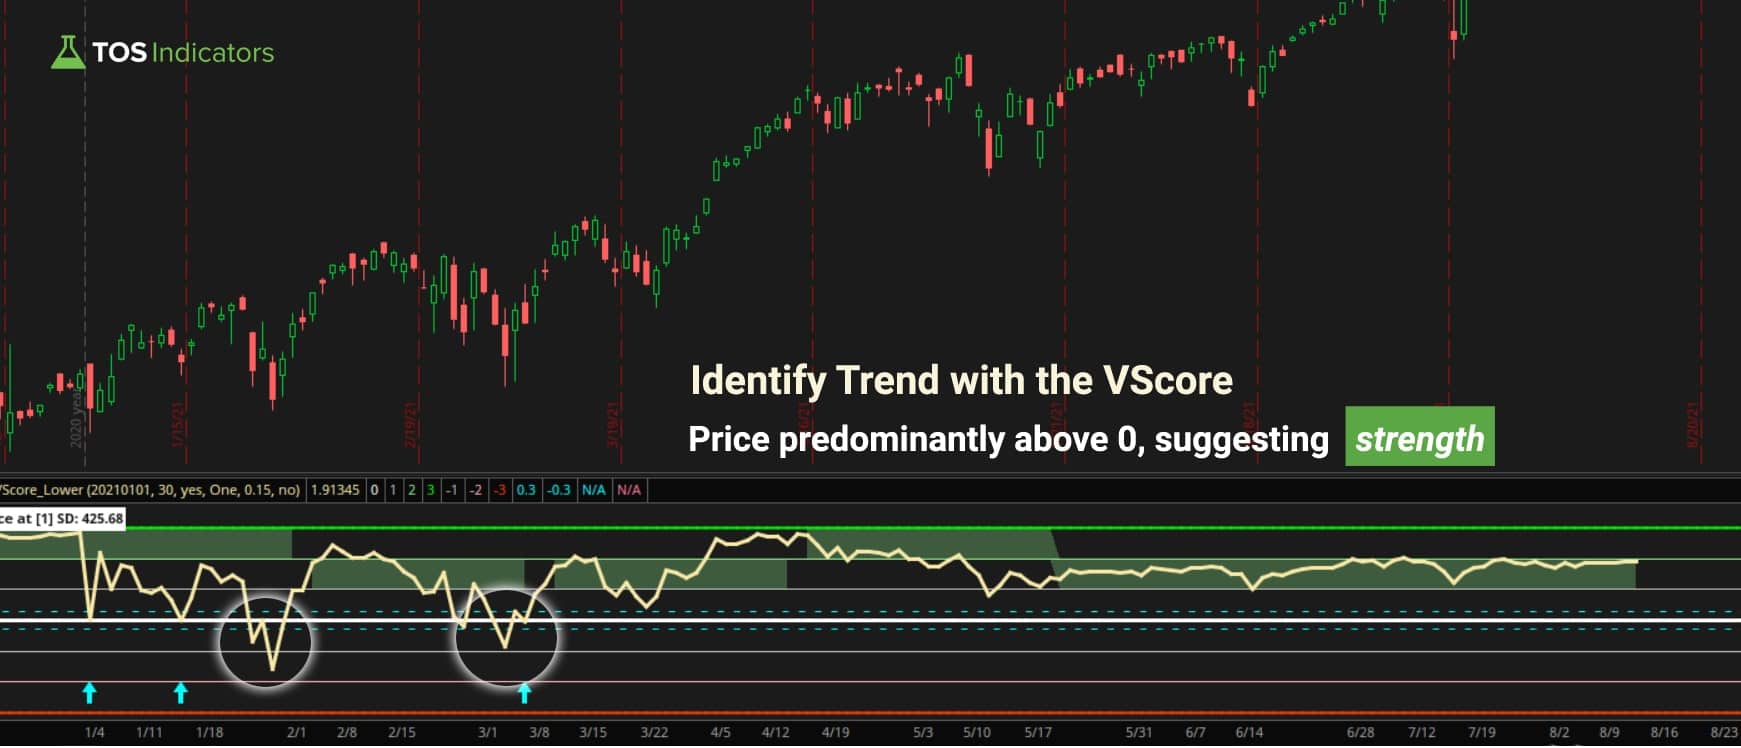
- The ones that have been predominantly above 0 represent stocks trading above the volume weighted average price, suggesting strength.
- The ones that have been predominantly below 0 represent stocks trading below the volume weighted average price, suggesting weakness.
- The ones that have been chopping from positive to negative levels representing stocks with no clear trend, suggesting chop.
This information can be combined with other indicators, such as the Edge Signals or Squeeze Course indicators, to pinpoint exact reversal zones, supported by momentum.
How is the Z-Score Related to Trading?
In statistics, a Z-score is a number that describes how far your score is from the average score of some group. For example, if someone has a Z-score of one, it means they have one standard deviation above the mean (read: average).

Source: Investopedia
The z-score is a measure of the magnitude of deviation in an asset’s value from mean. It’s important for traders and statisticians to understand these deviations to better predict price, as well as classify trades by risk.
The mean is the average value of a set, and in the case of the VScore ThinkOrSwim indicator, it’s in the price of the anchored VWAP (usually anchored to either the beginning of the current year, or 1 year prior to the current date).
The standard deviation tells you how much values typically vary from the mean; a higher deviation indicates that values are more spread out than those with lower deviations (i.e., more tightly clustered around the mean).
Differences Between Upper and Lower VScore Indicators
The Upper VScore Indicator is an updated tutorial in 2021, that builds upon the original idea of calculating the zscore distance between price action and its anchored VWAP. Instead of having the indicator plot on the lower panel, the Upper VScore plots directly with price action.
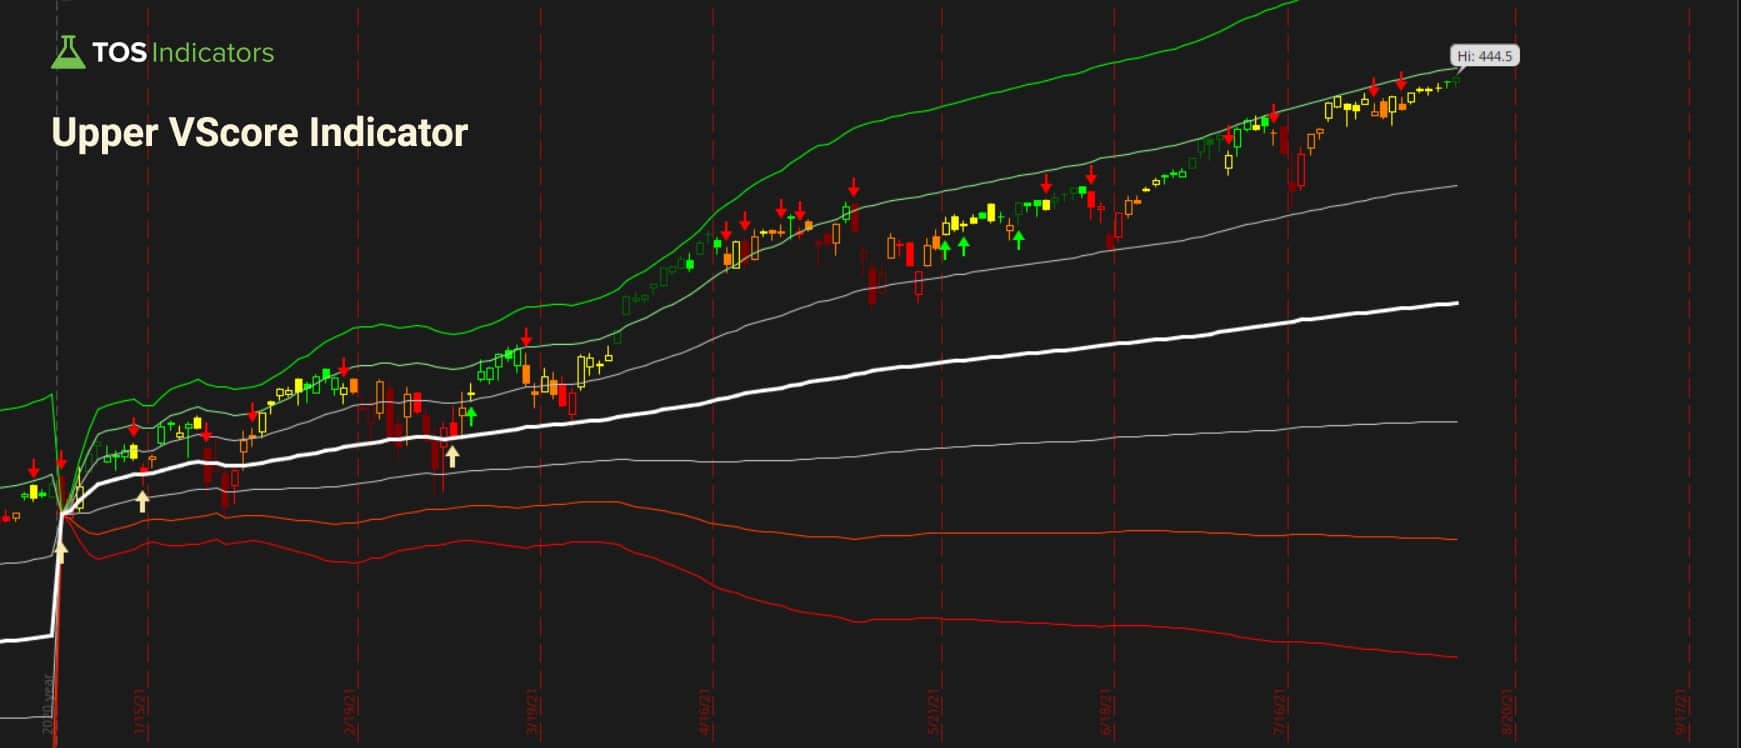
This allows you to visually understand where price action is, relative to its historical statistical distance. The upper version of the indicator also allows you to combine and layer on any other indicators that you’d normally be using.
In contrast, the Lower VScore Indicator may be more straightforward for traders who like to spot divergences alongside price action. The indicator is cleaner on the charts, and can be anchored to any date or time that is visible on your ThinkOrSwim charts.

You can find examples of some of our favorite trade setups below, using winning combinations of indicators that add an edge.
How is Our VScore Indicator Different?
First and foremost, our VScore indicator is completely free.
The following is all included as part of the download folder for this tutorial:
- Upper VScore Indicator for ThinkOrSwim
- Lower VScore Indicator for ThinkOrSwim
In addition to the VScore Indicator, we have also built VScore scans, which are 100% free as well, and available for you to download here:
The following is all included as part of the download folder for this tutorial:
There are a few different stores online that have their own versions (both paid and free)…
There are also quite a few different free versions for different platforms, like TradingView and ProRealTime.
But there were no free versions for ThinkOrSwim.
So… we built one!
And, as usual, we worked on finding ways to make ours better.
Here are some bells & whistles that we’ve added to our version of the VScore ThinkOrSwim indicator:
- Translate Standard Deviation Cryptic Code into Real-World Prices
- Automatically Switch Between End of Day and Intraday V-Scores
- Easily Plan Entries, Exits, and Stops All Ahead of Time
- Identify “Winning Standard Deviation” Trend With Colors
- Clear Buy/Sell Signals Using Reversion to Mean
- Alerts Included
You can follow along the tutorial below, learn more about our setups, and download the final versions of the indicator.
Build the Lower VScore Indicator (thinkscript):
Let’s start with the Lower VScore Indicator first, which will be our baseline for the upper version of the indicator as well.
One piece of code that you will need to get started is the Anchored VWAP code, which is available here, for free.
The calculation for the V-Score, using the thinkscript format is included below for copy/paste:
plot VScore = if (((price - close)*(-1))/deviation) > 5 or (((price - close)*(-1))/deviation) < -5 then 0 else (((price - close)*(-1))/(deviation));
The code for the clouds, which help you determine which area the V-Score spends the most time in-between is included below:
def cloud1;
def cloud2;
if Sum(zeroAndOne, barsGoBack) > Sum(OneAndTwo,barsGoBack) and Sum(zeroAndOne, barsGoBack) > Sum(twoAndThree,barsGoBack) and Sum(zeroAndOne, barsGoBack) > Sum(negZeroAndOne,barsGoBack) and Sum(zeroAndOne, barsGoBack) > Sum(negoneAndTwo,barsGoBack) and Sum(zeroAndOne, barsGoBack) > Sum(negtwoAndThree,barsGoBack){
cloud1 = zero;
cloud2 = one;
}
else if Sum(OneAndTwo, barsGoBack) > Sum(zeroAndOne,barsGoBack) and Sum(OneAndTwo, barsGoBack) > Sum(twoAndThree,barsGoBack) and Sum(OneAndTwo, barsGoBack) > Sum(negZeroAndOne,barsGoBack) and Sum(OneAndTwo, barsGoBack) > Sum(negoneAndTwo,barsGoBack) and Sum(OneAndTwo, barsGoBack) > Sum(negtwoAndThree,barsGoBack){
cloud1 = one;
cloud2 = two;
}
else if Sum(twoAndThree, barsGoBack) > Sum(zeroAndOne,barsGoBack) and Sum(twoAndThree, barsGoBack) > Sum(oneAndTwo,barsGoBack) and Sum(twoAndThree, barsGoBack) > Sum(negZeroAndOne,barsGoBack) and Sum(twoAndThree, barsGoBack) > Sum(negoneAndTwo,barsGoBack) and Sum(twoAndThree, barsGoBack) > Sum(negtwoAndThree,barsGoBack){
cloud1 = two;
cloud2 = three;
}
else if Sum(negZeroAndOne, barsGoBack) > Sum(zeroAndOne,barsGoBack) and Sum(negZeroAndOne, barsGoBack) > Sum(oneAndTwo,barsGoBack) and Sum(negZeroAndOne, barsGoBack) > Sum(twoAndThree,barsGoBack) and Sum(negZeroAndOne, barsGoBack) > Sum(negoneAndTwo,barsGoBack) and Sum(negZeroAndOne, barsGoBack) > Sum(negtwoAndThree,barsGoBack){
cloud1 = zero;
cloud2 = negOne;
}
else if Sum(negoneAndTwo, barsGoBack) > Sum(zeroAndOne,barsGoBack) and Sum(negoneAndTwo, barsGoBack) > Sum(oneAndTwo,barsGoBack) and Sum(negoneAndTwo, barsGoBack) > Sum(twoAndThree,barsGoBack) and Sum(negoneAndTwo, barsGoBack) > Sum(negZeroAndOne,barsGoBack) and Sum(negoneAndTwo, barsGoBack) > Sum(negtwoAndThree,barsGoBack){
cloud1 = negOne;
cloud2 = negTwo;
}
else if Sum(negtwoAndThree, barsGoBack) > Sum(zeroAndOne,barsGoBack) and Sum(negtwoAndThree, barsGoBack) > Sum(oneAndTwo,barsGoBack) and Sum(negtwoAndThree, barsGoBack) > Sum(twoAndThree,barsGoBack) and Sum(negtwoAndThree, barsGoBack) > Sum(negZeroAndOne,barsGoBack) and Sum(negtwoAndThree, barsGoBack) > Sum(negOneAndTwo,barsGoBack){
cloud1 = negTwo;
cloud2 = negThree;
}
else {
cloud1 = Double.nan;
cloud2 = Double.nan;
}
AddCloud(cloud1, cloud2, color.light_red, color.light_green);
Code if you would like to add alerts every time the V-Score triggered a bullish or bearish entry is included below:
input soundAlertsOn = yes; Alert((cloud1 == one or cloud2 == one or cloud1 == two or cloud2 == two or cloud1 == three or cloud2 == three) and (VScore <= 0 and VScore[1] > 0) and (SoundAlertsOn), "Bullish VScore Entry", Alert.BAR); Alert((cloud1 == negOne or cloud2 == negone or cloud1 == negtwo or cloud2 == negtwo or cloud1 == negthree or cloud2 == negthree) and (VScore >= 0 and VScore[1] < 0)and (SoundAlertsOn), "Bearish VScore Entry", Alert.BAR);
Build the Upper VScore Indicator (thinkscript):
Next, we’ll move on to building an Upper VScore indicator, leveraging much of the code from above. The key difference between the two lines in how they plot on our charts (and thus, formatting code).
Here is the complete upper study’s thinkScript code:
declare upper;
input anchorDate = 20210101;
input barsGoBack = 30;


def postAnchorDate = if GetYYYYMMDD() >= anchorDate then 1 else 0;


def yyyyMmDd = getYyyyMmDd();
def periodIndx = if getAggregationPeriod() < AggregationPeriod.HOUR then yyyyMMDD else postAnchorDate;
def isPeriodRolled = compoundValue(1, periodIndx != periodIndx[1], yes);

def volumeSum;
def volumeVwapSum;
def volumeVwap2Sum;

if (isPeriodRolled) {
volumeSum = volume;
volumeVwapSum = volume * vwap;
volumeVwap2Sum = volume * Sqr(vwap);
} else {
volumeSum = compoundValue(1, volumeSum[1] + volume, volume);
volumeVwapSum = compoundValue(1, volumeVwapSum[1] + volume * vwap, volume * vwap);
volumeVwap2Sum = compoundValue(1, volumeVwap2Sum[1] + volume * Sqr(vwap), volume * Sqr(vwap));
}
def price = volumeVwapSum / volumeSum;
def deviation = Sqrt(Max(volumeVwap2Sum / volumeSum - Sqr(price), 0));

def VScore = if (((price - close)*(-1))/deviation) > 5 or (((price - close)*(-1))/deviation) < -5 then 0 else (((price - close)*(-1))/(deviation));
plot zero = (0)*(deviation) + (price);
plot one = (1)*(deviation) + (price);
plot two = (2)*(deviation) + (price);
plot three = (3)*(deviation) + (price);
plot negOne = (-1)*(deviation) + (price);
plot negTwo = (-2)*(deviation) + (price);
plot negThree = (-3)*(deviation) + (price);

zero.setDefaultColor(Color.White);
zero.setLineWeight(3);
one.setDefaultColor(Color.Light_Gray);
negOne.setDefaultColor(Color.Light_Gray);
two.setDefaultColor(Color.Light_Green);
negTwo.setDefaultColor(Color.Light_Red);
three.setDefaultColor(Color.Green);
negThree.setDefaultColor(Color.Red);

def zeroAndOne = if VScore > zero and VScore <= one then 1 else 0;
def oneAndTwo = if VScore > one and VScore <= two then 1 else 0;
def twoAndThree = if VScore > two and VScore <= three then 1 else 0;

def negZeroAndOne = if VScore > negOne and VScore < zero then 1 else 0;
def negOneAndTwo = if VScore > negTwo and VScore <= negOne then 1 else 0;
def negTwoAndThree = if VScore > negThree and VScore <= negTwo then 1 else 0;

def counter = if VScore >= 0 then 1 else if VScore < 0 then -1 else 0;
def trend = Sum(counter, barsGoBack);
def positiveTrend = if trend >= 0 then 1 else 0;
def negativeTrend = if trend < 0 then 1 else 0;

plot BullSignal = if positiveTrend and (VScore <= 0.3 and Vscore[1] >0) and CCI() > -100 then 1 else 0;

plot BearSignal = if negativeTrend and (VScore >= 0.3 and Vscore[1] < 0) and CCI() < 100 then 1 else 0;

BullSignal.SetPaintingStrategy(PaintingStrategy.Boolean_Arrow_UP);
BearSignal.SetPaintingStrategy(PaintingStrategy.Boolean_Arrow_DOWN);
BullSignal.SetLineWeight(3);
BearSignal.SetLineWeight(3);

input soundAlertsOn = no;
Alert(positiveTrend and (VScore <= 0 and VScore[1] > 0) and (SoundAlertsOn), "Bullish VScore Entry", Alert.BAR);
Alert(negativeTrend and (VScore >= 0 and VScore[1] < 0)and (SoundAlertsOn), "Bearish VScore Entry", Alert.BAR);
VScore Trading Setup Rules: Fades with the VScore
Rules:
- Price must hit either the upper or lower Volatility Box zones
- For Futures: the zone is defined as in between the cyan entry line and outer edge of the clouds
- For Stocks: the zone is defined as the beginning of the clouds to the outer edge of the clouds
- VScore must retest a previous support or resistance level, above or below at least the 2 Standard Deviation levels
- Bonus: Oversold or overbought confirmation using the Edge Signals indicator
Entry:
- Option 1: Volatility Box zone, ranging from aggressive to conservative entries
- Option 2: VScore Standard Deviation price level for previous standard deviation
Target:
- Option 1: Volatility Box target line
- Option 2: VScore retest of subsequent standard deviation price values
Stop:
- Outside of Volatility Box clouds
VScore Trading Setup Rules: Trend Continuation
Rules:
- Checkpoint 1:
Using at least a 30 “bar go-back” period, the clouds must signal a clear trend:- If green, focus on bullish setups only
- If red, focus on bearish setups only
- Checkpoint 2:
Entry trigger, in the direction of the trend (example triggers below):- Slingshot Squeeze
- Squeeze Signals
- Edge Signals
- Acceleration Trend Switch via Market Pulse
- Simple Breakout Tool
- Bonus: Oversold or overbought confirmation using the Edge Signals indicator
Entry:
- Option 1: Closing price of the candle with the entry trigger (ie. Slingshot Squeeze fires today, and the closing price is the price used for trade entry)
- Option 2: If price is extended, use a pullback zone, such as a previous support on the VScore as the “ideal entry price” (or your favorite moving average / Market Pulse)
Target:
- Option 1: Wait for squeeze to fire and exit based on backtester results
- Option 2: VScore retest of previous resistance levels, using specific prices to set exit points
Stop:
- Option 1: VScore trend reversing into bearish territory
- Option 2: Break of previous support / resistance levels (using both price and/or VScore standard deviations)
VScore Indicator.ts
#TOS Indicators – Home of the Volatility Box

#VScore-Upper Study

#Full YouTube Tutorial: https://youtu.be/mAPEodczf-k

#

#**10/6/19 – Feature Added: Ability for Users to Set Custom Standard Deviation in Label Output


// ... 67 more lines ...The VScore indicator measures the Z-score distance between current price and anchored VWAP, showing how many standard deviations price is away from the volume-weighted average. Values above 0 indicate strength (trading above VWAP), below 0 indicate weakness (trading below VWAP), and the magnitude shows the statistical significance of the deviation.
The Upper VScore plots standard deviation levels directly on the price chart as horizontal lines, allowing you to see exact price levels for each deviation. The Lower VScore plots in a separate panel as an oscillator, making it easier to spot divergences and trend changes. Both calculate the same Z-score values but display them differently.
Use the anchorDate input parameter in YYYYMMDD format (e.g., 20210101 for January 1, 2021). The indicator automatically switches between intraday anchoring (daily) and longer-term anchoring (your specified date) based on the chart timeframe. For timeframes under 1 hour, it uses daily anchoring; for longer timeframes, it uses your custom anchor date.
The clouds show which standard deviation range the VScore spends most time in over the specified lookback period. Green clouds indicate bullish trending areas (price consistently above VWAP), red clouds indicate bearish trending areas (price consistently below VWAP). This helps identify the "winning" standard deviation level for trend analysis.
The VScore generates signals when price crosses back toward the mean (VWAP) after extended moves. Bullish signals occur when VScore crosses back above -0.3 in uptrending markets with CCI confirmation. Bearish signals occur when VScore crosses back below +0.3 in downtrending markets. These represent mean reversion opportunities.
Yes, the Lower VScore includes a feature to display custom standard deviation price levels. Use the devStop input to select predefined levels (1, 2, 3 standard deviations) or choose "Custom" and set your own value using customDev. The indicator displays the actual price level for your chosen standard deviation in the label.
VScore works excellently with the Volatility Box system for entries/exits, Edge Signals for overbought/oversold confirmation, and Squeeze indicators for momentum confirmation. Use VScore to identify statistical extremes, then combine with momentum indicators to time entries when price is likely to revert to the mean or continue trending.
The VScore provides mathematical precision in trading by measuring exact Z-score distance from anchored VWAP, giving you statistical probability of mean reversion. It combines multiple timeframe analysis, trend identification through color-coded clouds, and precise entry/exit levels based on standard deviations. This statistical approach helps identify high-probability setups that pure price-based indicators often miss.
Here are some resources that you may find useful: