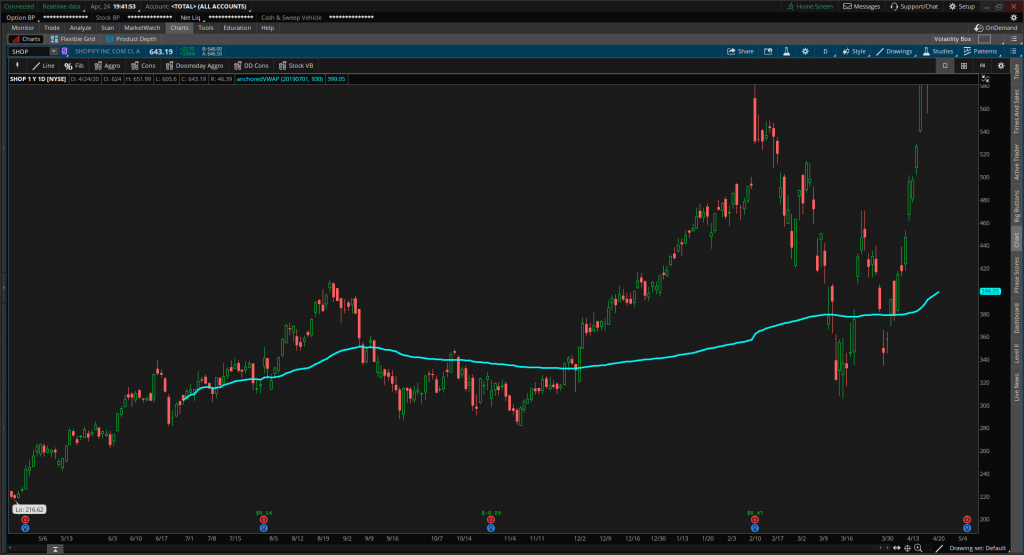
Anchored VWAP
Build a simple, yet effective Anchored VWAP indicator for ThinkOrSwim in less than 10 minutes using just a few lines of code.

Welcome to the first episode of “How to Thinkscript”.
We are TOSIndicators.com, home of the Volatility Box, the most robust ThinkOrSwim indicator based on statistical models built for large institutions and hedge funds.
Today, we’re going to walk you through how to build an Anchored VWAP indicator for ThinkOrSwim.
The Anchored VWAP is particularly useful if you’d like to anchor to either a specific time intra-day when price action reversed, their last earnings date, the Dec. 2018 lows, etc. Another common use case is the 2 day Anchored VWAP, which allows you to keep track of near-term data.
We also use the Anchored VWAP to build the V-Score indicator here, if you'd like to also watch that tutorial. The V-Score helps you to turn the Anchored VWAP indicator into a historical visual plot of price reversions back to the mean, through the eyes of standard deviation.
If that sounds complex, don't worry - we break it down for you here.
Volatility Box Invite
We are TOS Indicators.com, home of the Volatility Box.
The Volatility Box is our secret tool, to help us consistently profit from the market place. We’re a small team, and we spend hours every day, after the market close, doing nothing but studying thousands of data points to keep improving and perfecting the Volatility Box price ranges.
We have two different Volatility Boxes - a Futures Volatility Box and a Stock Volatility Box.
Futures Volatility Box - Trade Major Markets With an Edge
Designed For: Futures, Micro-Futures and Index Market Traders
Supported Models: Hourly Volatility Box models
Supported Markets: 10 Major Futures Markets
The Futures Volatility Box comes with:
- 5 Volatility Models for each market
- Support for 10 Futures Markets (/ES, /NQ, /YM, /RTY, /CL, /GC, /SI, /ZB, /HG, /NG)
- Video Setup Guide
- Trade Plan
- Access to all members-only resources, including Squeeze Course
Learn More About the Futures Volatility Box
Trade futures and micro futures with a consistent volatility edge
Stock Volatility Box - Powerful Web Based Volatility Platform
Designed For: Stock and Options Traders
Supported Models: Hourly and Daily Volatility Box models
Supported Markets: 10,000+ Stocks and ETFs (new markets added frequently)
A Stock Volatility Box membership includes access to:
- Live Scanner - A powerful scanner we've built from scratch, to scan 10,000 symbols every 2 seconds for new volatility breaches
- Dashboard - A quick and easy way to view daily volatility model levels online
- Short Interest Scanner - Short interest, Squeeze, and EMA data to find short squeezes
- Squeeze Course - All of our proprietary squeeze tools, including robust backtesters
- All Members Only Indicators - We don't nickel and dime you. Everything really is included.
- And much more!
Learn More About the Stock Volatility Box
Trade stocks and options with a consistent volatility edge
What is the Anchored VWAP Indicator?
The Anchored VWAP is an indicator which plots the volume weighted average price, after a particular anchor date and time.
Some potential examples of anchor dates include earnings announcements, major economic events, reversals and pivot points in the market place.
Building the Anchored VWAP Using ThinkOrSwim Code
Let’s start the process of building the Anchored VWAP for ThinkOrSwim.
First, we need to create a new study in ThinkOrSwim, which is another word for an indicator file.
Click the studies icon above the charts, and then click create.

Let’s give our study a unique name at the top. We'll call our study "TI_AnchoredVWAP"
Now we need to define the raw formula for the VWAP indicator, and here, we can use the built-in ThinkOrSwim VWAP study.
plot anchoredVWAP = TotalSum(if postAnchorDate and postAnchorTime then ((high+low+close)/3)*(volume) else 0)/TotalSum(if postAnchorDate and postAnchorTime then volume else 0);Now, let’s add in the anchor inputs for the anchor date and time.
input anchorDate = 20190612;
input anchorTime = 0930;
And keep in mind, all of the time stamps in thinkScript are in Eastern Standard Time format.
Now, we need to create a condition that tests if we have passed that anchor date and time in history.
def postAnchorDate = if GetYYYYMMDD()  >= anchorDate then 1 else 0;
def postAnchorTime = if SecondsFromTime(anchorTime) >= 0 then 1 else 0;
So let’s do a quick recap here.
In the first function for our Anchored VWAP, “postAnchorDate” checks to see whether or not we are after a particular date.
The second function, “postAnchorTime” repeats the same exercise, but using our inputted time.
We need to now intertwine those two functions into the Anchored VWAP code, to know to calculate the VWAP if and only if the two conditions are true.
Let’s update our Anchored VWAP indicator code:
plot anchoredVWAP = TotalSum(if postAnchorDate and postAnchorTime then ((high+low+close)/3)*(volume) else 0)/TotalSum(if postAnchorDate and postAnchorTime then volume else 0);And that’s it!
Formatting the Anchored VWAP Indicator
If you’d like to build in the formatting that we have in our tutorial into the indicator code, here is the thinkScript for formatting:
anchoredVWAP.setStyle(Curve.Firm);
anchoredVWAP.SetLineWeight(3);
anchoredVWAP.SetDefaultColor(Color.Cyan);
That results in the default Anchored VWAP indicator plot line always look like this:

Download the Anchored VWAP for ThinkOrSwim
That's the end of the tutorial. Hopefully through that, you learned how to very quickly, and easily, put together your own Anchored VWAP indicator for ThinkOrSwim.
If you'd like to see some examples of the indicator in action and being used, we do so towards the end of the tutorial video!
Here are some resources for other versions of the Anchored VWAP on other platforms
- Anchored VWAP TradingView
- VWAP Indicator MT4
- Multi Day VWAP ThinkOrSwim (Slightly hacked)
Click the button below to download our version of the Anchored VWAP Indicator for ThinkOrSwim
