
 Fair Value Gap
 False Breakout Scanner
 Heiken Ashi Trend
 Stock Volatility Box
 Futures Volatility Box
 ORB Setups
 Squeeze Setups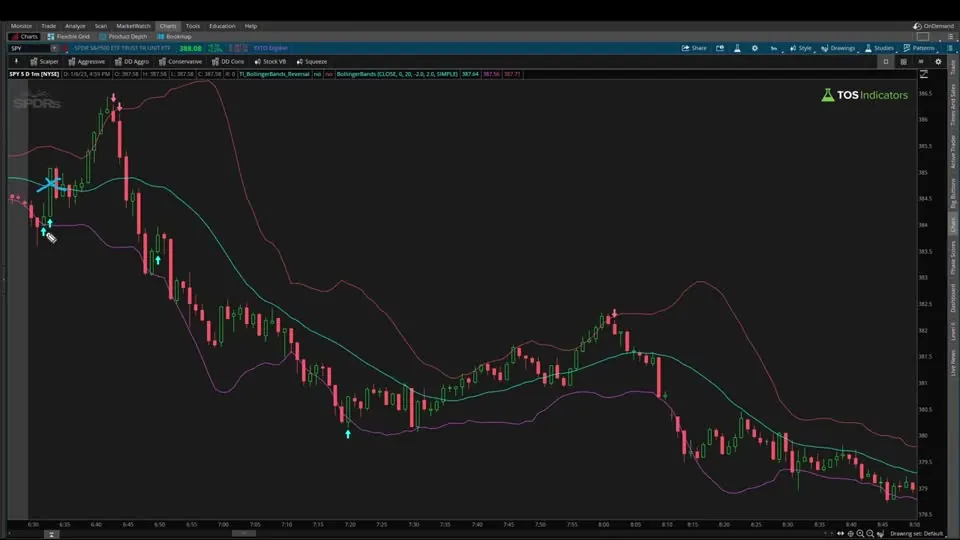
On this page
Overview
In this tutorial I build a Bollinger Bands reversal indicator for ThinkOrSwim from scratch. It plots a bullish arrow when a bar breaks below the lower band and the next bar closes above that bar's high, and a bearish arrow when the same thing happens in reverse at the upper band.
The setup is a reversion to the mean trade, and it's one of the most popular Bollinger Bands strategies. The code is beginner-friendly: 3 band variables, 6 conditions and 2 arrow plots. If you're new to thinkScript, it's also a good first lesson in how to reference the Bollinger Bands in your own code.
Key Takeaways
- The Bollinger Bands reversal indicator plots a bullish arrow when the previous bar's low was below the lower band and the current bar closes above the previous bar's high.
- The bearish arrow is the mirror image: the previous bar's high was above the upper band, and the current bar closes below the previous bar's low.
- A midline filter drops late signals. A bullish arrow needs the bar's high to stay below the middle band, and a bearish arrow needs the low to stay above it, so the move back to the mean is still ahead.
- The code reads ThinkOrSwim's built-in BollingerBands study. In the video it uses a 20-period simple moving average for the middle band and bands at plus and minus 2.0 standard deviations.
- The finished study is 15 lines of thinkScript, and the same code works on any timeframe. In the video I ran it on a 1-minute chart and a daily chart.
What Is the Bollinger Bands Reversal Setup?
The Bollinger Bands reversal setup is a mean reversion trade. Price breaks outside the upper or lower band, then reverses and heads back toward the middle line. It's one of the most popular Bollinger Bands strategies, and it's usually the first one traders hear about when they learn the indicator.
Bollinger Bands have 3 parts. The middle line is the mean, a simple moving average that defaults to 20 bars. The upper and lower bands sit a set number of standard deviations away from it, 2 by default, measured on the closing prices of the same 20 bars. When price breaks outside a band, it's outside that standard deviation threshold.
Here's the long-side example from the video. A red candle's low breaks below the lower band. The next green candle closes above that red candle's high, and that close is the reversal. From there, you're looking for price to travel back to the mean, the middle band.
The video mentions the stop only once, on this long example, where it goes outside the low of the candle you're using. It doesn't set a fixed stop rule beyond that.
The short side flips it. Price breaks above the upper band, and the first candle that closes below the previous candle's low is the reversal candle. That's where the indicator plots its bearish arrow.
The Rules Behind Each Arrow
The Bollinger Bands reversal indicator checks 2 requirements, one on the previous bar and one on the current bar. Later in the build I add a third check that filters out late signals. The table shows all three for each side.
| Check | Bullish arrow (bullSignal) | Bearish arrow (bearSignal) |
|---|---|---|
| Requirement 1, previous bar | Low below the lower band | High above the upper band |
| Requirement 2, current bar | Close above the previous bar's high | Close below the previous bar's low |
| Midline filter, current bar | High below the middle band | Low above the middle band |
| Conditions in the code | cond1, cond3, cond5 | cond2, cond4, cond6 |
| What it plots | Up arrow | Down arrow |
Requirement 1 looks back 1 bar because the bar outside the band is the setup. Requirement 2 is the trigger. A close above the previous high shows buying strength after a bar below the lower band, and a close below the previous low shows selling strength after a bar above the upper band.
Default Bollinger Bands Settings in ThinkOrSwim
The default Bollinger Bands settings in ThinkOrSwim are a 20-bar simple moving average of the close, with bands 2 standard deviations above and below it.
The built-in study is the source of every band value the indicator uses. In the video I load it next to the finished indicator, at what should be its default settings, so you can see how the arrows line up with the bands.
| Setting | Value in the video |
|---|---|
| Price | Close |
| Displace | 0 |
| Length | 20 |
| Average type | Simple moving average |
| Lower band | -2.0 standard deviations |
| Upper band | 2.0 standard deviations |
The study has 3 plots, which you can see when you double-click it to open its settings: the midline, which is the average, the lower band and the upper band. In the code they're MidLine, lowerBand and upperBand, and the finished indicator uses all three.
How to Build the Indicator in ThinkOrSwim
Building the Bollinger Bands reversal indicator takes one new study and the code below. If you'd rather import the finished file, skip to the download section at the end of this page.
- On a chart, click the Studies icon and choose Create to start a new study.
- Give it a name. I named mine TI_BollingerBands_Reversal, the same name the download uses.
- Delete the starter code in the editor so you start from a blank page.
- Type in the code one step at a time, as in the next section, or paste the full version from the Code tab.
- Click Apply and OK. Add the built-in Bollinger Bands study to the same chart so you can check each arrow against the bands.
The Code, Step by Step
The Bollinger Bands reversal code comes together in 5 steps: name the bands, write the 2 requirements for each side, plot the arrows, then add the midline filter. Every snippet matches the download except the first version of the plots in Step 4.
Step 1: Give Each Band a Name
This step’s code is free with an account. Create one or sign in.
The upper and lower bands are the main parts of this indicator, so they come first.
Giving each one its own variable makes the rest of the code easier to read and makes sure you reference the right line. BollingerBands() calls the built-in study, and the name after the dot picks the plot. Our increasing volume scan uses the same pattern to read the built-in VolumeAvg study.
Step 2: Requirement 1, a Bar Outside the Bands
This step’s code is free with an account. Create one or sign in.
cond1 is the long-side check: was the previous bar's low below the previous bar's lower band? cond2 is the short-side check: was the previous bar's high above the previous bar's upper band? The [1] after each name means 1 bar ago, so both sides of each comparison come from the same bar.
Step 3: Requirement 2, the Reversal Close
This step’s code is free with an account. Create one or sign in.
cond3 is true when the current bar closes above the previous bar's high, the bullish trigger. cond4 is true when the current bar closes below the previous bar's low, the bearish trigger. With these 6 lines, you have everything you need for the first version of the signals.
Step 4: Plot the Arrows
This step’s code is free with an account. Create one or sign in.
This first version, before the filter, comes from the video. The download has only the final version, shown in Step 5.
The signals use plot instead of def because you want to see them as arrows on the chart. bullSignal is true when cond1 and cond3 are both true, and the Boolean arrow up painting strategy draws an up arrow on that bar. bearSignal pairs cond2 with cond4 and draws a down arrow.
I set both line weights to 3 so the arrows are bigger. The weight scale runs from 1 to 5, so 3 sits in the middle.
Step 5: Filter Out Late Signals With the Midline
This step’s code is free with an account. Create one or sign in.
The first version printed an arrow on a bar that had already reached the middle band.
By then the reversion to the mean has happened and the opportunity is over, so I added the midline as a third band variable and one more condition for each side.
cond5 requires the bar's high to be below the midline for a bullish arrow. I first described it as the high not being greater than or equal to the midline, then wrote it as high < mid because it reads cleaner. cond6 requires the bar's low to be above the midline for a bearish arrow. While these hold, price still has room to move back to the mean.
Testing the Indicator on a Chart
The Bollinger Bands reversal indicator is easy to check by eye: load it next to the built-in Bollinger Bands study and look at the bars under each arrow. Your own study has no lock next to its scroll icon, which is how you tell it apart from a built-in study.
On the 1-minute chart in the video, the first version plotted 2 bullish arrows. Both bars met the rules, but on the second one price had already touched the midline, so the move back to the mean was over. After I added the midline filter and clicked Apply, that arrow disappeared. Another arrow on the same chart stayed, because price still hadn't reached the mean there.
Then I switched the chart from 1-minute bars to daily bars. Bullish and bearish arrows kept plotting, because the indicator uses the Bollinger Bands of whatever timeframe the chart is on. Nothing in the code changes between timeframes.
How I Read the Arrows
A Bollinger Bands reversal arrow marks a bar where price stretched outside a band and then closed back past the previous bar's range. A bullish arrow suggests buying strength after a bar below the lower band. A bearish arrow suggests selling strength after a bar above the upper band. In both cases the trade idea is a move back to the middle band.
The setup gives you a target before you enter: the mean, the 20-period midline. Because of the midline filter, an arrow never prints on a bar that has already reached the mean. For the stop, the video only says it goes outside the low of the candle you're using on the long example, with no fixed rule for the short side.
Treat each arrow as a setup to check on the chart before you trade it. The video doesn't include a backtest, so it shows no win rate for these signals. Decide where the stop goes before you enter, and size the position so a stop-out costs a small, fixed share of your account.
For a related idea on a different chart, our research article on Bollinger Band reversals on the VIX to trade SPY watches for the VIX to close above its upper band and then close back below it, as a long setup for SPY.
Ways to Build on the Indicator
The Bollinger Bands reversal indicator is a starting point. In the video I keep it to the 2 requirements and the midline filter, and from there you can layer on other indicators, tools or setups as extra conditions.
- Add an overbought or oversold read. Our comparison of 5 overbought and oversold indicators tests 5 confirmation signals against each other on the S&P 500. Any of them could become a seventh condition.
- Compare it with a Keltner read. Our Keltner Channel Wedges indicator marks closes outside Keltner Channels set to a 3.0 factor, another band-based way to flag stretched price.
- Try a different mean. Our Reversion to 50 Day SMA indicator builds a mean reversion study around the 50-day simple moving average.
- Change the band settings in the code.
BollingerBands()with empty parentheses reads the built-in study at its default inputs, so changing the Bollinger Bands settings on your chart doesn't move the arrows. To use other settings, pass them inside the parentheses, the way our Keltner code passesfactor = KCFactortoKeltnerChannels().
How to Import the Download
The Bollinger Bands reversal download is a .zip with one file, TI_BollingerBands_ReversalSTUDY.ts. It's the final code from the video, with the midline filter, and it matches the Code tab on this page.
- Download the .zip from this page and unzip it.
- Import the .ts file into ThinkOrSwim as a study. Our guide on how to import a study into ThinkOrSwim shows each step.
- Add the study to a chart along with the built-in Bollinger Bands, so you can see the bands behind each arrow.
You'll find more free studies like this one on our indicators page.
Bollinger Bands reversals on real charts
Drawn from real daily bars with the code on this page, through Oct 20, 2026. The bullish arrow needs three things on one bar: the bar before dipped below the lower band, this bar closed above that bar's high, and this bar's high is still under the middle band. I picked the most recent bullish arrow on a well-known name that was higher 10 trading days later, and the most recent that was not.
NKE, Oct 6, 2026: a reversal that followed through
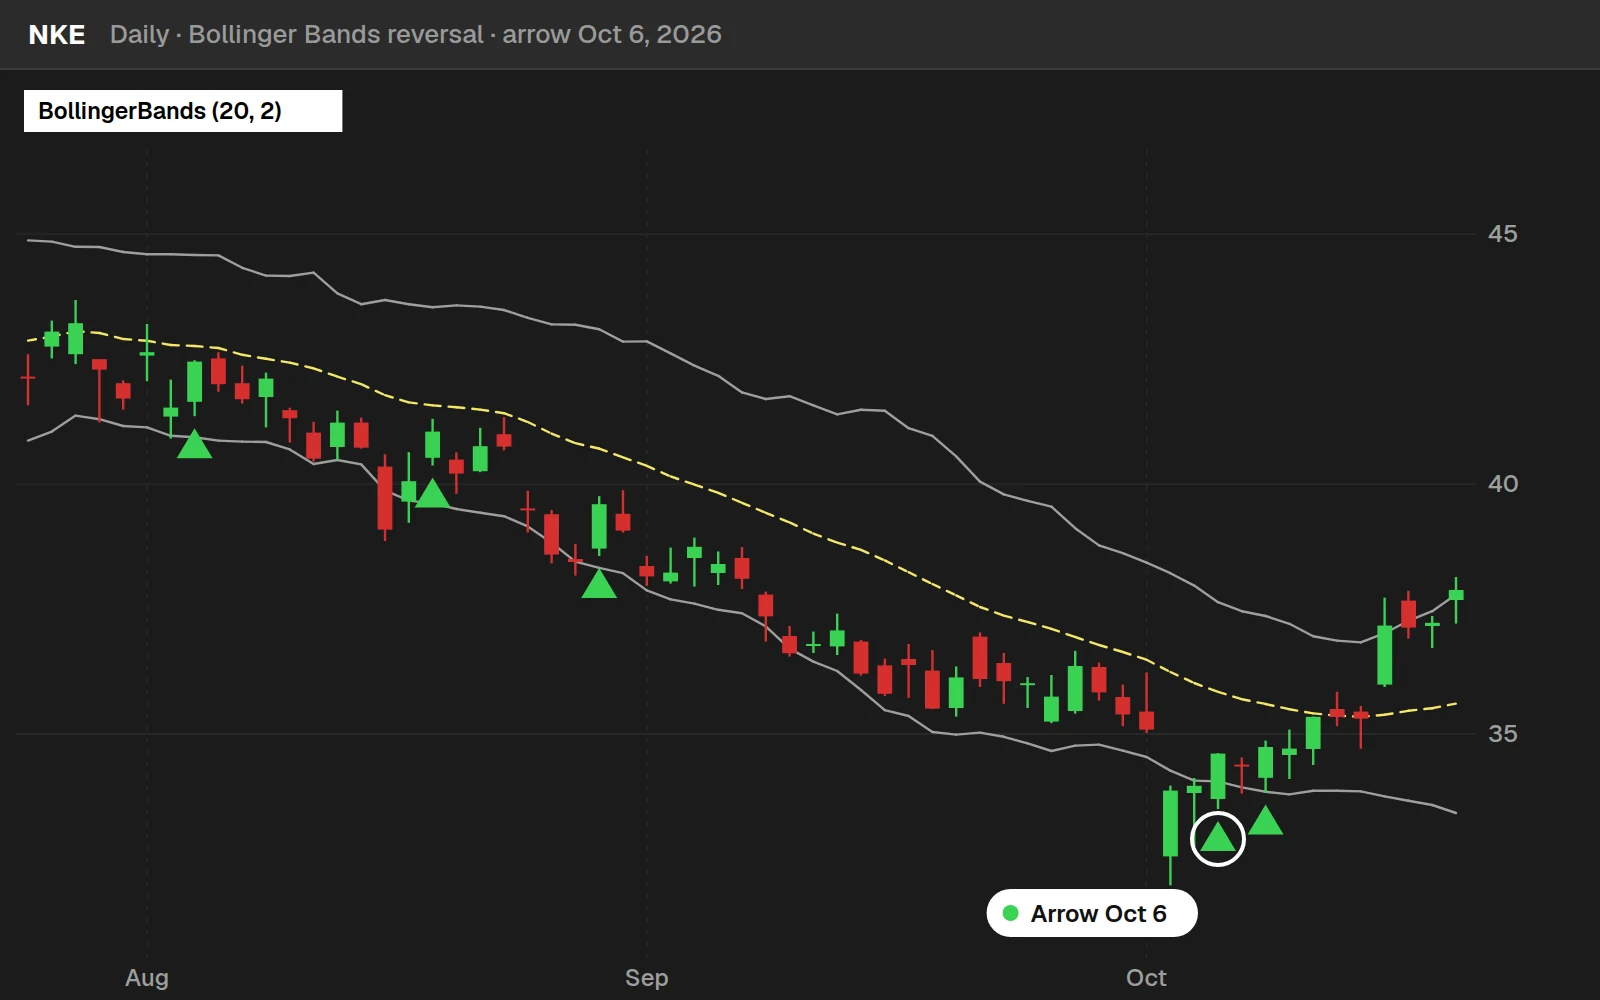
NKE closed at $34.61 on the arrow and at $37.88 ten trading days later, +9.4%.
XLF, Sep 25, 2026: one that did not
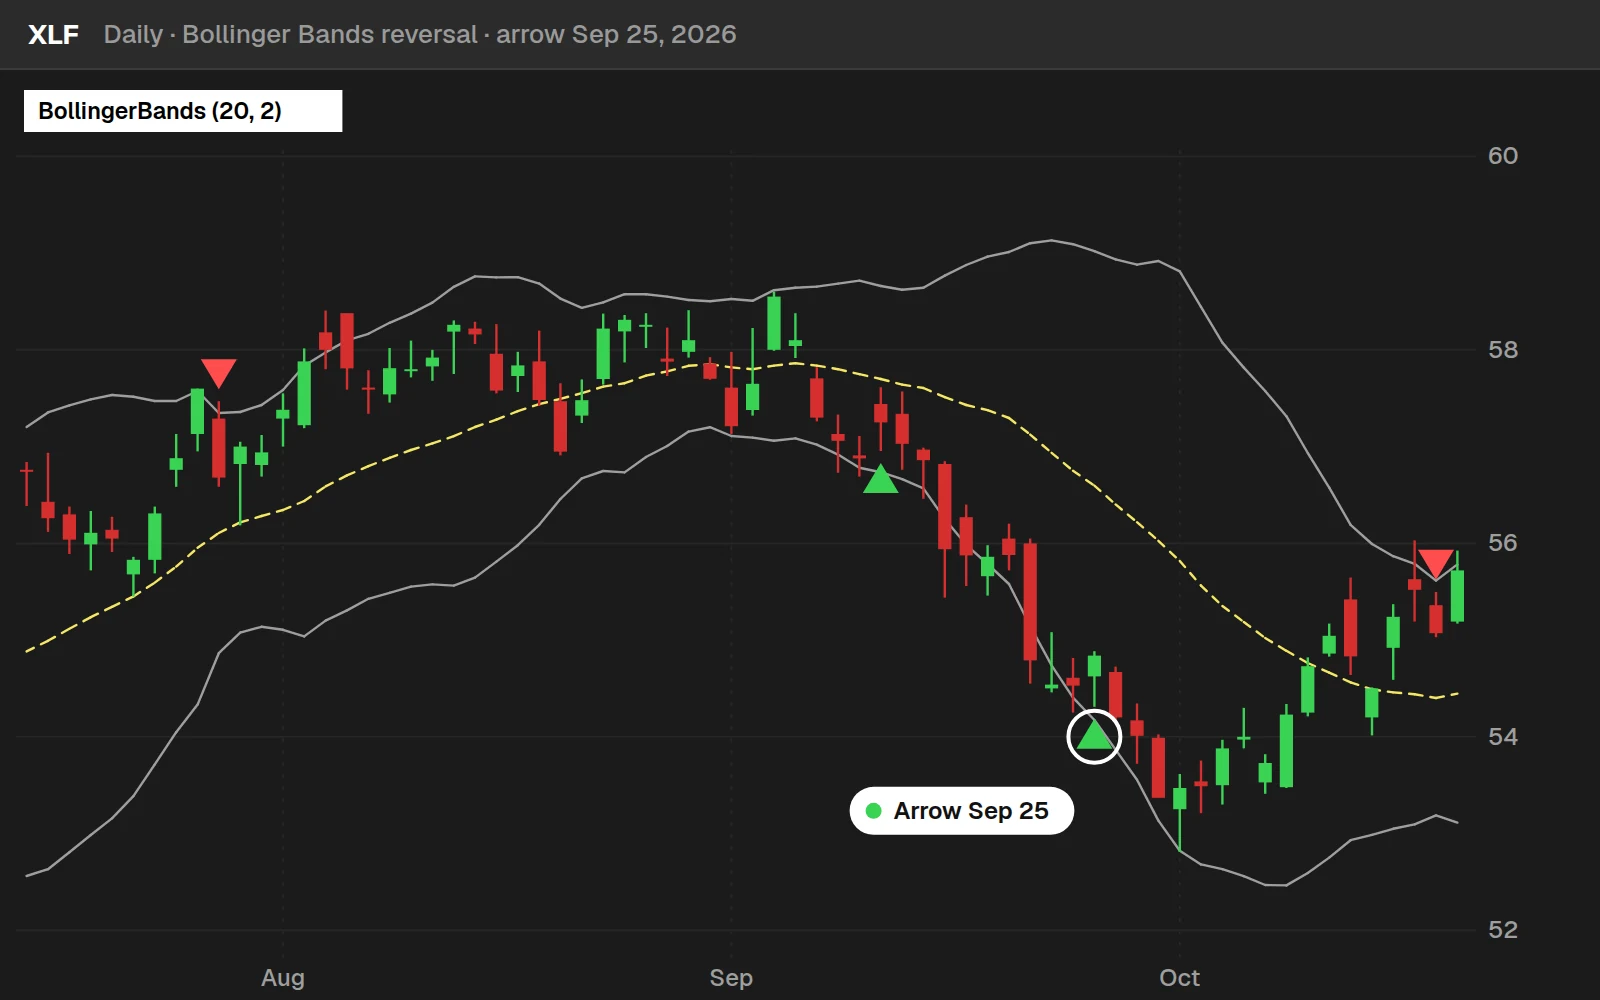
XLF closed at $54.84 on the arrow and at $54.73 ten trading days later, -0.2%. A close back inside the bands says the selling paused for a day; it does not say the low is in.
By the numbers
Daily bars for 648 stocks and ETFs through Oct 20, 2026: most stocks from July 2024, the 14 ETFs from 2016. The first arrow of each run, compared with every day in the same symbols over the same bars. Bearish arrows were followed by a lower close 10 days later 46.6% of the time.
Full thinkScript code
Create a free account or sign in to copy all 31 lines and download the file.
Download
Download the Bollinger Bands Reversal Indicator for ThinkOrSwim. The download is a .zip with one study file, TI_BollingerBands_ReversalSTUDY.ts. It's the final code from the video, with bullish and bearish arrows and the midline filter, the same code as the Code tab on this page. If you haven't added a custom study before, here's how to import an indicator into your ThinkOrSwim platform.
Questions
What is the Bollinger Bands reversal strategy?
It's a mean reversion setup. Price breaks outside the upper or lower Bollinger Band, then a reversal candle closes back past the previous candle's high or low, and you look for price to return to the middle band. It's one of the most popular Bollinger Bands strategies and usually the first one traders hear about.
What are the default Bollinger Bands settings in ThinkOrSwim?
In the video, the built-in Bollinger Bands study uses close as the price, a displace of 0, and a length of 20 with a simple moving average for the middle line. The lower and upper bands sit at -2.0 and 2.0 standard deviations. The reversal indicator reads the study at those default settings.
How do I add the Bollinger Bands reversal indicator to ThinkOrSwim?
Download the .zip from this page and import the TI_BollingerBands_ReversalSTUDY.ts file as a study. To build it by hand, click the Studies icon, choose Create, name the study, delete the starter code, paste in the code from the Code tab, then click Apply and OK.
When does the indicator plot a bullish arrow?
A bullish arrow needs 3 things. The previous bar's low was below the lower Bollinger Band, the current bar closes above the previous bar's high, and the current bar's high is still below the midline. The bearish arrow mirrors it at the upper band, with a close below the previous bar's low.
Why doesn't the indicator plot an arrow on every reversal?
The midline filter removes late signals. If a reversal bar's high has already reached the middle band on a long, or its low has reached it on a short, the reversion to the mean has happened and the opportunity is over. In the video, this filter removed an arrow on a bar that had already touched the mean.
How do I reference Bollinger Bands in thinkScript?
Call the built-in study by name and pick a plot after the dot. BollingerBands().lowerBand returns the lower band, BollingerBands().upperBand the upper band, and BollingerBands().MidLine the middle line. Giving each one its own variable with def keeps the rest of the code easy to read.
Does the Bollinger Bands reversal indicator work on daily charts?
Yes. The code uses the Bollinger Bands of whatever timeframe your chart is on. In the video I built it on a 1-minute chart, then switched to daily bars, and bullish and bearish arrows kept plotting. Nothing in the code needs to change between timeframes.
What are Bollinger Bands?
Bollinger Bands are 3 lines drawn around price. The middle line is a simple moving average, 20 bars by default in ThinkOrSwim, and the upper and lower bands sit 2 standard deviations of the close above and below it. When a bar trades outside a band, price is outside that standard deviation threshold, which is the stretch the reversal setup looks for.
Related tools
 Reversion to 50-Day Moving Average
 VScore
 V-Score Scans
 Super Bowl Indicator
 Average Volume Stats
 Stacked Moving Averages
Get each new indicator by email
One email on Sundays with the week's new tool and its code. A free account also unlocks every .txt download.
No credit card. Unsubscribe anytime.