Santa Claus Rally Backtester
Backtest how often Santa Claus Rally occurs in the S&P 500, and 10,000+ other stocks and ETFs.

Introduction
In this video, we will be exploring the concept of the Santa Claus Rally and building a backtester to see if it is a viable trading strategy.
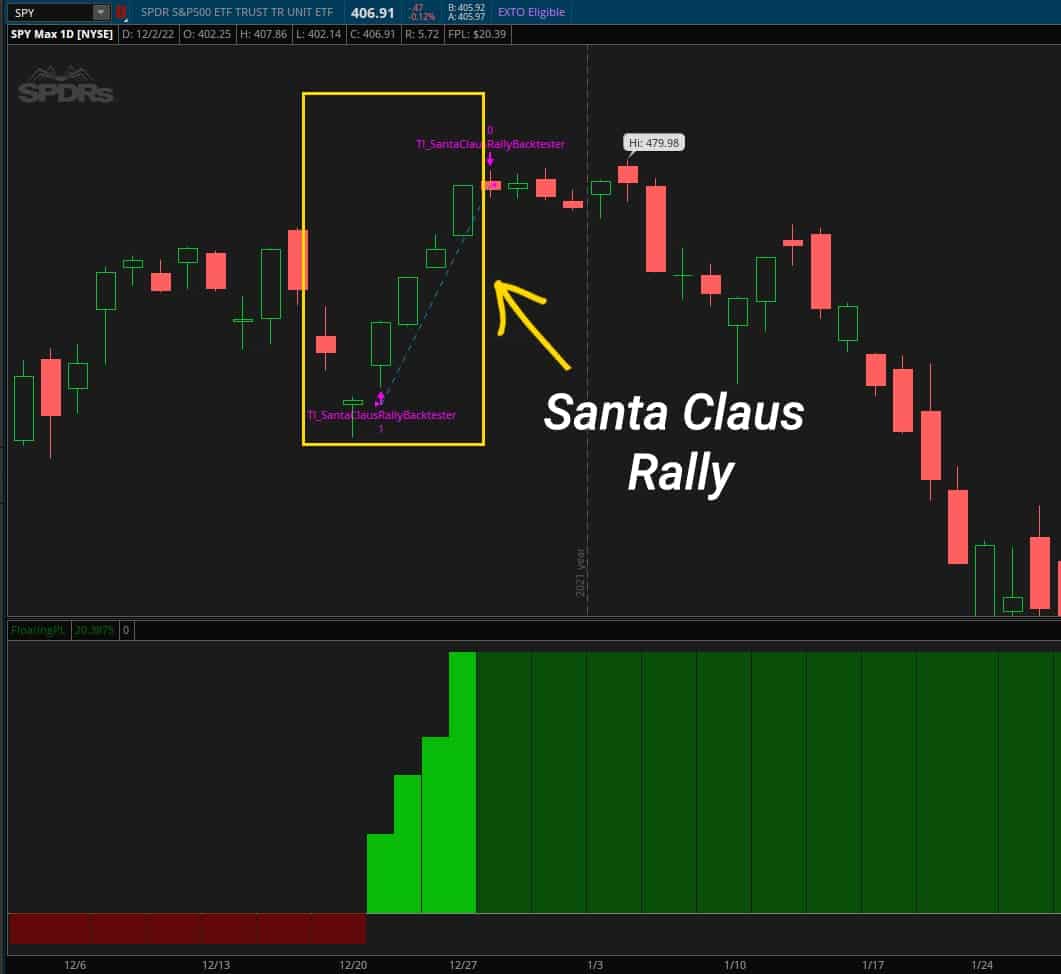
The Santa Claus Rally is a phenomenon that occurs in the stock market during the week leading up to Christmas, where prices tend to rise. Many traders have used this to their advantage, buying stocks before the Santa Claus Rally and selling them just before Christmas.
However, there is still some debate over whether this is a consistent trend or just a fluke.
Some key takeaways for the strategy, courtesy of Investopedia.
- The Santa Claus Rally occurs during the week leading up to Christmas (usually December 18th-24th)
- The strategy has had a small positive average return, suggesting a positive trade expectancy
- Traders often use the Santa Claus Rally as a buying opportunity, holding onto their stocks until just before Christmas
- The consistency and profitability of the Santa Claus Rally is still under debate and worth testing
Now that we have a better understanding of what the Santa Claus Rally is, we can start building a backtester to see how often it has occurred historically.
By building a backtester, we can test the Santa Claus Rally in different market conditions and see if it is a consistent trend or just a fluke.
This will give us a better idea of whether it is worth using as a trading strategy.
In the next section, we will walk through the process of building a Santa Claus Rally backtester in ThinkOrSwim.
Volatility Box Invite
We are TOS Indicators.com, home of the Volatility Box.
The Volatility Box is our secret tool, to help us consistently profit from the market place. We’re a small team, and we spend hours every day, after the market close, doing nothing but studying thousands of data points to keep improving and perfecting the Volatility Box price ranges.
We have two different Volatility Boxes - a Futures Volatility Box and a Stock Volatility Box.
Futures Volatility Box - Trade Major Markets With an Edge
Designed For: Futures, Micro-Futures and Index Market Traders
Supported Models: Hourly Volatility Box models
Supported Markets: 10 Major Futures Markets
The Futures Volatility Box comes with:
- 5 Volatility Models for each market
- Support for 10 Futures Markets (/ES, /NQ, /YM, /RTY, /CL, /GC, /SI, /ZB, /HG, /NG)
- Video Setup Guide
- Trade Plan
- Access to all members-only resources, including Squeeze Course
Learn More About the Futures Volatility Box
Trade futures and micro futures with a consistent volatility edge
Stock Volatility Box - Powerful Web Based Volatility Platform
Designed For: Stock and Options Traders
Supported Models: Hourly and Daily Volatility Box models
Supported Markets: 10,000+ Stocks and ETFs (new markets added frequently)
A Stock Volatility Box membership includes access to:
- Live Scanner - A powerful scanner we've built from scratch, to scan 10,000 symbols every 2 seconds for new volatility breaches
- Dashboard - A quick and easy way to view daily volatility model levels online
- Short Interest Scanner - Short interest, Squeeze, and EMA data to find short squeezes
- Squeeze Course - All of our proprietary squeeze tools, including robust backtesters
- All Members Only Indicators - We don't nickel and dime you. Everything really is included.
- And much more!
Learn More About the Stock Volatility Box
Trade stocks and options with a consistent volatility edge
How to Build a Santa Claus Rally Backtester in ThinkOrSwim
In this section, we will start building our Santa Claus Rally backtester in ThinkOrSwim.
This involves defining our entry and exit conditions, as well as creating the AddOrder functions to execute the trades. By building this backtester, we will be able to test the Santa Claus Rally in different market conditions and see if it is a consistent trend or just a fluke.
My hope is that this gives us a better idea (using data) as to whether it is worth using as a trading strategy.
Let’s get started by defining our entry and exit conditions in ThinkScript.
- Open ThinkOrSwim and click on the “Studies” icon in the top menu
- Click on the “Strategies” tab and then click “Create”
- Give your strategy a name, such as “TI_SantaClausRallyBacktester” and delete the default code in the editor
- Define your entry and exit conditions using the following lines of code:
def entry = getDayOfMonth(getYYYYMMDD()) > 17 and getMonth() == 12;
def exit = getDayOfMonth(getYYYYMMDD()) > 23 and getMonth() == 12;
- Add the following lines of code to create the AddOrder functions for your backtester:
AddOrder(OrderType.Buy_To_Open, entry and !entry[1], open, 1);
AddOrder(OrderType.Sell_To_Close, exit and !exit[1], close, 1);
- Click “Save” to save your backtester and run it on a stock or index to see the results.
Santa Claus Rally During Bear Markets?
Now that we have built our Santa Claus Rally backtester, we can apply it to a chart of the S&P 500 (SPY) to see how it performs. We will focus on bear markets in particular, testing the 2000 and 2008 bear markets, respectively.
My goal is to gain a better understanding of how the Santa Claus Rally performs in different market conditions, including bear markets.
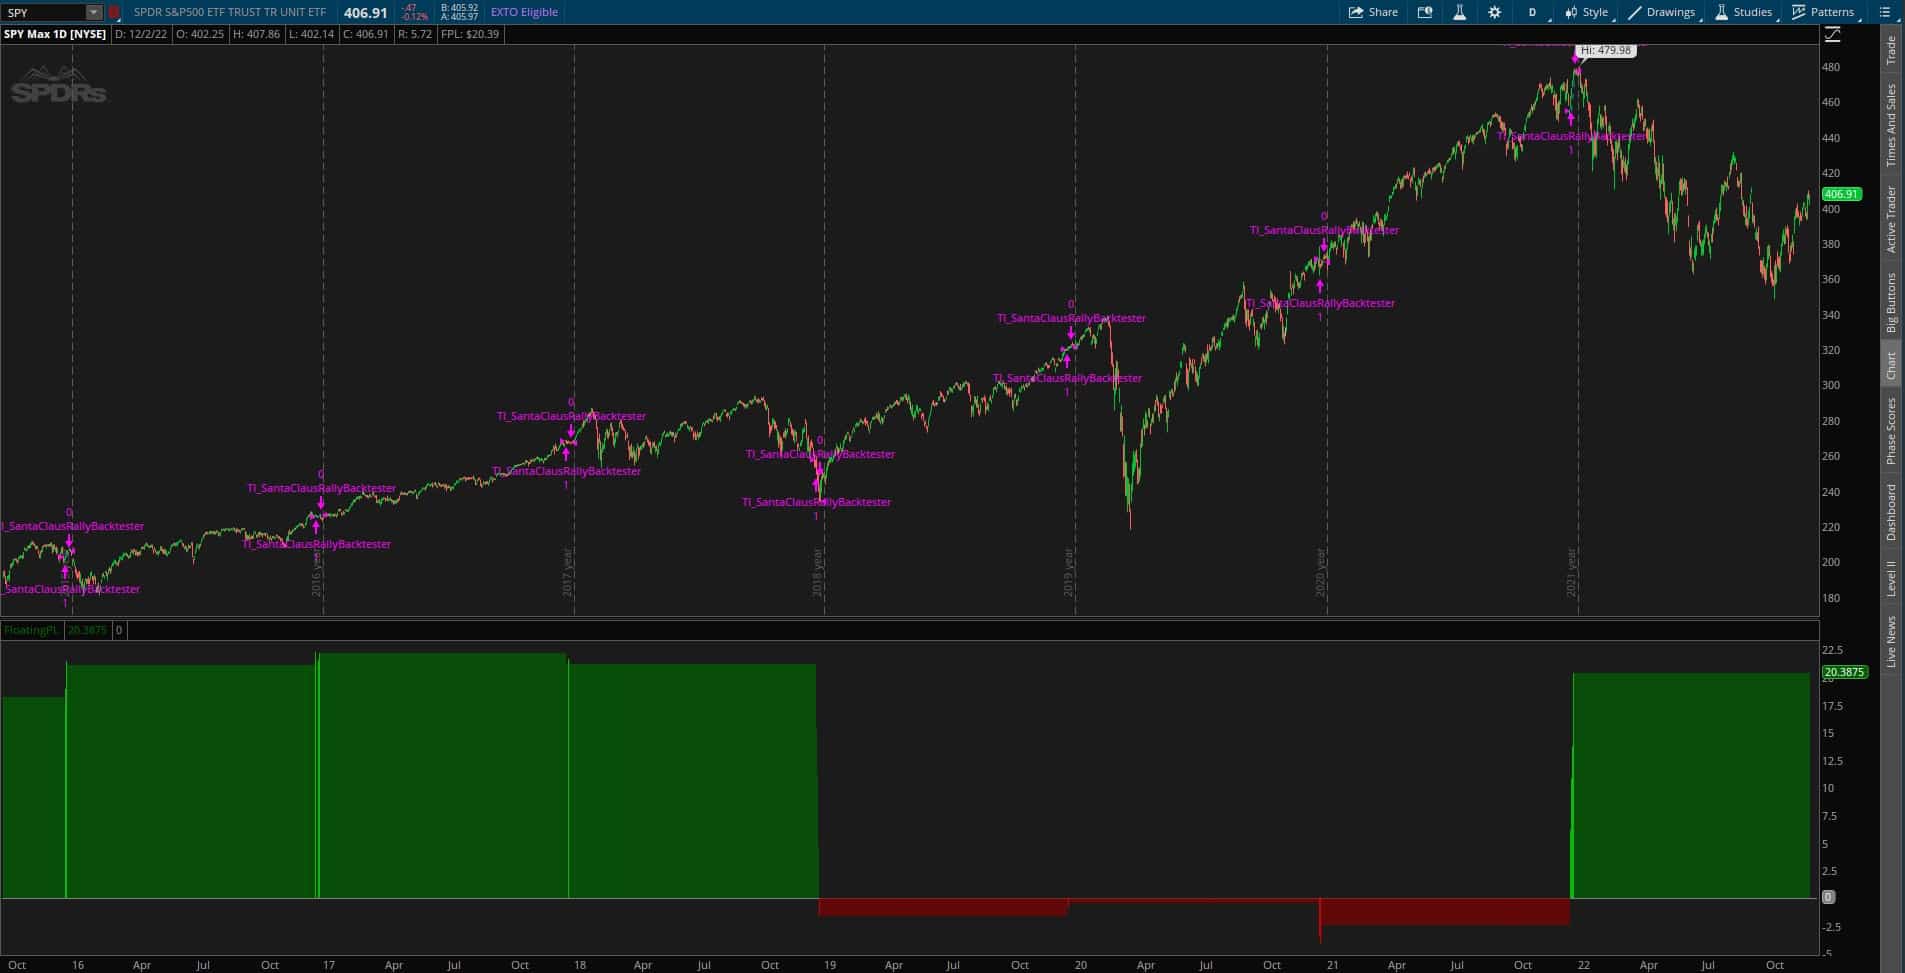
After applying the Santa Claus Rally backtester to the SPY, we can see the following results:
- 5 year: -$1.73
- 10 year: +$7.59
- 15 year: +$13.70
- 20 year: +$12.35
These results show that the Santa Claus Rally has had a small positive average return over the past 20 years. This suggests that there may be some truth to the idea that the Santa Claus Rally is a consistent trend.
When we look at the first three Decembers of the 2000-2002 bear market, we can see that the Santa Claus Rally performed well during those periods.
- In December 2000, the backtester showed a gain of +$0.28, implying an increase in SPY stock price.
- In December 2001, the backtester showed a gain of +$0.10, implying a smaller increase, but still positive increase in SPY stock price
- And in December 2002, the backtester showed a loss of -$0.97.
This suggests that the Santa Claus Rally can still be profitable even in bear markets, given the 2/3 “winning” December months for the strategy.
However, when you include 2008 findings and data, I believe a different story.
- In December 2008, during the height of the financial crisis, the Santa Claus Rally backtester showed a fairly “large” relative loss of -$4.74.
Our net P/L for the Santa Claus Rally trading strategy, during bear markets, is -$5.33.
This indicates that the Santa Claus Rally may not be as consistent as some traders believe, and may not always be a profitable strategy. It is important for traders to carefully consider their market conditions and risk tolerance before using the Santa Claus Rally as a trading strategy.
Conclusion
In conclusion, the Santa Claus Rally is a phenomenon that occurs in the stock market during the week leading up to Christmas, where prices tend to rise.
By building a backtester in ThinkOrSwim, we can test the Santa Claus Rally in different market conditions and see if it is a consistent tendency, or a one-time fluke. Our results show that the Santa Claus Rally has had a small positive average return over the past 20 years, but it is not an ideal strategy during bear markets.
I hope you found this short tutorial to be a useful introduction, in building simple backtesters to answer complex questions.
downloads
Download the Santa Claus Rally Backtester for ThinkorSwim.
The download contains a STRATEGY.ts file, which you can directly import into your ThinkOrSwim platform.
Download Backtester
Download the Santa Claus Rally Backtester for ThinkorSwim.
The download contains a STRATEGY.ts file, which you can directly import into your ThinkOrSwim platform.


