Table of Contents
- Step 1: Setting Up the Basic Inputs
- Step 2: Calculating Volume for the First Symbol
- Step 3: Creating the Plot Conditions
- Step 4: Adding Chart Bubbles for Symbol Identification
- Step 5: Replicating for the Remaining Symbols
- Step 6: Adding Baseline and Reference Lines
- Step 7: Running and Testing the Indicator
- Step 8: Customizing the Indicator
- Conclusion
Introduction
In this tutorial, you’ll learn to build a simple but effective Volume Intensity Indicator for ThinkOrSwim.
This indicator compares the volume of five selected symbols, highlighting trade opportunities when volume changes significantly.
We’ll create a special “volume intensity” ratio, which shows you exactly where each stock’s volume diverges significantly from its average.
And this will be the magic sauce that we build for all 5 symbols.
thinkScript Tutorial Overview
This indicator quickly reveals changes in volume strength, letting you visually confirm market activity and pinpoint entry and exit points. By comparing volume across multiple stocks, you can identify momentum shifts, potential reversals, and breakout setups.
Another reason this particular tutorial is useful is because we will be using the free version of ChatGPT to help us build this ThinkOrSwim indicator. We will layer on the initial logic for the first symbol, and then ask ChatGPT to do some of the heavy lifting for us and clone the code for the remaining process.
Step 1: Setting Up the Basic Inputs
We begin by defining the main inputs, including the volume calculation length and the five symbols you want to track. This makes it easy to customize which stocks the indicator will analyze.
declare lower;
input length = 20;
input symbol1 = "AAPL";
input symbol2 = "MSFT";
input symbol3 = "META";
input symbol4 = "GOOGL";
input symbol5 = "NVDA";
Explanation: The declare lower command ensures that this indicator appears in the lower panel of ThinkOrSwim, separate from the price chart. Here, we set a length of 20 periods to average volume and define the five symbols we want to monitor. The user can adjust these symbols and length values as needed.
Step 2: Calculating Volume for the First Symbol
Now, let’s calculate the volume data for the first symbol, using Apple (AAPL) as an example. We’ll pull in volume data and calculate its average, which will act as a baseline for comparison.
def vol1 = volume(symbol = symbol1);
def volAvg1 = Average(vol1, length);
def intensity1 = vol1 / volAvg1;
Explanation: vol1 fetches the current volume for AAPL, while volAvg1 calculates its average over the last 20 periods (or whichever length you chose). The intensity variable, intensity1, provides the ratio between today’s volume and the average, making it easy to spot spikes or drops.
Step 3: Creating the Plot Conditions
With the intensity ratio calculated, let’s create conditions to color-code the intensity of volume changes and plot this for AAPL.
plot volCondition1 = if !IsNaN(close) then 5 else Double.NaN;
volCondition1.SetPaintingStrategy(PaintingStrategy.POINTS);
volCondition1.SetLineWeight(3);
volCondition1.AssignValueColor(
    if intensity1 > 2 then Color.LIGHT_GREEN else
    if intensity1 > 1.5 then Color.GREEN else
    if intensity1 > 1 then Color.DARK_GREEN else
    if intensity1 > 0.75 then Color.DARK_RED else
    if intensity1 > 0.5 then Color.RED else Color.LIGHT_RED
);
Explanation: We assign colors to represent different intensity levels, making it easy to spot volume spikes visually. The AssignValueColor method changes the plot’s color based on intensity, with green indicating higher-than-average volume and red for lower-than-average volume.
Step 4: Adding Chart Bubbles for Symbol Identification
To keep track of which row corresponds to which symbol, let’s add chart bubbles labeled with the symbol’s ticker.
AddChartBubble(close > 0 and IsNaN(close[-1]), 5, symbol1,
    if intensity1 > 2 then Color.LIGHT_GREEN else
    if intensity1 > 1.5 then Color.GREEN else
    if intensity1 > 1 then Color.DARK_GREEN else
    if intensity1 > 0.75 then Color.DARK_RED else
    if intensity1 > 0.5 then Color.RED else Color.LIGHT_RED
);
Explanation: This bubble appears only on the last valid bar, showing the ticker symbol of the first stock (AAPL). The color matches the intensity color coding, providing an additional visual cue for easy reference.
Step 5: Replicating for the Remaining Symbols
Now that we’ve set up the conditions and plot for AAPL, we can repeat these steps for the other four symbols. Each symbol will get its own volume, average, and intensity calculations, along with color-coded plots and bubbles.
def vol2 = volume(symbol = symbol2);
def volAvg2 = Average(vol2, length);
def intensity2 = vol2 / volAvg2;

plot volCondition2 = if !IsNaN(close) then 4 else Double.NaN;
volCondition2.SetPaintingStrategy(PaintingStrategy.POINTS);
volCondition2.SetLineWeight(3);
volCondition2.AssignValueColor(
    if intensity2 > 2 then Color.LIGHT_GREEN else
    if intensity2 > 1.5 then Color.GREEN else
    if intensity2 > 1 then Color.DARK_GREEN else
    if intensity2 > 0.75 then Color.DARK_RED else
    if intensity2 > 0.5 then Color.RED else Color.LIGHT_RED
);

AddChartBubble(close > 0 and IsNaN(close[-1]), 4, symbol2,
    if intensity2 > 2 then Color.LIGHT_GREEN else
    if intensity2 > 1.5 then Color.GREEN else
    if intensity2 > 1 then Color.DARK_GREEN else
    if intensity2 > 0.75 then Color.DARK_RED else
    if intensity2 > 0.5 then Color.RED else Color.LIGHT_RED
);
Note: Repeat the process for symbol3, symbol4, and symbol5, adjusting the values and plot lines as needed.
Step 6: Adding Baseline and Reference Lines
To keep the chart organized, we’ll add two baseline lines. These lines help visually frame the indicator’s range on the lower panel, keeping everything clean and readable.
plot zero = 0;
zero.SetDefaultColor(Color.BLACK);

plot six = 6;
six.SetDefaultColor(Color.BLACK);
Explanation: These lines create boundaries for the indicator, helping you visually separate each symbol’s plot row. The zero line sits at the bottom, while the six line sits at the top.
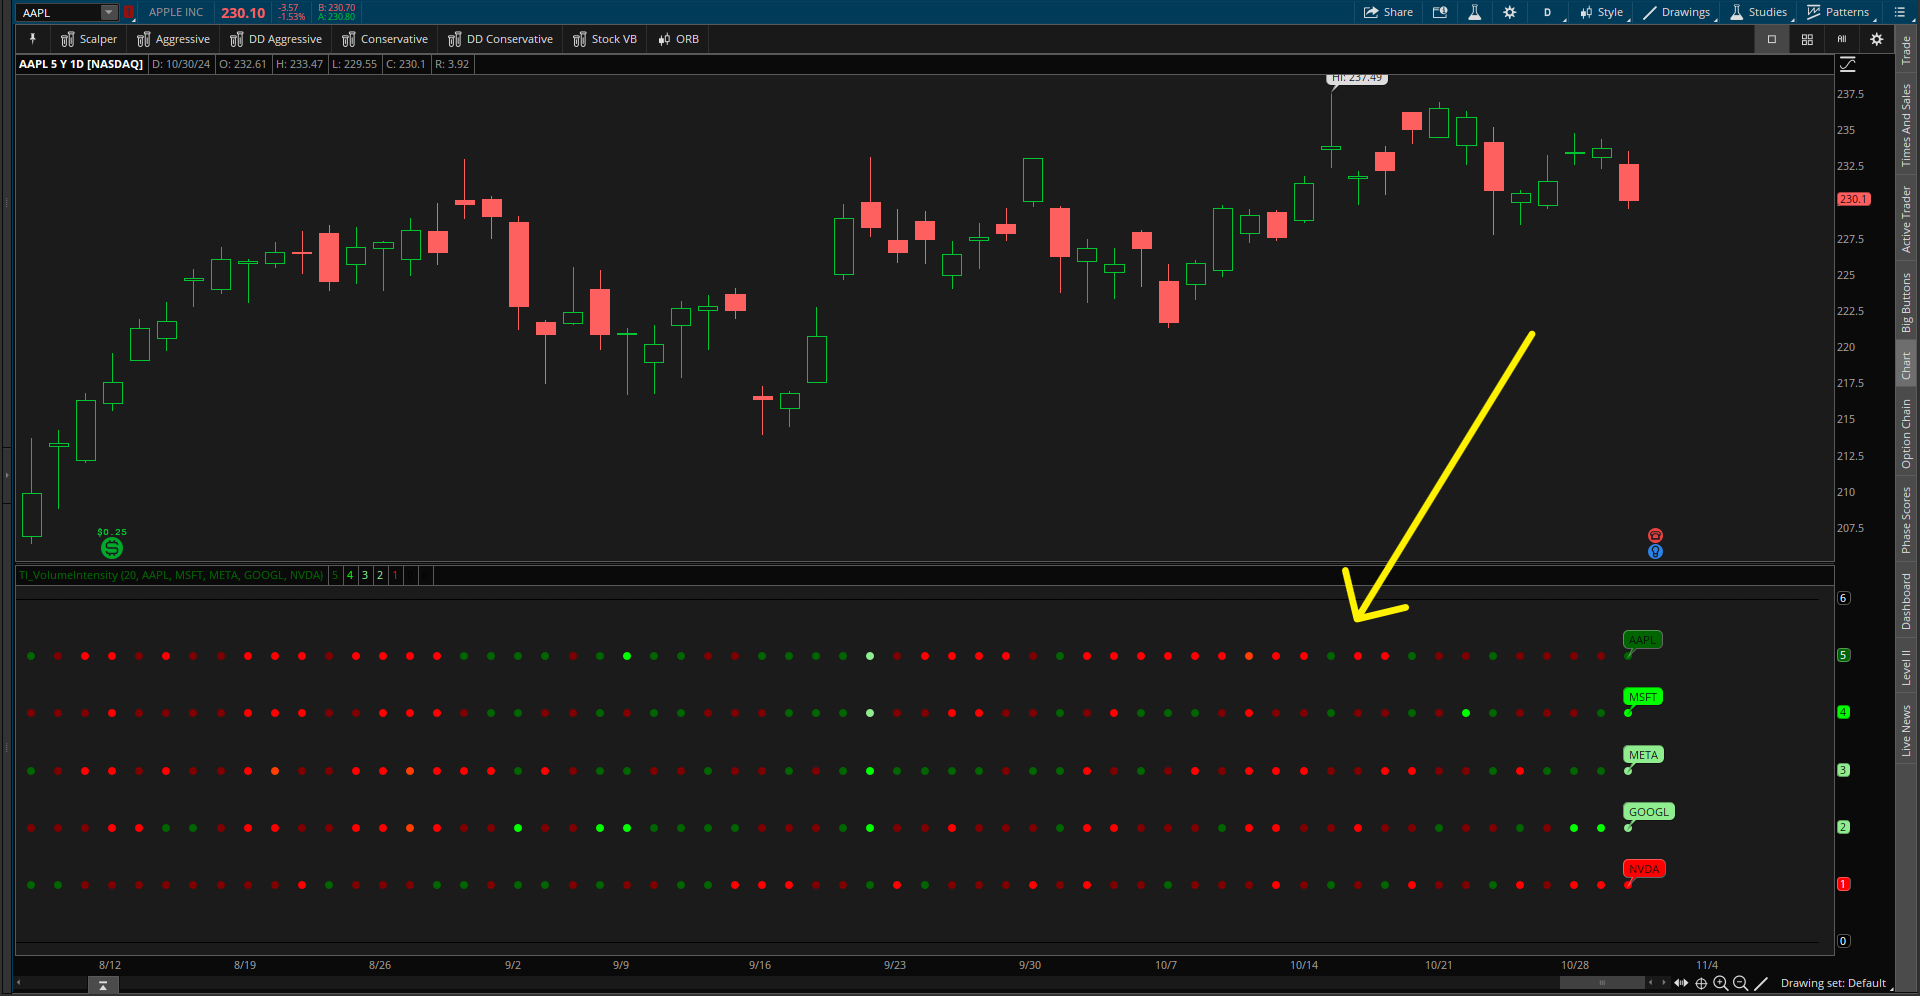
Step 7: Running and Testing the Indicator
Once you’ve added the code for all symbols, apply it and test the indicator. Experiment with different length values and symbols to see how it behaves with various stocks and time frames.
Step 8: Customizing the Indicator
To fine-tune the indicator, try adjusting the following:
- Length: Change the
lengthvalue for a more responsive or smoother volume average. - Color Thresholds: Modify the
AssignValueColorthresholds to make color shifts more aggressive or subdued. - Symbols: Swap out the current symbols to track different stocks.
Conclusion
You’ve now created a Volume Intensity Indicator that highlights volume changes across multiple symbols, helping you spot key trading opportunities based on volume. This tool can be a valuable addition to your ThinkOrSwim setup.
Volume Intensity Indicator.ts
# Volume Intensity Indicator for ThinkOrSwim (Built with ChatGPT)

# Use AI assistance for multi-symbol volume tracking and intensity analysis

# Full tutorial: tosindicators.com/indicators/volume-intensity

# Declare lower panel placement

declare lower;


// ... 241 more lines ...Volume intensity measures how current trading volume compares to historical average volume for a specific stock, creating a ratio where 1.0 equals normal volume. Unlike raw volume numbers, volume intensity normalizes data across different stocks - a biotech with 500K shares (5x normal) shows higher intensity than Apple with 100M shares (1.2x normal). This makes volume intensity crucial for comparing activity levels across your entire watchlist.
Calculate volume intensity using the formula: current volume divided by average volume over a specified period. In ThinkScript: def intensity = volume / Average(volume, length) where length is your lookback period (typically 20-50 days). Values above 2.0 indicate high volume intensity, while below 0.5 suggests unusually quiet periods. This ratio system works regardless of the stock's typical trading volume.
Effective volume intensity thresholds depend on your trading style: For breakout trading, use 2.0+ for high-conviction signals and 1.5+ for moderate signals. For mean reversion, look for readings below 0.5 indicating exhaustion. Day traders often use lower thresholds (1.5+) for sensitivity, while swing traders prefer higher thresholds (2.5+) to filter noise. Adjust based on your symbols' typical volatility patterns.
Volume intensity analysis improves dramatically when viewed across multiple timeframes. Daily volume intensity shows institutional activity, while hourly intensity reveals intraday momentum shifts. Look for volume intensity alignment: when both daily and hourly readings exceed 2.0, it suggests strong conviction. Divergences between timeframes often signal potential reversals or weakening trends in volume intensity patterns.
Volume intensity divergences occur when price makes new highs/lows but volume intensity fails to confirm. Watch for decreasing volume intensity on successive price peaks - this suggests weakening buying pressure despite higher prices. Similarly, increasing volume intensity during price declines may indicate accumulation. These volume intensity divergences often precede trend reversals and provide early warning signals.
Volume intensity directly impacts position sizing decisions. High volume intensity (2.0+) periods suggest increased volatility, warranting smaller position sizes and tighter stops. Normal volume intensity (0.8-1.5) allows standard position sizing. During low volume intensity periods (below 0.5), consider reducing exposure as moves may lack conviction. This volume intensity-based approach helps manage risk by adjusting to market participation levels.
Yes, ChatGPT excels at expanding volume intensity indicator code for multiple symbols. After creating logic for one symbol, prompt ChatGPT: "Replicate this volume intensity calculation for 4 more symbols, changing variable names from 'vol1/intensity1' to 'vol2/intensity2' etc." ChatGPT can also help modify thresholds, add alerts, or create variations for different trading timeframes, significantly accelerating volume intensity indicator development.
Create volume intensity scans using ThinkOrSwim's Stock Hacker with custom ThinkScript. Use the condition: volume / Average(volume, 50) > 2 to find stocks with volume intensity above 2.0. Add filters for price range, market cap, and minimum volume to refine results. Combine with technical conditions like price near resistance or moving average breaks to identify high-probability volume intensity setups for trading.
Here are some resources that you may find useful: