
Best Volume Indicators for ThinkorSwim: Relative Volume, VWAP, and OBV
Compare Relative Volume, VWAP, and OBV on ThinkorSwim. Setup guides, ThinkScript code, and backtested RVOL thresholds for day and swing trading.

- Why Volume Analysis Matters for ThinkorSwim Traders
- What Is Relative Volume and How Does It Work?
- VWAP: The Institutional Benchmark Indicator
- On Balance Volume: Tracking Cumulative Buying Pressure
- Combining Volume Indicators for Higher-Probability Setups
- Additional Volume Indicators Worth Exploring
- Common Mistakes When Using Volume Indicators
- Practical Workflow for Volume Analysis
- Connecting Volume Analysis to Volatility Models
- Frequently Asked Questions
- Key Takeaways
Volume is the fuel behind every price move. Without it, breakouts fail, trends stall, and reversals lack conviction. The best volume indicator for ThinkorSwim depends on what you need to measure: relative strength versus historical averages, institutional positioning around key price levels, or cumulative buying and selling pressure over time.
This guide breaks down the three most effective volume indicators available on ThinkorSwim: Relative Volume, VWAP, and On Balance Volume (OBV). We will cover how each one works, when to use it, and how to combine them for higher-probability setups.
Why Volume Analysis Matters for ThinkorSwim Traders
Volume confirms what price suggests. A stock breaking above resistance on 3x average volume has a statistically higher chance of following through than one breaking out on below-average activity. This principle applies across all timeframes and instruments.
ThinkorSwim provides built-in volume studies, but the default settings often fall short. Raw volume bars tell you how many shares traded, not whether that number is significant for the specific stock you are watching.
Relative volume solves this by comparing current activity to historical baselines. VWAP shows where institutions are positioned. OBV tracks cumulative flow to reveal accumulation or distribution before price confirms the move.
What Is Relative Volume and How Does It Work?
Relative Volume (RVOL) compares today's volume to the average volume over a specified lookback period. An RVOL reading of 2.0 means current volume is twice the historical average. An RVOL of 0.5 indicates volume is half the typical level.
The formula is straightforward: Current Volume divided by Average Volume over N periods equals Relative Volume. Most traders use 10 to 30 day lookback periods, though the optimal setting depends on your trading style.
RVOL Thresholds That Actually Matter
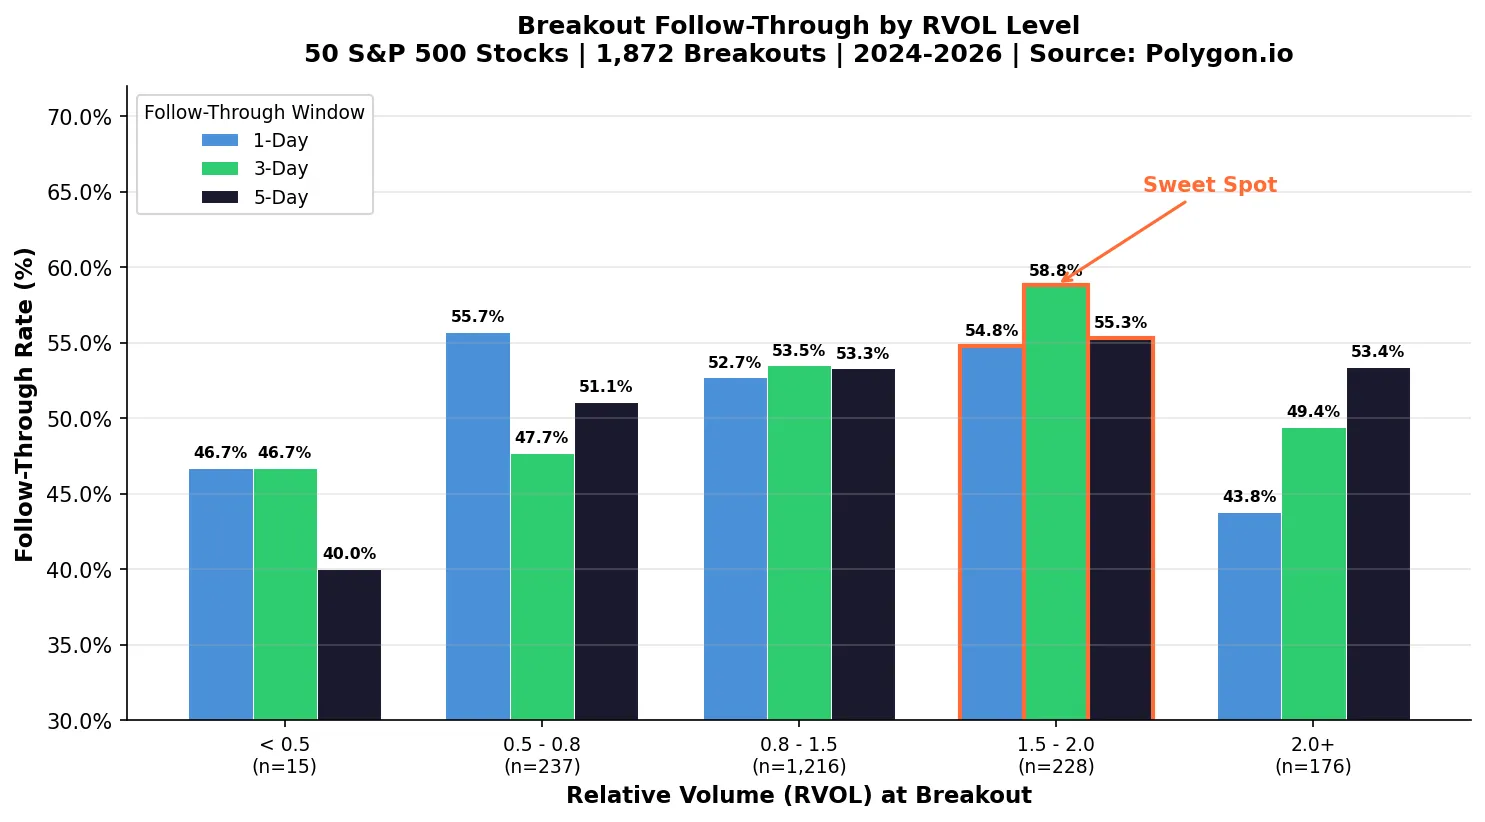
We backtested 1,872 breakout events (close above 20-day high) across 50 S&P 500 stocks from March 2024 to March 2026 using Polygon.io daily data with a 20-day volume lookback. Here is what the data shows:
- RVOL above 2.0: Extreme volume spikes. Our backtest of 1,872 breakouts across 50 S&P 500 stocks shows 53.4% five-day follow-through, but only 43.8% next-day follow-through — suggesting these moves often mark short-term exhaustion before continuation.
- RVOL between 1.5 and 2.0: The sweet spot. This range produced the highest 3-day follow-through rate at 58.8% with the best average 5-day return of +0.76%. Strong enough volume to confirm the move without the exhaustion risk.
- RVOL between 0.8 and 1.5: Normal trading range. 53.3% five-day follow-through with +0.26% average return. Workable, but less edge than elevated volume.
- RVOL below 0.5: Thin conditions. Only 40% five-day follow-through across our sample. Avoid trading breakouts when volume is this weak.
| RVOL Range | Breakouts | 1-Day Follow-Through | 3-Day Follow-Through | 5-Day Follow-Through | Avg 5-Day Return |
|---|---|---|---|---|---|
| < 0.5 | 15 | 46.7% | 46.7% | 40.0% | +0.06% |
| 0.5 – 0.8 | 237 | 55.7% | 47.7% | 51.1% | +0.27% |
| 0.8 – 1.5 | 1,216 | 52.7% | 53.5% | 53.3% | +0.26% |
| 1.5 – 2.0 | 228 | 54.8% | 58.8% | 55.3% | +0.76% |
| 2.0+ | 176 | 43.8% | 49.4% | 53.4% | +0.34% |
How to Set Up Relative Volume on ThinkorSwim
ThinkorSwim does not include a native Relative Volume indicator, but building one requires minimal ThinkScript. Our Average Volume Stats indicator handles this calculation automatically, displaying RVOL as a percentage label on your chart.
For manual calculation, the core ThinkScript logic compares today's volume against a simple moving average of prior daily volume. The indicator then displays this ratio as either a decimal (2.0) or percentage (200%).
Color coding helps with quick visual scanning. Green labels indicate RVOL above your threshold for conviction moves. Gray or red labels flag below-average activity where setups carry higher failure risk.
VWAP: The Institutional Benchmark Indicator
Volume Weighted Average Price (VWAP) is the average price a stock traded at throughout the session, weighted by volume at each price level. VWAP represents the true average cost basis for all shares traded that day.
Institutional traders use VWAP as a benchmark for order execution. A fund manager buying 500,000 shares considers their execution successful if they achieve a price at or below VWAP. This creates natural support and resistance around the VWAP line.
Why VWAP Acts as Dynamic Support and Resistance
When price trades above VWAP, buyers from earlier in the session are profitable on average. This creates a psychological floor where they may add to positions or defend their entries. When price drops below VWAP, those same buyers are underwater, increasing selling pressure.
VWAP is most effective during the first few hours of the trading session when volume concentration is highest. As the day progresses and more data accumulates, VWAP becomes less responsive to new price action.
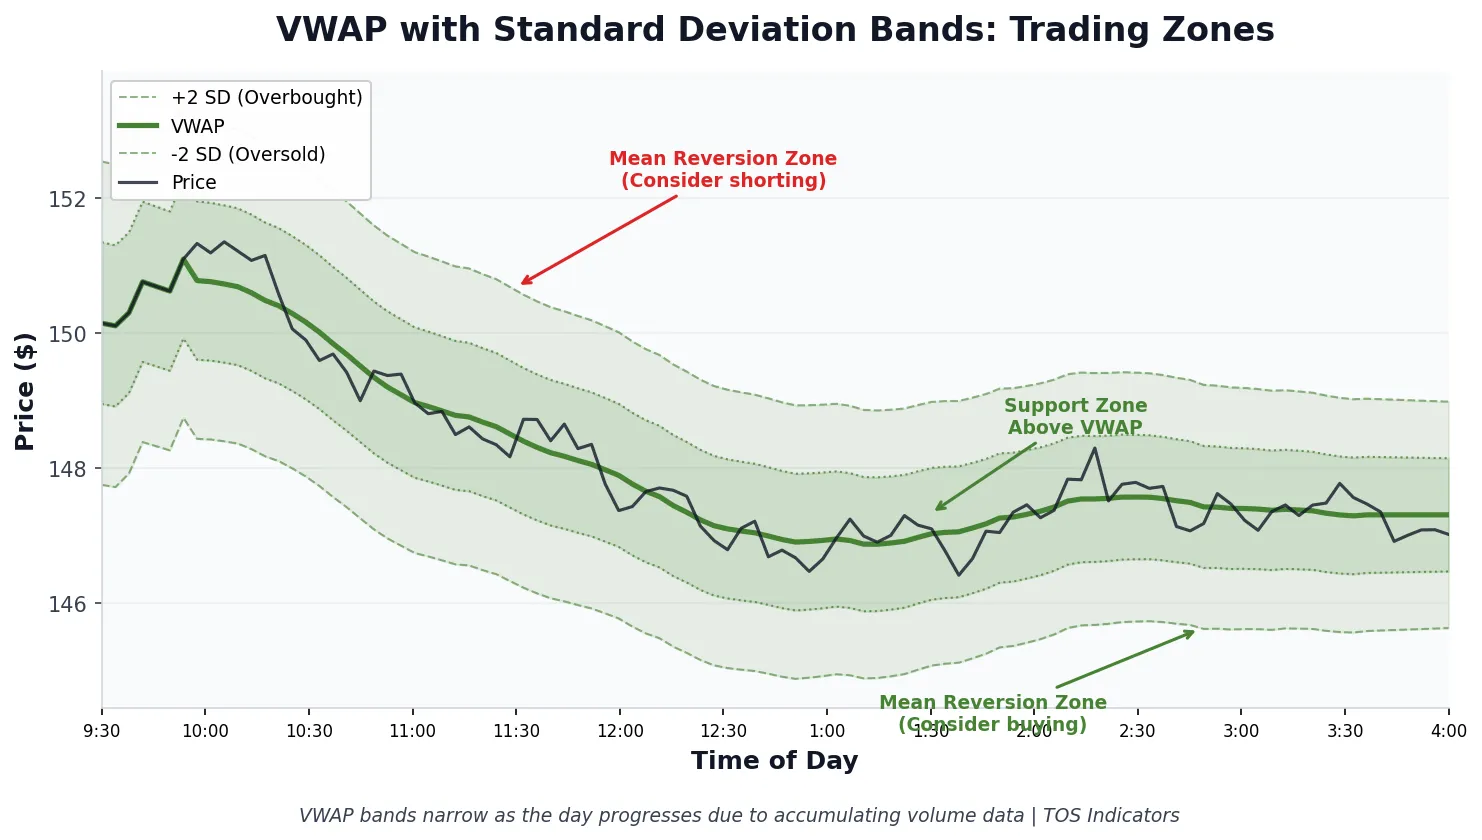
VWAP Bands and Standard Deviation Levels
Standard VWAP shows a single line. Adding standard deviation bands transforms it into a mean reversion tool. The most common configuration uses first and second standard deviation bands above and below VWAP.
Price touching the second standard deviation band above VWAP indicates an extended move. Mean reversion traders look for exhaustion signals at these levels. Price holding between VWAP and the first upper band suggests bullish momentum without overextension.
ThinkorSwim includes VWAP in its built-in studies. Search for "VWAP" in the Studies menu and apply it to your chart. The default settings work for most traders, though you can customize band widths and colors.
Anchored VWAP for Multi-Day Analysis
Standard VWAP resets at market open each session. Anchored VWAP lets you calculate volume-weighted average price from any specific date and time. This is useful for tracking institutional positioning since earnings, major reversals, or significant news events.
For example, anchoring VWAP to an earnings date shows where all post-earnings buyers entered on average. If price pulls back to this anchored level weeks later, you have a data-driven support zone rather than a subjective line.
On Balance Volume: Tracking Cumulative Buying Pressure
On Balance Volume (OBV) is a cumulative indicator that adds volume on up days and subtracts volume on down days. The absolute OBV value is meaningless. What matters is the direction of the OBV line relative to price action.
OBV was developed by Joseph Granville in the 1960s. Despite its age, it remains one of the most reliable volume indicators because it measures something fundamental: whether volume is flowing into or out of a security.
How to Interpret OBV Divergences
OBV divergences often precede price reversals by days or weeks. A bullish divergence occurs when price makes lower lows while OBV makes higher lows. This indicates accumulation happening beneath the surface.
Bearish divergence shows price making higher highs while OBV makes lower highs. Despite rising prices, volume is flowing out of the stock. This distribution pattern frequently precedes meaningful pullbacks.
The key is waiting for confirmation rather than trading the divergence immediately. OBV divergences can persist for extended periods before price responds.
OBV Trend Confirmation
During healthy uptrends, OBV should make new highs alongside price. Each price advance with rising OBV confirms buyers remain in control. When price makes a new high but OBV fails to confirm, treat it as a warning signal rather than an immediate sell signal.
OBV works best on daily timeframes where volume data is most reliable. Intraday OBV readings can be noisy due to irregular volume distribution throughout the trading session.
Setting Up OBV on ThinkorSwim
ThinkorSwim includes OBV as a built-in study. Navigate to Studies, search for "OnBalanceVolume," and add it to a lower panel on your chart. The default settings require no adjustment for most applications.
Some traders add a moving average to the OBV line to smooth out noise. A 20-period SMA on OBV helps identify the dominant trend in volume flow without overcomplicating the analysis.
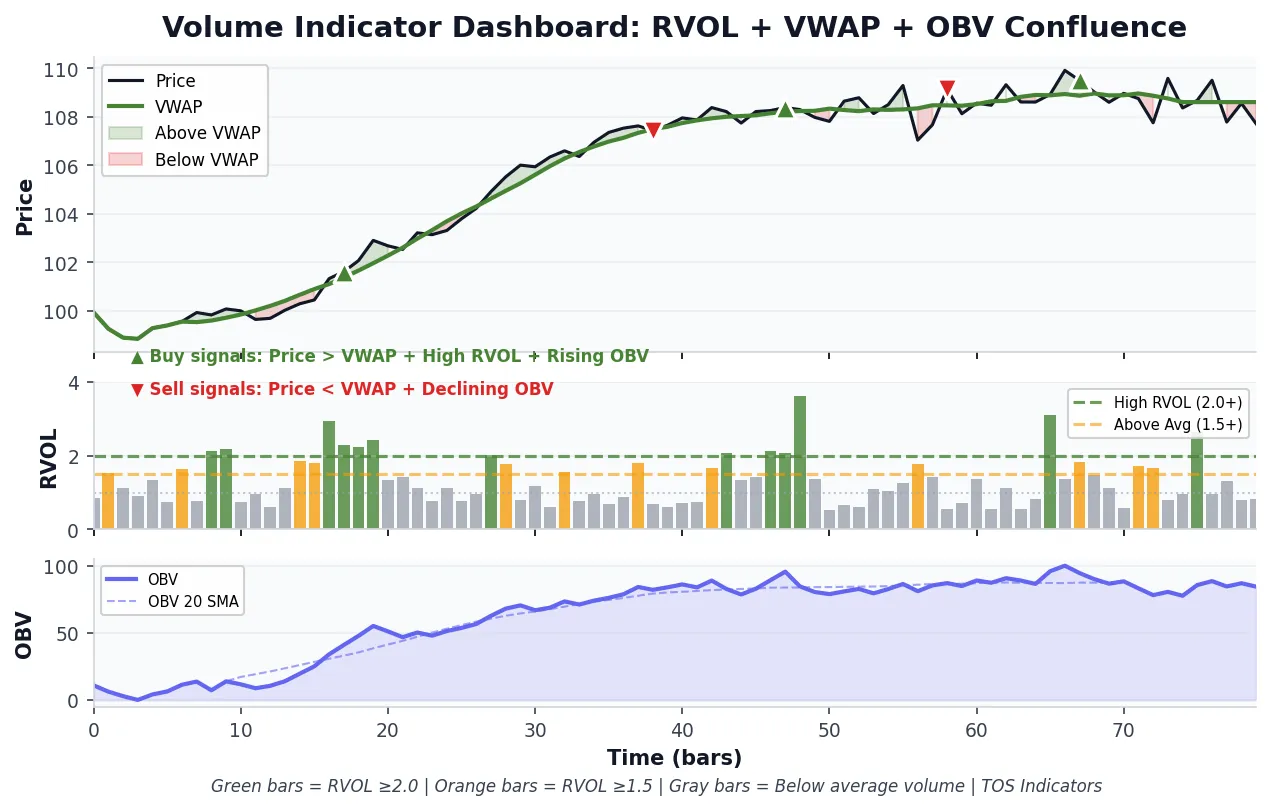
Combining Volume Indicators for Higher-Probability Setups
Each volume indicator answers a different question. Relative Volume tells you whether current activity is significant. VWAP shows where institutions are positioned. OBV reveals whether money is flowing in or out over time.
The strongest setups occur when multiple volume indicators align. A breakout with RVOL between 1.5 and 2.0, price holding above VWAP, and OBV confirming with new highs presents a higher-probability opportunity than any single indicator alone. Our data shows this RVOL range produces the best risk-adjusted returns.
Example: Volume-Confirmed Breakout Setup
Consider a stock breaking above a consolidation range at 10:30 AM. Here is how to use all three indicators:
- Check RVOL: Is current volume at least 1.5x the 20-day average? If below this threshold, the breakout may lack follow-through.
- Check VWAP: Is price trading above VWAP? Breakouts below VWAP face headwinds from underwater buyers who may sell into strength.
- Check OBV: Has OBV been trending higher over the past several sessions? Breakouts with bullish OBV divergence have stronger foundations.
When all three conditions confirm, you have a volume-backed breakout. When one or more indicators conflict, consider reducing position size or waiting for better alignment.
Additional Volume Indicators Worth Exploring
Beyond the three core indicators covered above, ThinkorSwim offers several other volume-based tools that complement relative volume, VWAP, and OBV analysis.
Volume Zone Oscillator
The Volume Zone Oscillator (VZO) identifies overbought and oversold volume conditions. It oscillates between +60 and -60, with readings above +40 indicating bullish volume pressure and readings below -40 suggesting bearish conditions.
VZO works well for swing traders looking for volume-based mean reversion signals. It requires ADX confirmation to filter out choppy, trendless conditions where the oscillator produces false signals.
Volume Intensity
Our Volume Intensity indicator tracks normalized volume across multiple symbols simultaneously. This is useful for monitoring sector rotation or comparing volume strength across a watchlist without manually checking each chart.
Cumulative TICK and Market Internals
For index and futures traders, the Cumulative TICK indicator measures market-wide buying and selling pressure in real time. While not a traditional volume indicator, it tracks the cumulative sum of NYSE advancing stocks minus declining stocks, providing insight into broad market participation.
Common Mistakes When Using Volume Indicators
Volume analysis seems straightforward, but several pitfalls trap traders who do not understand the nuances.
Mistake 1: Ignoring Time of Day
Volume concentrates in the first and last hours of the trading session. A 2.0 RVOL reading at 9:45 AM carries different implications than the same reading at 1:30 PM. Morning volume spikes are expected; midday volume spikes indicate unusual interest.
Mistake 2: Using Raw Volume Instead of Relative Volume
Raw volume bars are nearly useless for decision-making. 10 million shares traded means nothing without context. That same 10 million shares could represent 3x average volume for one stock and 0.5x average for another.
Mistake 3: Expecting VWAP to Work in All Conditions
VWAP is most effective during trending days with clear directional bias. On choppy, range-bound days, price will whipsaw around VWAP repeatedly. Identify the market condition before relying heavily on VWAP levels.
Mistake 4: Trading OBV Divergences Too Early
OBV divergences signal potential reversals, not immediate ones. Traders who buy the first sign of bullish divergence often watch price continue lower for weeks. Wait for price confirmation before acting on divergence signals.
Practical Workflow for Volume Analysis
Here is a step-by-step process for incorporating volume indicators into your ThinkorSwim trading routine:
- Pre-market: Identify stocks showing unusual pre-market volume using a scanner filtered for RVOL above 2.0.
- Market open: Add VWAP to charts of your watchlist. Note which stocks hold above VWAP after the initial volatility settles.
- Setup identification: When a pattern triggers, check RVOL. Strong setups should have above-average volume supporting the move.
- OBV confirmation: For swing trades held overnight, verify OBV aligns with your directional bias over the past week.
- Position sizing: Increase size when all volume indicators confirm. Reduce size or pass when indicators conflict.
This systematic approach removes emotion from volume analysis. You either have volume confirmation or you do not. The indicators provide objective data rather than subjective interpretation.
Connecting Volume Analysis to Volatility Models
Volume and volatility interact closely. High volume typically accompanies volatility expansion, while low volume often coincides with compression phases. Our Volatility Box platform incorporates volume analysis into its daily and hourly models, providing pre-calculated levels where volume historically concentrates.
Combining volume indicators with volatility-based support and resistance creates a more complete picture. A VWAP level that coincides with a Volatility Box model level carries more weight than either level alone.
Frequently Asked Questions
What is the best relative volume setting for day trading on ThinkorSwim?
A 10 to 20 day lookback period works best for day trading relative volume analysis on ThinkorSwim. Shorter periods react faster to recent volume changes but may be too sensitive. Longer periods provide more stable baselines but may miss shifts in trading activity. Most day traders find a 10-day average strikes the right balance between responsiveness and stability.
How do I add VWAP with standard deviation bands on ThinkorSwim?
To add VWAP with standard deviation bands on ThinkorSwim, navigate to Studies and search for "VWAP" or "VolumeWeightedAvgPrice." The built-in study includes an option for deviation bands. Set the "Num Dev" parameter to display first and second standard deviation bands. Most traders use 1 and 2 standard deviation levels, which capture approximately 68% and 95% of price activity respectively.
Does OBV work for futures trading on ThinkorSwim?
OBV works for futures trading on ThinkorSwim with some limitations. Futures volume data includes overnight sessions, which can distort daily OBV readings compared to equity markets. For index futures like ES and NQ, OBV remains useful for identifying divergences and confirming trends. However, many futures traders prefer tick-based volume studies or the Cumulative TICK indicator for intraday analysis.
What RVOL level indicates a significant breakout?
An RVOL reading of 1.5 or higher indicates above-average conviction. Our backtest of 1,872 breakouts across 50 S&P 500 stocks (2024–2026) found the RVOL 1.5–2.0 range produced the best results: 58.8% three-day follow-through with a +0.76% average five-day return. RVOL above 2.0 still shows positive follow-through (53.4% at five days) but has lower next-day rates (43.8%), suggesting extreme volume spikes can mark short-term exhaustion before continuation.
Can I use VWAP for swing trading across multiple days?
Standard VWAP resets daily and is designed for intraday analysis. For swing trading across multiple days, use Anchored VWAP instead. Anchored VWAP calculates volume-weighted average price from any specific date you choose, such as earnings announcements, major reversals, or the start of a trend. This provides multi-day institutional cost basis levels that standard VWAP cannot capture.
How do I scan for high relative volume stocks on ThinkorSwim?
To scan for high relative volume stocks on ThinkorSwim, create a custom stock scanner using ThinkScript. The filter should compare current volume to a moving average of historical volume, then return stocks where the ratio exceeds your threshold (typically 1.5x or 2.0x). Alternatively, use our pre-built relative volume scanner which handles the calculations automatically and includes additional filters for price and liquidity.
Is OBV or Accumulation/Distribution a better volume indicator?
OBV and Accumulation/Distribution (A/D) measure similar concepts but calculate differently. OBV uses the full day's volume based solely on close direction. A/D weights volume by where price closes within the daily range. OBV tends to be simpler and more responsive to directional changes. A/D provides more granular data about intraday buying versus selling pressure. Most traders find OBV sufficient; A/D adds complexity without proportional benefit for typical analysis.
Key Takeaways
- The RVOL sweet spot is 1.5–2.0, with 58.8% three-day follow-through and the highest average returns in our 1,872-event backtest. RVOL above 2.0 still works but watch for short-term exhaustion.
- VWAP serves as the institutional benchmark and creates dynamic support and resistance throughout the trading day.
- OBV divergences often precede price reversals by days or weeks, making it valuable for swing trade confirmation.
- Combining all three indicators provides higher-probability setups than relying on any single volume measure.
- Time of day matters. Volume analysis must account for the natural concentration of activity at market open and close.
Download the full dataset: RVOL Breakout Data — 1,872 events across 50 S&P 500 stocks (CSV). Includes ticker, date, RVOL, follow-through returns, and VWAP positioning for every breakout event.
[/wcm_restrict] [wcm_nonmember plans="volatility-box"]Download the full dataset: This CSV download with all 1,872 breakout events is available to Volatility Box members.
[/wcm_nonmember]Volume analysis separates data-driven traders from those guessing at support and resistance. The three indicators covered here provide different perspectives on the same underlying question: is real money backing this price move? When you can answer that question objectively, your trading decisions improve.
Start by adding these indicators to your ThinkorSwim charts. Track how often your winning trades had volume confirmation versus how often your losing trades lacked it. The data will speak for itself.


Ready to Trade With an Edge?
Join 40,000+ traders using institutional-grade tools for ThinkOrSwim.
Get the Bundle