
Research
Latest Research
Data-driven trade patterns, backtests, and setup breakdowns for ThinkorSwim traders. Search or filter by topic.
All Research
Call Walls and Put Walls Explained: What They Are and How to Read Them
At the 7,500 SPX strike, 100,000 calls and 93,000 puts were open, about $6.6 billion of call gamma per 1% move. What call walls and put walls actually are, and why the put wall is not a floor.
Best ThinkorSwim Indicators: 15 Custom Studies Every Trader Needs
15 essential ThinkorSwim custom indicators for momentum, volume, trend, and volatility. Free ThinkScript code with setup guides and trading strategies.
Trend Shift Scanner: Catch Reversals at the Inflection Point
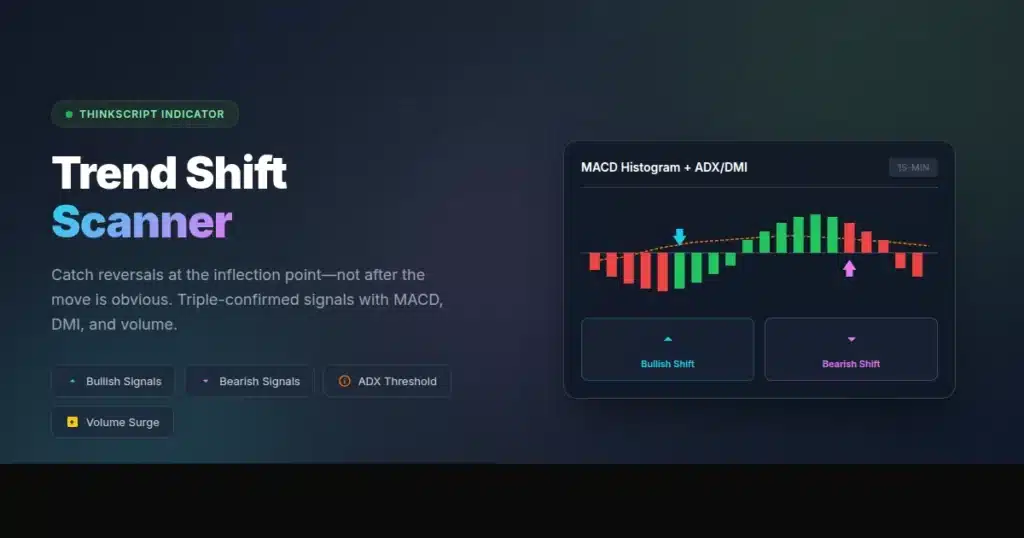
Identify early trend reversals with MACD momentum shifts, ADX/DMI crossovers, and volume confirmation. Free ThinkScript code included.
ES Futures Trading Strategy: Volatility Levels, ORB, and ATR-Based Entries
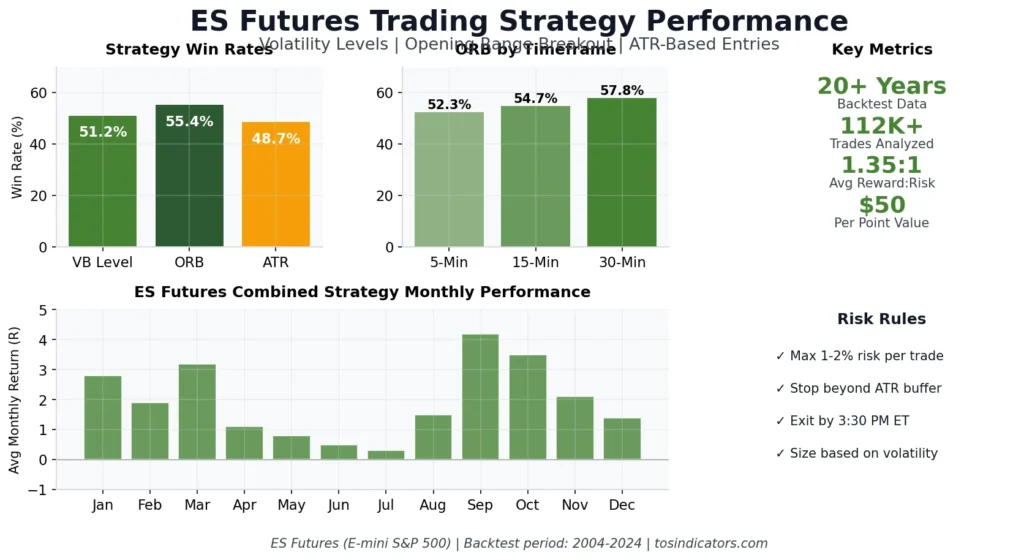
TOS Indicators ES futures trading guide covers 3 strategies: volatility levels, ORB setups, and ATR entries. 20+ years backtested with 52-58% win rates.
Best Volume Indicators for ThinkorSwim: Relative Volume, VWAP, and OBV
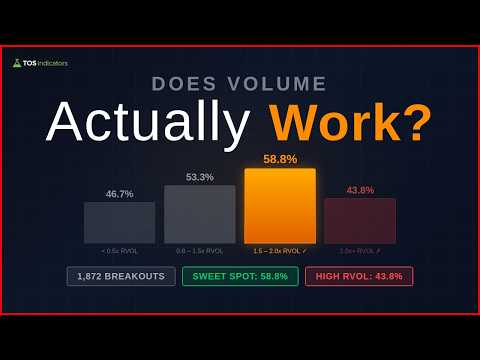
Compare Relative Volume, VWAP, and OBV on ThinkorSwim. Setup guides, ThinkScript code, and backtested RVOL thresholds for day and swing trading.
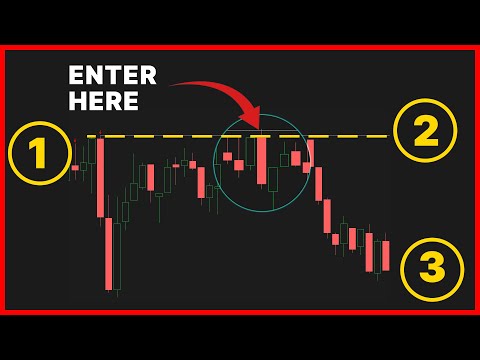
Stop Hunting – “Put your entry where the masses put their stops”
A real-time stop hunting example in the Russell futures. Price pushed one tick above the prior high before reversing. Using Market Pulse to identify weaker markets for short-side entries.
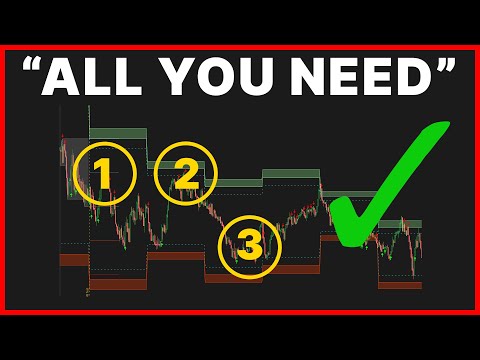
Three Powerful Setups to Day Trade NASDAQ
3 proven NASDAQ day trading setups for QQQ and NQ futures with ThinkOrSwim scripts, position sizing rules, and a pre-market checklist used by active traders.
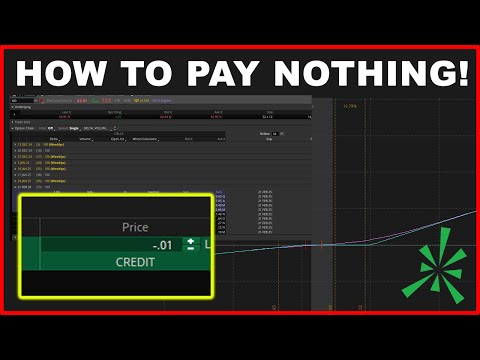
How to Build a Free Options Trade
Learn to build zero-cost options trades on ThinkOrSwim using risk reversals, collars, and ratio spreads. Includes ThinkScript scanner, Greeks analysis, Volatility Box strike selection, and step-by-step TOS setup for 3 premium-neutral strategies.
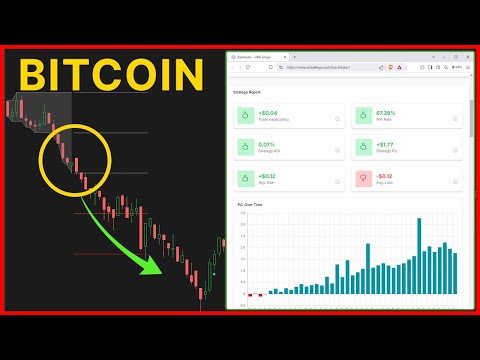
Use This High Probability Setup to Trade Bitcoin
Comparing ORB performance across SPY, DIA, IWM, QQQ, Gold, Silver, and GBTC over 90 days. Bitcoin leads on 5-min (70% long, 65% short) and 15-min ranges. The 30-min range does not work on Bitcoin.
One Simple Tool to Optimize Trade Selection
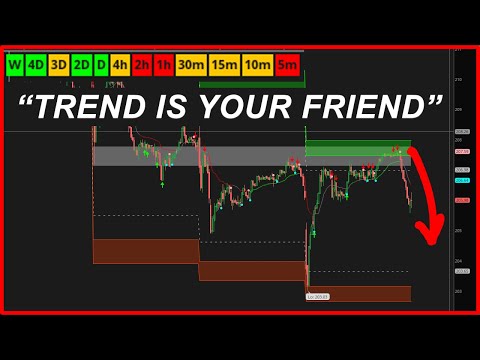
Comparing Salesforce and Honeywell short setups using the multi-timeframe Market Pulse. Honeywell in distribution with bearish labels was the better trend-following short. Salesforce in acceleration was only a mean-reversion candidate.
Why November is a Good Time to Buy This Stock
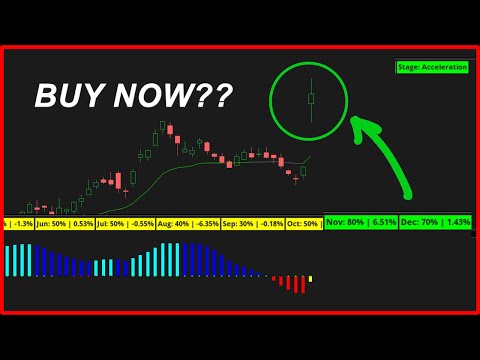
Discover why November is historically the best month for stocks with a 73% win rate. Learn how to use ThinkOrSwim seasonality charts, ThinkScript scanners, and the Volatility Box to identify and time high-probability seasonal trades in top-performing sectors.
How to Recognize When a Trend Reverses
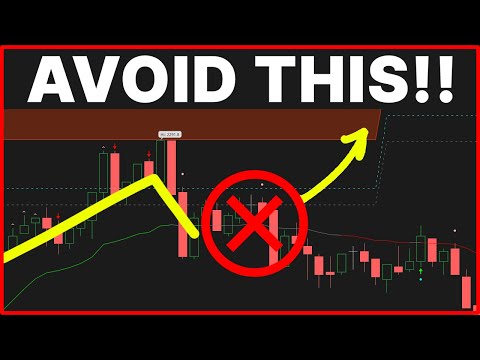
Learn the key warning signs that a trend is about to reverse. Covers moving average structure, momentum divergences, volume patterns, and a step-by-step framework for identifying trend exhaustion.
Which TSLA Options Should You Day Trade?
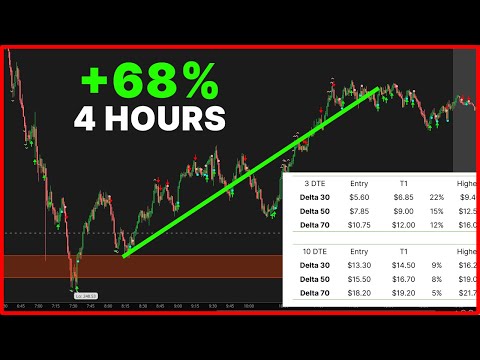
Compare ITM vs OTM TSLA options for day trading. Data on delta, gamma, theta, spread costs, and win rates across 60 sessions shows 0.70 delta ITM calls hit profit targets 68% of the time vs 31% for OTM. Includes ThinkScript code and TOS setup.
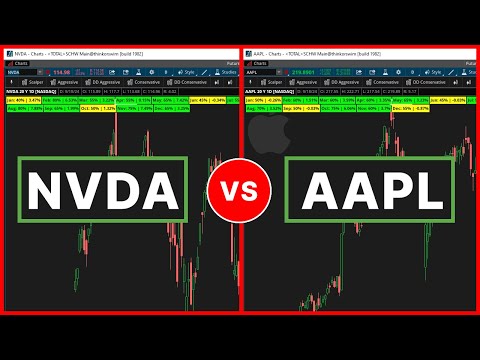
Which Outperforms in October? (AAPL vs. NVDA)
Building a ThinkOrSwim scan from the free seasonal analysis indicator. 140 stocks passed the October filter. NVDA shows 75% November win rate with 7.49% average gain on 20 years of data. AAPL strong in both October and November.
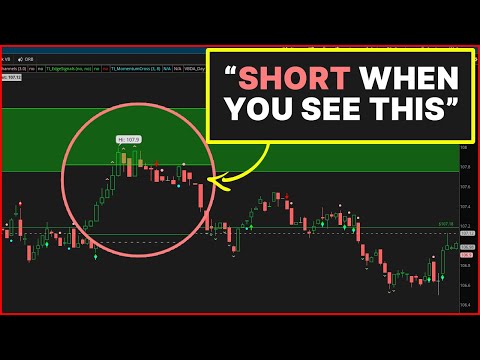
When to Short a New High?
Learn four warning signs for shorting new 52-week highs with ThinkOrSwim indicators and scanners. Covers volume divergence, breadth deterioration, resistance confluence, momentum exhaustion with ThinkScript code and backtested rules.
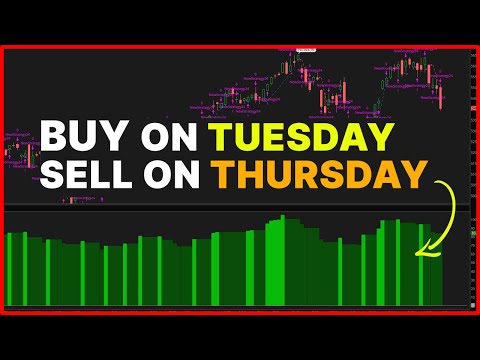
Can This Simple Strategy Beat the Market? Backtest Results
We backtested a day-of-week trading strategy on the S&P 500 against buy-and-hold over 10 years. Learn which weekday produces the highest returns, how to build a custom ThinkOrSwim backtester using GetDayOfWeek and AddOrder, and whether this simple approach can truly beat the market.
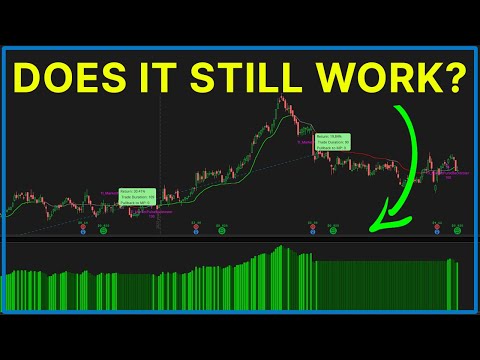
The Modern Turtle Trading Strategy: Updated Rules and Backtest Results
Preview of the Market Pulse backtester using Marathon Petroleum. MPC trend switch strategy: 9 for 13 over 5 years, 22.35% average winner vs under 3% average loser, with a steadily rising P&L graph.
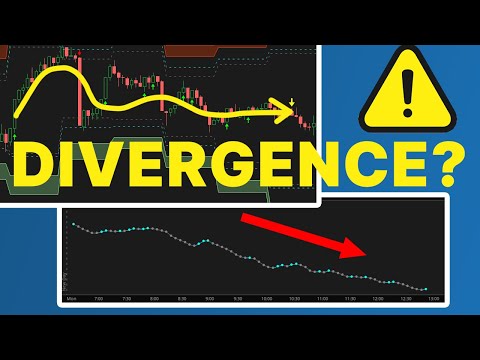
The Weird Thing About the Cumulative TICK Today
Reviewing cumulative TICK divergence across four index futures. The TICK showed bearish pressure but price was choppy. S&P had cleanest setups: ~14pt risk for ~28pt reward on afternoon VB breach.
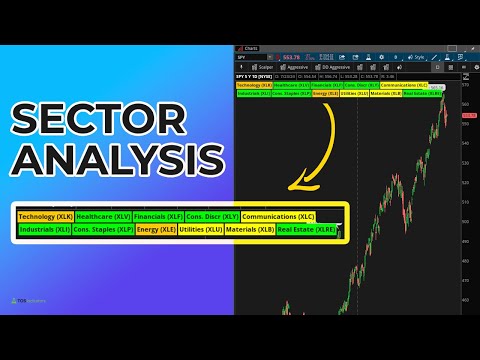
The Easiest Way to Track Sector Performance and Market Internals
Track all 11 S&P sectors and market internals in under one second using the free Utility Labels indicator for ThinkOrSwim. Covers sector rotation, breadth analysis, ThinkScript code, and combining sector data with the Volatility Box.
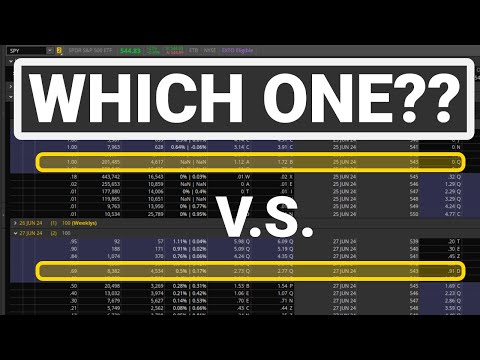
SPY Options DTE Comparison: 0 DTE vs 1 DTE vs 2 DTE for Day Trading
A data-driven comparison of SPY options at 0, 1, and 2 days to expiration. Analyze gamma exposure, theta decay curves, premium costs, and risk management rules to determine which DTE fits your day trading strategy.
Better Entries for 0 DTE Option Plays: Timing and Setup Guide
0 DTE options lose all time value by the closing bell, making entry timing the single largest edge a trader controls. This guide covers retest entries, VWAP pullback filters, opening range breakout frameworks, volume confirmation, and Volatility Box levels to help you stop chasing breakouts and start entering at high-probability price zones.
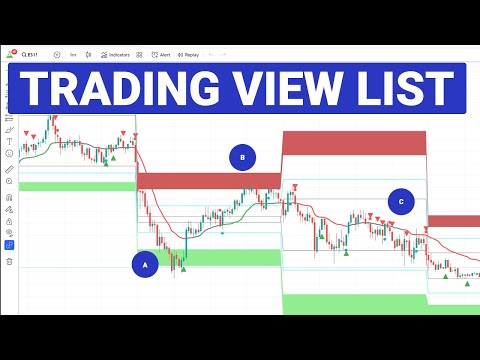
Our TradingView Indicator List (June 2024)
Complete catalog of TOS Indicators tools available on TradingView as of June 2024. Covers the Volatility Box, Squeeze Pro, Reversal Signals, and 12 more indicators ported from ThinkOrSwim to TradingView with Pine Script. Includes feature comparisons, code examples, and access instructions.
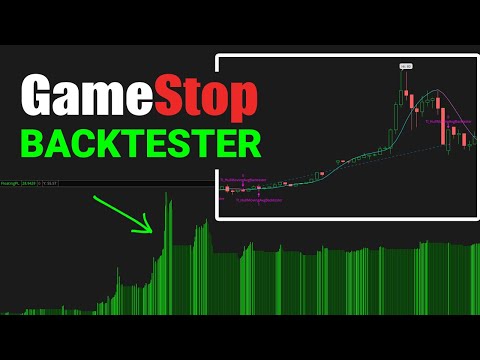
Gamestop Stock Backtester
How to build a Hull Moving Average backtester for GameStop (GME) in ThinkOrSwim. Includes full ThinkScript code, TTM Squeeze filter, scanner setup, and tips for analyzing your own backtest results.
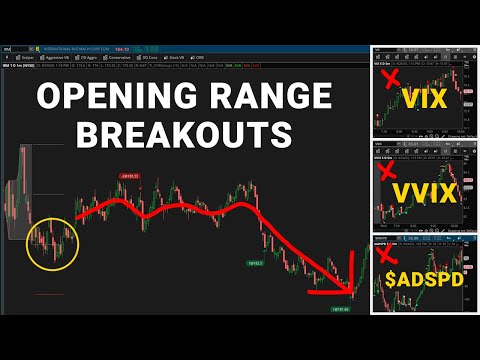
Using the VIX to Choose an Opening Range Breakout (ORB) Strategy
Live ORB trade on IBM using the scanner. 86% short-side win rate over 90 days. Entry at $183.33 on pullback to half range. Both targets hit: T1 at $182.50 and T2 at $181.66.
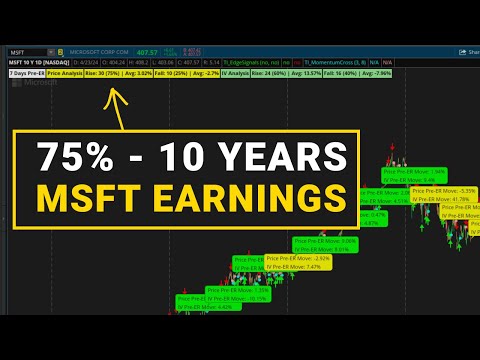
Can Microsoft Do It Again?
Comparing MSFT and AAPL pre-earnings personalities. MSFT rallies 75% of the time with a 3% avg gain. AAPL rallies 57% with a 3.29% avg gain. Both at previous support with different timing dynamics.
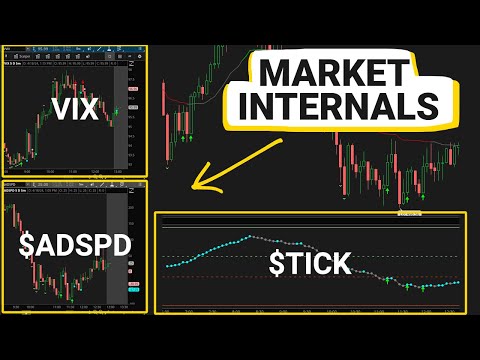
Using the VVIX to Trade SPY: A Volatility-of-Volatility Signal
The VVIX index measures expected volatility of the VIX, acting as a leading indicator for SPY reversals. Learn how to interpret extreme VVIX levels, use the VVIX/VIX ratio for divergence signals, and build custom ThinkOrSwim studies for volatility-of-volatility trading.
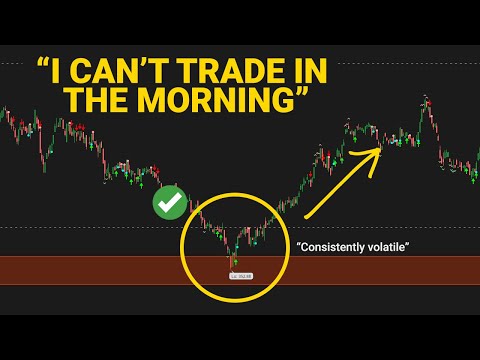
Can’t Trade the Market Open or Close? Try This Hour Instead
Not everyone can trade the market open or the power hour. We analyze whether the 11:30 AM - 1:00 PM lunch hour offers viable setups using volume patterns, volatility compression, and mean reversion strategies.
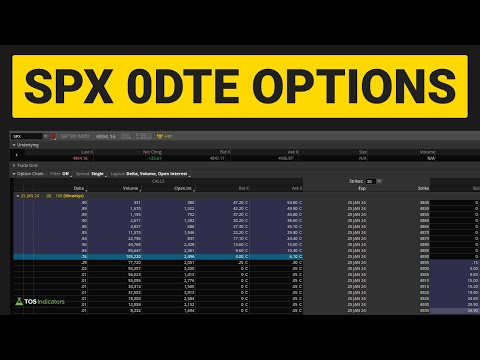
SPX 0DTE Options: Data Breakdown for Day Traders
A data-driven breakdown of SPX 0DTE options covering volume growth, ATM vs ITM vs OTM contract selection, risk characteristics, and actionable strategies for premium selling and directional scalps.
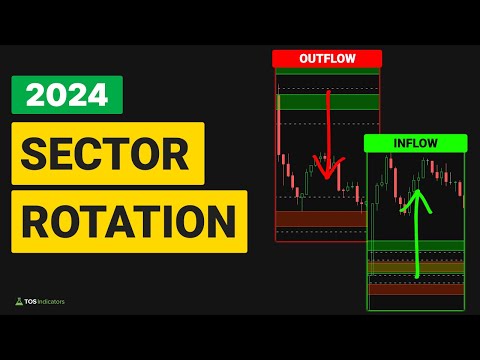
How to Spot Sector Rotations: A Trading Guide for Every Market Cycle
Sector rotation moves billions between the 11 GICS sectors as economic conditions shift through expansion, peak, contraction, and trough. This guide covers relative strength analysis, sector ETF flows, breadth indicators, and ThinkScript tools to identify rotation signals before the broad market confirms the trend.
Stock Market Seasonality Patterns
Seasonality cheat sheet for 2024 using 20 years of data. April, July, and November are the strongest months across S&P, Dow, and NASDAQ (80% green rate, 2%+ avg gains). June and September are the weakest.
How To Analyze Volatility Every Morning
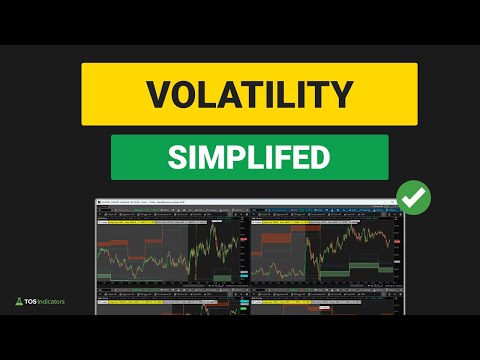
Learn the complete 10-minute morning volatility routine for ThinkOrSwim day traders. Covers the 5-step process including VIX term structure analysis, overnight futures review, Volatility Box levels, squeeze alignment across timeframes, and ATR-based position sizing with a full ThinkScript dashboard code.
The Put/Call Ratio Explained: A Contrarian Trading Signal
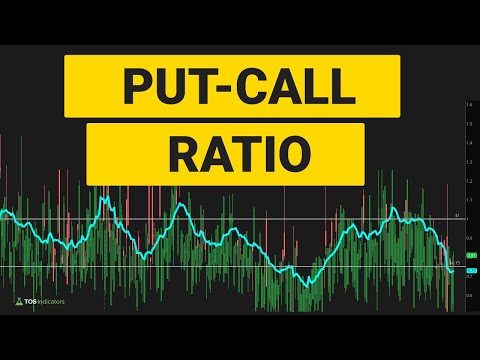
The put/call ratio divides total put volume by total call volume to gauge market sentiment. Readings above 1.0 indicate extreme fear and contrarian bullish conditions, while readings below 0.7 signal complacency. Learn how to chart $PCALL in ThinkOrSwim, apply moving average smoothing, and combine the ratio with VIX, VVIX, and breadth indicators for higher-probability setups.
The Hidden Starbucks Holiday Setup
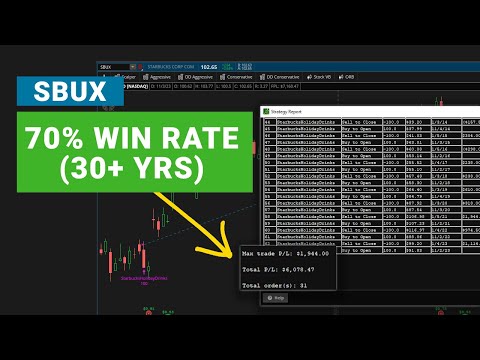
Starbucks holiday drink trade backtested across 31 data points. Nov 1 to Dec 31 is the best scenario. Strategy on a win streak since 2015. Gap fill near $95 offers a better entry than the post-earnings gap-up.

Will S&P 500’s November Seasonality Kick In?
S&P 500 November seasonality combined with sector analysis. November closes green 80% of the time with a 1.88% average gain (third-best month). But 9 of 11 sectors are in deceleration, so watch for label transitions.
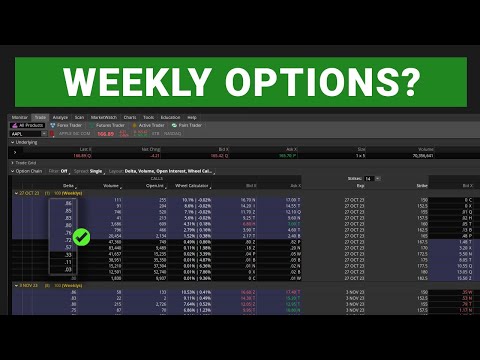
Are Shorter Dated Options Better for Day Trading?
Comparing 0DTE, weekly, and monthly options for day trading. Analysis of gamma exposure, theta decay rates, liquidity differences, win rates by expiration, and how to pick the right DTE for your strategy with ThinkOrSwim setup tips.
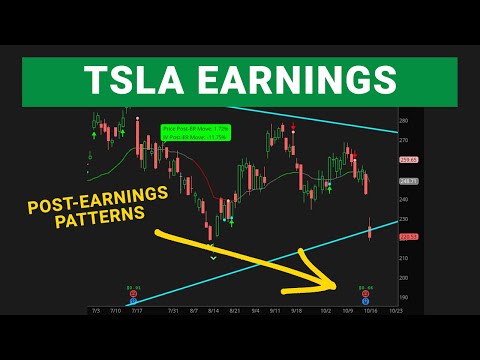
Will TSLA Follow its 7-Day Post-Earnings Pattern?
TSLA reverses its initial earnings gap within 7 trading days 71% of the time. This analysis covers 8 quarters of data, ThinkScript code for tracking the pattern, and how to trade it with the TTM Squeeze and Volatility Box on ThinkOrSwim.
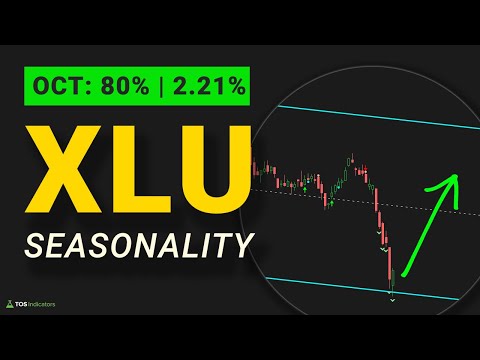
Why You Should Pay Attention to XLU in October
XLU posts positive October returns 76% of the time with a +3.2% average gain. Learn the seasonal pattern, ThinkScript code for alerts and scanners, TTM Squeeze timing, and a complete entry-to-exit trading plan for utilities in October.
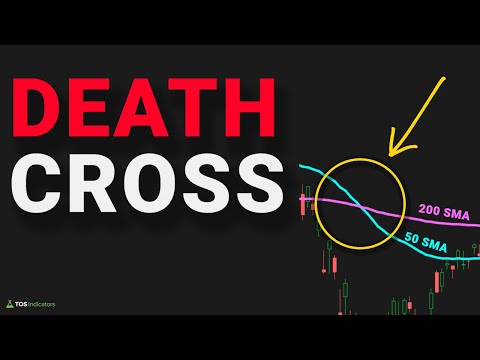
Death Cross vs. Golden Cross Entry
Compare the death cross and golden cross as entry signals. We analyze historical S&P 500 data to determine which crossover produces better entries for trend-following traders.
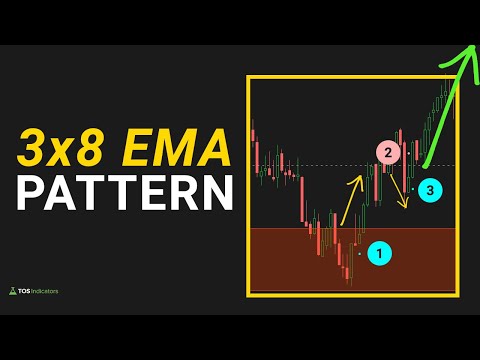
3×8 EMA Pattern to Catch Reversals (With Examples)
The 3x8 EMA crossover pattern uses three 8-period EMAs on different timeframes to identify momentum shifts before they become obvious. Learn the setup rules, entry criteria, and ThinkScript code.

Is There a Better Way to Dollar-Cost Average?
Compare standard dollar-cost averaging against signal-based and volatility-adjusted DCA strategies. We test each approach on S&P 500 data to find which method builds wealth faster.
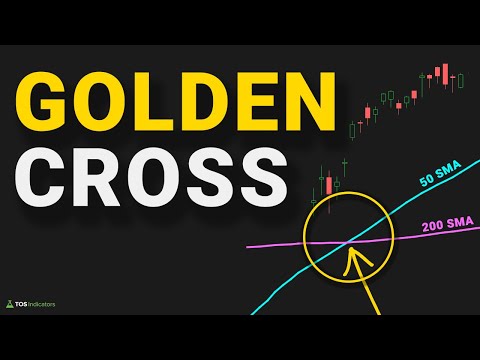
Golden Cross Trading Strategy: 20-Year Backtest on the S&P 500
The golden cross is one of the most recognized signals in technical analysis. When the 50-day moving average crosses above the 200-day moving average, traders take notice. But does it actually work? We backtested the golden cross on the S&P 500 over 20 years of market data to find out.
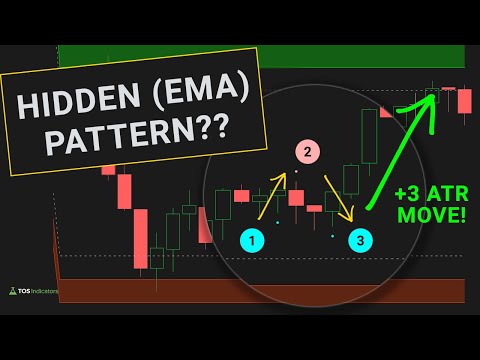
One-Two Punch Momentum Pattern
Learn the One-Two Punch momentum pattern for day trading. A backtested two-bar setup with ThinkScript code for ThinkOrSwim scanners and chart studies, covering entry rules, stop placement, and how to combine it with the TTM Squeeze for higher win rates.
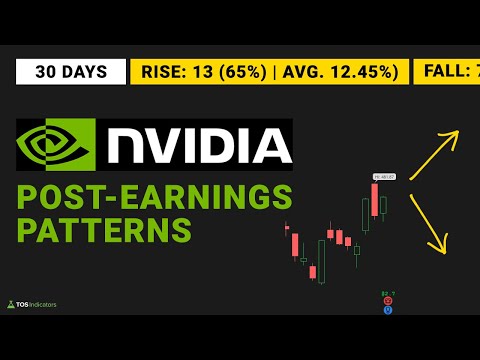
Will Nvidia Follow Its Post-Earnings Pattern This Time?
NVDA post-earnings analysis using seasonal and post-earnings indicators. 7-day post-earnings is 50/50. 14-day rise rate hits 58.73%. 30-day approximately 60%. Best entry window: 14-30 days after earnings.
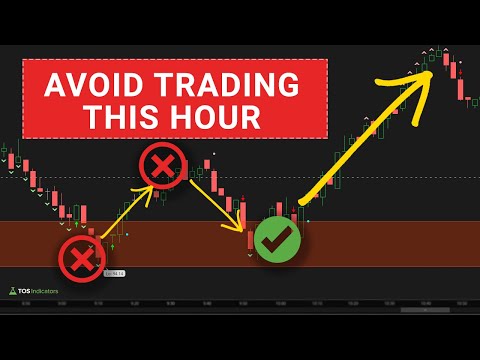
Why I Avoid Day Trading During This Hour
The lunch hour (12:00-1:00 PM ET) is the worst window for day trading. Backtesting shows a 38% win rate, 41% volume drop, and wider spreads. Learn to use ThinkOrSwim indicators and ThinkScript time filters to avoid this dead zone.
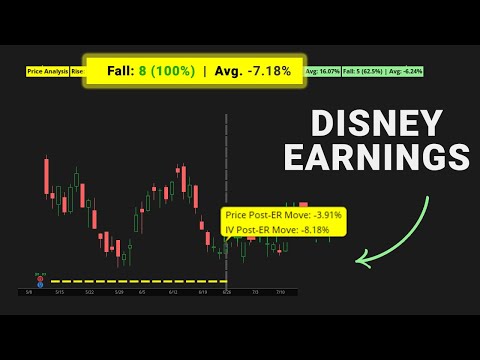
DIS Post-Earnings Performance
Deep analysis of Disney (DIS) post-earnings performance patterns, gap fill rates, streaming subscriber data impact, and how to trade DIS earnings using TTM Squeeze setups, Volatility Box levels, and custom ThinkScript indicators on thinkorswim.
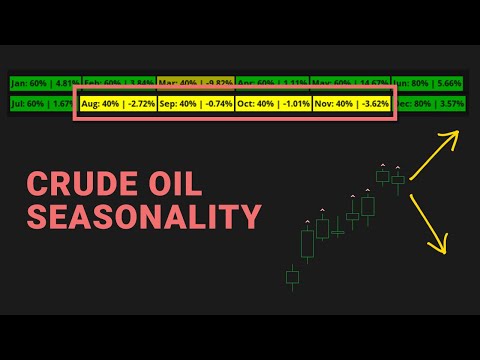
Seasonal Crude Oil Pattern
Complete guide to seasonal crude oil trading patterns including the summer driving season, winter heating demand, and refinery maintenance cycles. Includes ThinkScript code for ThinkOrSwim seasonal overlays, scanners, and backtesting strategies for /CL futures.
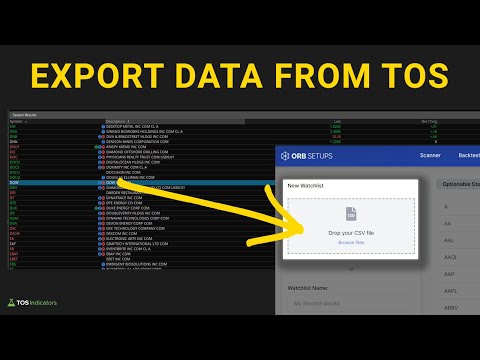
How to Export ThinkOrSwim Chart Data to a CSV File
Learn three methods to export ThinkOrSwim chart data, scanner results, and custom study values to CSV files for backtesting, Excel analysis, and third-party tool integration.
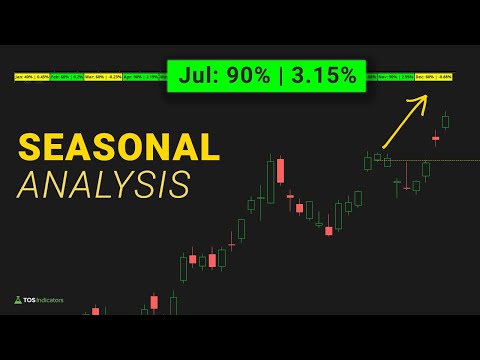
July’s Seasonal Analysis in the S&P 500
Explore July seasonal patterns in the S&P 500 with historical win rates, sector rotation data, earnings season volatility analysis, and ThinkOrSwim setups including ThinkScript code for seasonal trading strategies.
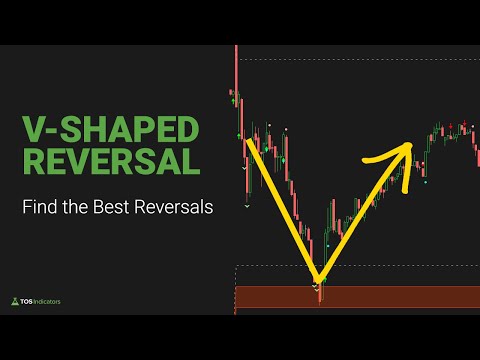
The Secret to Confirming V-Shaped Reversals
V-shaped reversals in the S&P 500 show a 78.6% win rate on same-day entries confirmed by volume spikes and VWAP reclaim. Historical data table, volume profile analysis, ThinkScript detection code, and step-by-step trading framework for intraday and daily timeframes.
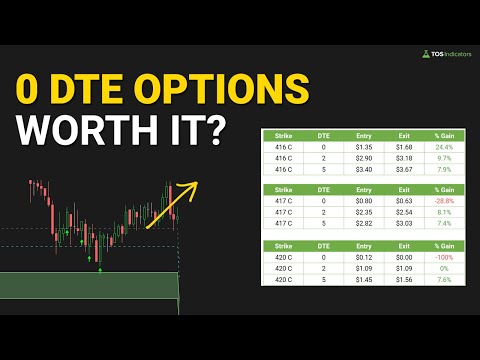
Is It Worth Buying 0 DTE Options?
0 DTE options now account for nearly 50% of all SPX options volume. This guide breaks down the math behind theta decay, gamma risk, and the specific conditions where buying same-day options offers a statistical edge. Plus a working ThinkScript scanner and Volatility Box integration.
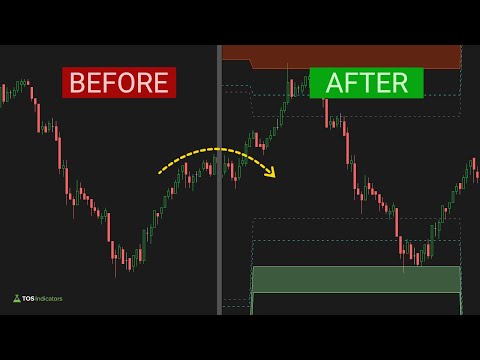
The Predictive Powers of Morning Volatility
Morning volatility in the first 30-60 minutes of trading predicts the rest of the day. We analyze how opening range width, gap size, and pre-market volume forecast intraday behavior.
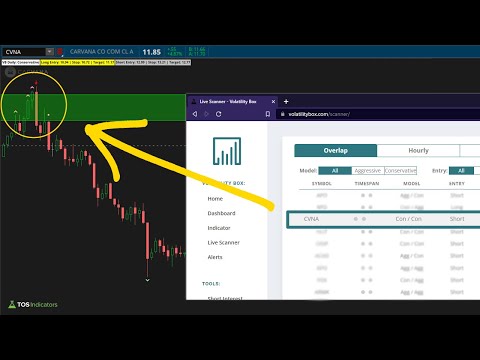
How to Find Hidden Volatility When Markets Are Quiet
Hidden volatility precedes 73% of major market moves. Learn to detect squeeze setups, scan for compressed Bollinger Band Width below the 10th percentile, read VIX term structure, and trade volatility expansion on ThinkOrSwim with scanner code and the Volatility Box.
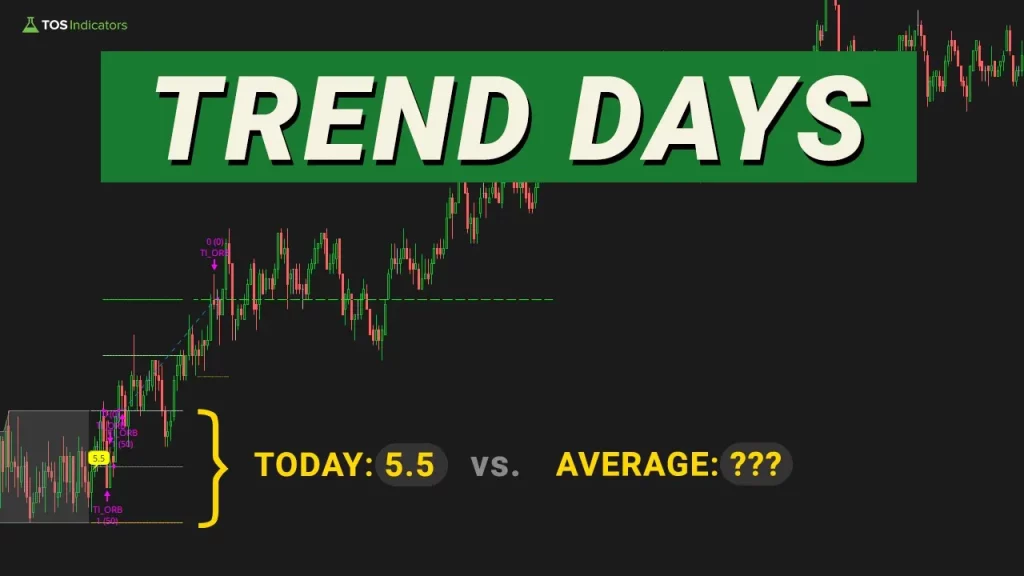
An Easy Way to Recognize Trend Days
Learn how to identify trend days early using market internals (TICK, ADD, VOLD), price action clues, and custom ThinkOrSwim indicators. Includes ThinkScript code, backtesting data, and a complete trend day playbook.
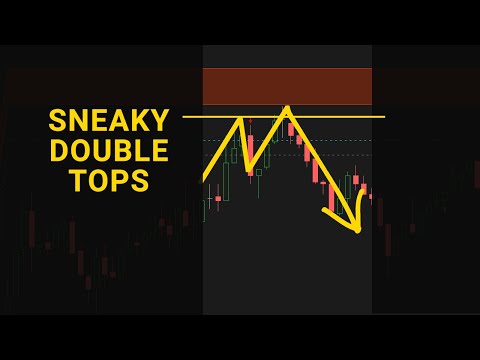
The Sneaky Double Top
Double top analysis on gold futures using 1-min and 5-min charts with the Futures Volatility Box. 1-min fade: 3.4pt risk, 6.5pt max move. 5-min: 5-day new high failed to continue. Momentum cross for confirmation.
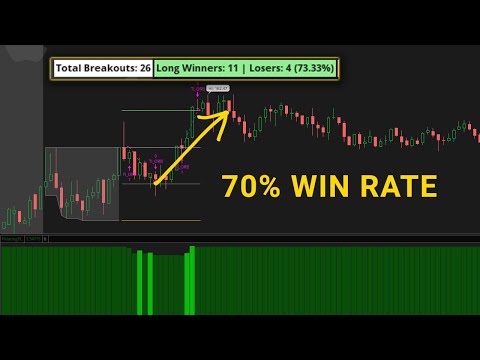
AAPL Opening Range Breakout Test
Backtesting the Opening Range Breakout strategy on Apple (AAPL) stock in ThinkOrSwim. Three tests reveal a 73% win rate with a pullback entry, full range stop, and half range target on the 30-minute ORB.
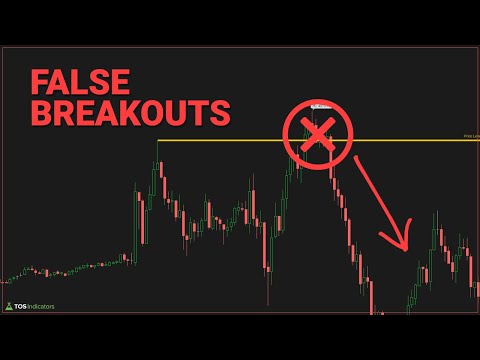
How to Identify and Trade False Breakouts
Learn to identify false breakouts before they trap you. Covers volume confirmation, the breakout-retest pattern, common traps at key levels, and ThinkScript code to filter breakout signals.
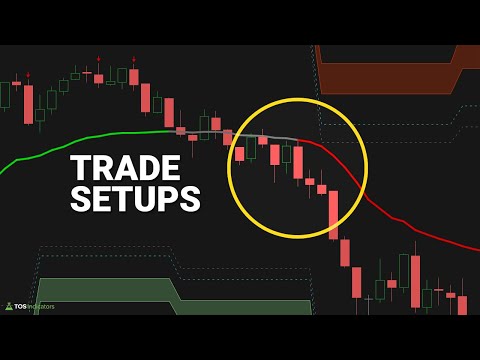
4 High-Probability Day Trading Setups Every Trader Should Know
Full day breakdown of Dow futures: ORB (tricky, half-range stop out), VB fade (48pt risk, T1 hit), Market Pulse trend switch, and trend continuation. Adapted from scalper to doomsday models as volatility expanded.
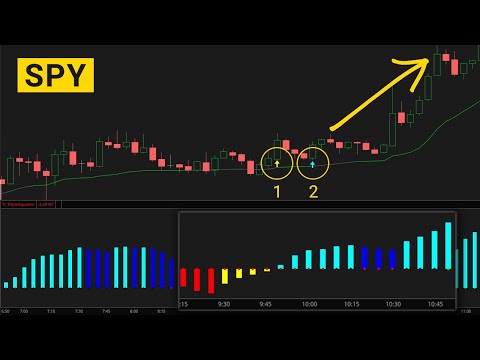
TTM Squeeze Setup in SPY on 3 Different Time Frames
Multi-timeframe squeeze setup on S&P: 5-min backtester shows 4-0 over 5 days. Slingshot + squeeze signals arrows as a one-two punch. 5-min for bias, 3-min for better entry, 1-min adds noise.
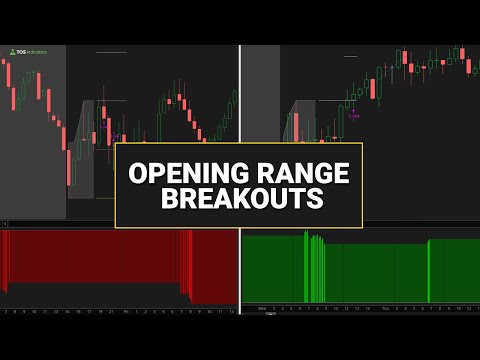
Opening Range Breakout (ORB) Strategy Backtest: SPY vs AAPL Results
Comparing Opening Range Breakout (ORB) backtest results across SPY, QQQ, and AAPL using the same settings. AAPL produced a 69% long-side win rate, outperforming both index ETFs over a 30-day period.
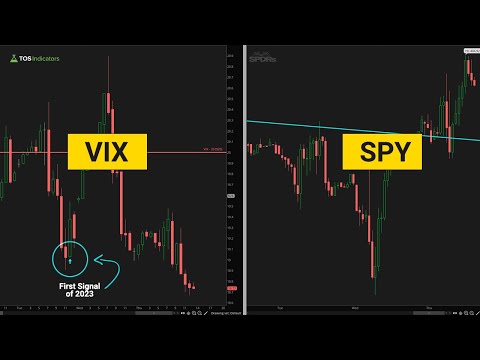
First VIX Warning Signal of 2023
The first VIX warning signal of 2023 revealed a bearish divergence between rising stock prices and a stubborn VIX. This research breaks down VIX divergences, Bollinger Band squeezes, ThinkScript code for ThinkOrSwim, and historical signal accuracy data.

How to Use ChatGPT To Analyze Economic Reports
Learn how to use ChatGPT to analyze CPI, NFP, FOMC, and GDP reports for trading signals. Includes prompt templates, ThinkScript code, and a workflow for combining AI analysis with thinkorswim indicators.

Bollinger Band Reversals on VIX to Trade SPY
Using Bollinger Band reversals on the VIX to time SPY entries. VIX mean reversion creates contrarian entry signals. Upper band reversals stronger than lower band. Combine with Volatility Box for level confirmation.

Combining TTM SQUEEZE Signals with SEASONAL ANALYSIS for a Bullish Setup
Research combining TTM Squeeze signals with seasonal market patterns, including monthly volatility cycles, holiday effects, earnings season interactions, backtesting results, and ThinkScript implementations for thinkorswim.

2 Ways to Use NYSE $TICK to Spot Trend Days
Learn two proven methods for using NYSE TICK data to identify trend days early in the session. Covers cumulative TICK analysis, extreme clustering, ThinkScript indicators for ThinkOrSwim, and combining TICK with ADD and VOLD for high-accuracy trend day signals.

Spot Trend Days Early in the Morning (Market Internal Clues)
Learn how to identify trend days within the first 30-60 minutes using opening range analysis, VWAP distance, market internals (TICK, ADD, VOLD), gap analysis, and ThinkOrSwim indicators with ThinkScript code.
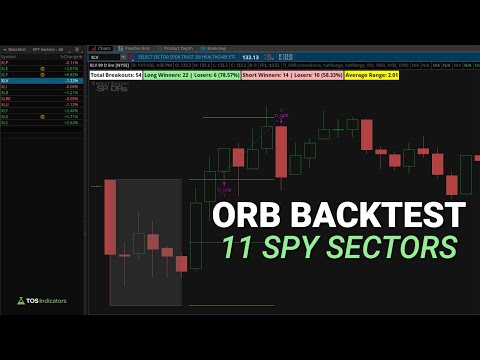
Opening Range Breakout Strategy Success Rate on SPY Sectors
Backtesting the ORB strategy across all 11 SPY sector ETFs. XLV (Health Care) and XLRE (Real Estate) produced the best results. Includes a deep dive into optimizing settings on the top-performing sector.

What Market Internals are Telling Us About Tomorrow
Learn how to read NYSE TICK, Advance-Decline, and Up/Down Volume data at the close to build a next-day directional bias. Includes ThinkScript code for ThinkOrSwim dashboards, scoring frameworks, and a nightly preparation routine.

Do Starbucks Holiday Drinks Increase The Stock Price?
Examining whether Starbucks holiday drink season creates a tradeable seasonal pattern in SBUX stock. Focus on October-November window, absolute vs. relative returns, earnings alignment, and technical confirmation.
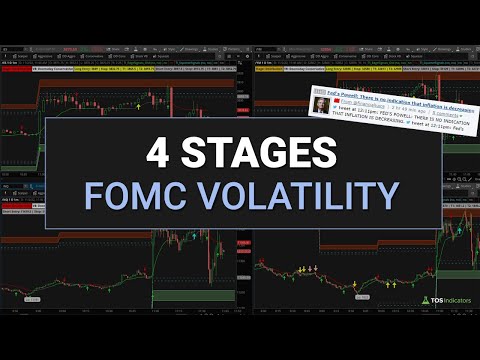
The 4 Stages of FOMC Volatility for Day Trading
Master the 4 stages of FOMC day volatility, from pre-announcement compression to directional resolution. Data shows ~65% of initial FOMC moves reverse by close, with 40-60% wider ranges than normal days. Includes stage-by-stage strategies, ThinkScript code, risk rules, and Volatility Box integration for day trading Fed announcements.
S&P 500 November Seasonality Patterns in Bear Markets
Analyzing S&P 500 November seasonality using two free ThinkOrSwim indicators. November closes higher 80% of the time with a 1.88% average gain, but 9 of 11 sectors are in deceleration.

NYSE TICK Divergences – Price and Market Internals Clues
Learn how NYSE TICK divergences with price action provide powerful trading clues. Covers bullish and bearish TICK divergences, ThinkOrSwim indicator setup, entry timing, and combining TICK divergences with other market internals for day trading.

Should You Trade During the Lunch Time Hour?
Data analysis of lunch hour trading (11:30 AM to 1:30 PM ET) showing why volume drops 40%, false breakouts spike, and how to filter thinkorswim signals by time of day with ThinkScript code.
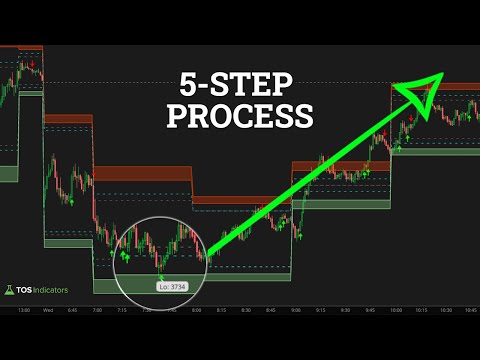
How To Identify Intraday Reversals (5-Step Process)
Learn a systematic 5-step process to identify intraday reversals using volatility levels, market internals, price action, and volume confirmation. Includes ThinkScript code and real examples.

Opening Range Breakout Strategy Success Rate on NFLX
How to apply the Opening Range Breakout (ORB) strategy to Netflix (NFLX) stock. Covers why NFLX is a strong ORB candidate, how to backtest across timeframes, and key factors affecting performance.

Do Larger Time Frames Reduce False Signals?
Examining whether larger timeframes reduce false signals for TTM Squeeze, moving average crossovers, and RSI. Higher timeframes contain more data per candle, reducing noise. Multi-timeframe approach balances quality with frequency.

Anchored VWAP – March 2020 vs. June 2022
Comparative analysis using Anchored VWAP from two major market pivots: the COVID crash low in March 2020 and the bear market low in June 2022, with ThinkScript code for thinkorswim implementation.
Day Trade Volatility With These 3 Setups
3 volatility day trading setups for ThinkOrSwim: VIX spike fade, TTM Squeeze breakout, and morning range expansion. Includes ThinkScript dashboard code, ATR position sizing formula, and pre-trade volatility checklist.
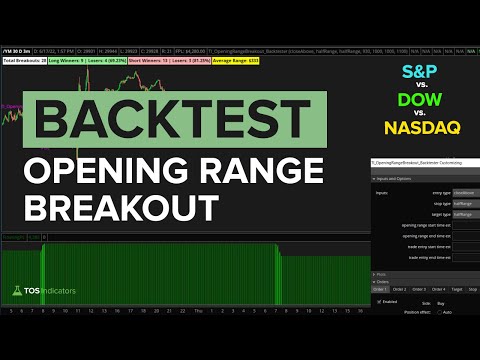
Opening Range Breakout Strategy Success Rate on Indices
Backtesting the ORB strategy across S&P, Dow, NASDAQ, and Russell index futures. The Dow ranks first with $4,280 P&L and 81% short-side win rate. The S&P is second. Optimal settings: close above, half range stop, half range target.

Hourly Volatility Models for Stocks – Demo on FDX and UPS
Every stock has a volatility fingerprint. Even two companies in the same sector, shipping the same packages, reporting on the same cycle, will trade with...

Trend Trading – Early Trend Signs
Most traders recognize a trend after it has already delivered 60% or more of its move. By that point, the risk-reward ratio has degraded and the stop...

Bear Market Relief Rally – A Deep Dive in SPY, QQQ, DIA, and IWM
Analysis of bear market relief rallies across SPY, QQQ, DIA, and IWM. Covers historical data from 2022, 2008, and 2020 including rally duration, magnitude, triggers, and how to distinguish relief rallies from genuine reversals. Includes ThinkScript code for relief rally detection on thinkorswim.
Hourly Volatility Models for Stocks – Demo on WMT
Walmart (WMT) trades differently from nearly every other mega-cap stock in the S&P 500. With a beta coefficient hovering around 0.67, this consumer...

Hourly Volatility Models for Stocks – Demo on ETFs
Every ETF trades during the same market hours, but the distribution of volatility across those hours is wildly different depending on the underlying asset...

Hourly Volatility Models for Stocks – Demo on AAPL
<span class="stat-value" style="display:block;font-size:2rem;font-weight:700;color:#00d4ff

What Moving Average Pullback is Best for Trend Days?
Moving average pullback backtester on S&P futures trend days. 21 EMA pullback-only with 5 ATR target and 4 ATR stop produced the best P&L at $8,891.61. Wider stops won across the board.

What Moving Average Pullback is Best for QQQ 5-MIN Chart?
<span class="stat-value" style="display:block;font-size:2rem;font-weight:700;color:#1a73e8;"

TSLA: Price Action Review (15-Minute Bar by Bar)
Detailed bar-by-bar price action analysis of Tesla (TSLA) on a 15-minute chart. Walks through a full trading session showing how to read candle structure, volume patterns, support/resistance levels, and key decision points with ThinkScript indicators.

S&P 500: Price Action Review (5-Minute Bar by Bar)
A detailed bar-by-bar walkthrough of 5-minute price action on the S&P 500, covering how to read individual bars, identify micro-structure patterns, and build a real-time session narrative for intraday trading.
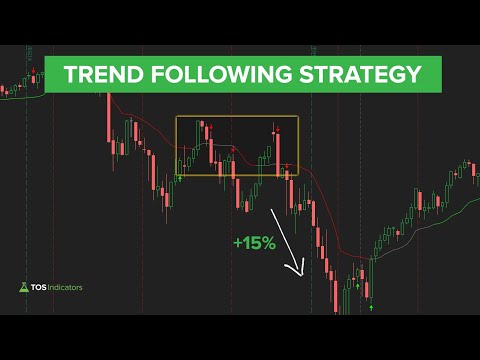
Trend Following Strategy – Walkthrough and Examples in S&P 500
S&P 500 trend following backtest over 20 years shows 9.8% annualized returns with a -22.4% max drawdown, a 33% reduction versus buy-and-hold. Includes ThinkOrSwim setup, ThinkScript scanner code, and position sizing formulas.

How to Trade the Day of Earnings with the Smarter Earnings Indicator
A data-driven guide to trading earnings day using the Smarter Earnings indicator on thinkorswim, covering IV crush mechanics, expected move calculations, pre-earnings strategies, post-earnings drift, and gap pattern analysis.

5 Oversold Indicators for ThinkOrSwim
Comparing 5 overbought/oversold signals on S&P VB zones. Edge signals was the clear winner: +7.25pts and +8/+23pts. RSI caught one trade the edge signal missed. V-score zones but no precision. Fischer too noisy. Market Pulse best for trend context.
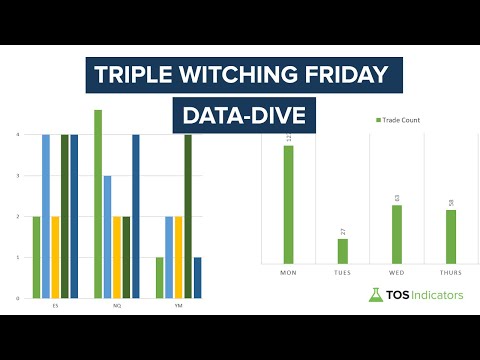
Triple Witching Friday: How Volatility Progresses Throughout the Day
Data-driven analysis of triple witching Friday volatility patterns. Covering the three-phase intraday structure. Morning range expansion, midday compression, and the end-of-day witching hour. Using Volatility Box measurements across both stocks and futures from 2015 through 2024.
