
Best ThinkorSwim Indicators: 15 Custom Studies Every Trader Needs
15 essential ThinkorSwim custom indicators for momentum, volume, trend, and volatility. Free ThinkScript code with setup guides and trading strategies.
- Why Custom ThinkorSwim Indicators Matter
- How to Add Custom Indicators to ThinkorSwim
- The 15 Best Custom Indicators for ThinkorSwim
- Best Indicator Combinations for Day Trading
- Best Indicator Combinations for Swing Trading
- Free vs Premium Indicators: What to Expect
- How to Customize Indicator Settings
- Common Mistakes When Using ThinkorSwim Indicators
- Frequently Asked Questions
- Next Steps: Building Your Indicator Setup
Published: April 2, 2026 | Last Updated: April 2, 2026
ThinkorSwim ships with hundreds of built-in studies, but the platform's real power lies in custom indicators. These custom ThinkScript-based tools let you see what default indicators cannot: volume anomalies, volatility compression zones, and institutional price levels that matter for your specific trading style.
We have built and tested over 100 custom indicators on ThinkorSwim since 2013. This guide covers the 15 most impactful studies based on actual trader feedback and backtested results across thousands of trades.
Why Custom ThinkorSwim Indicators Matter
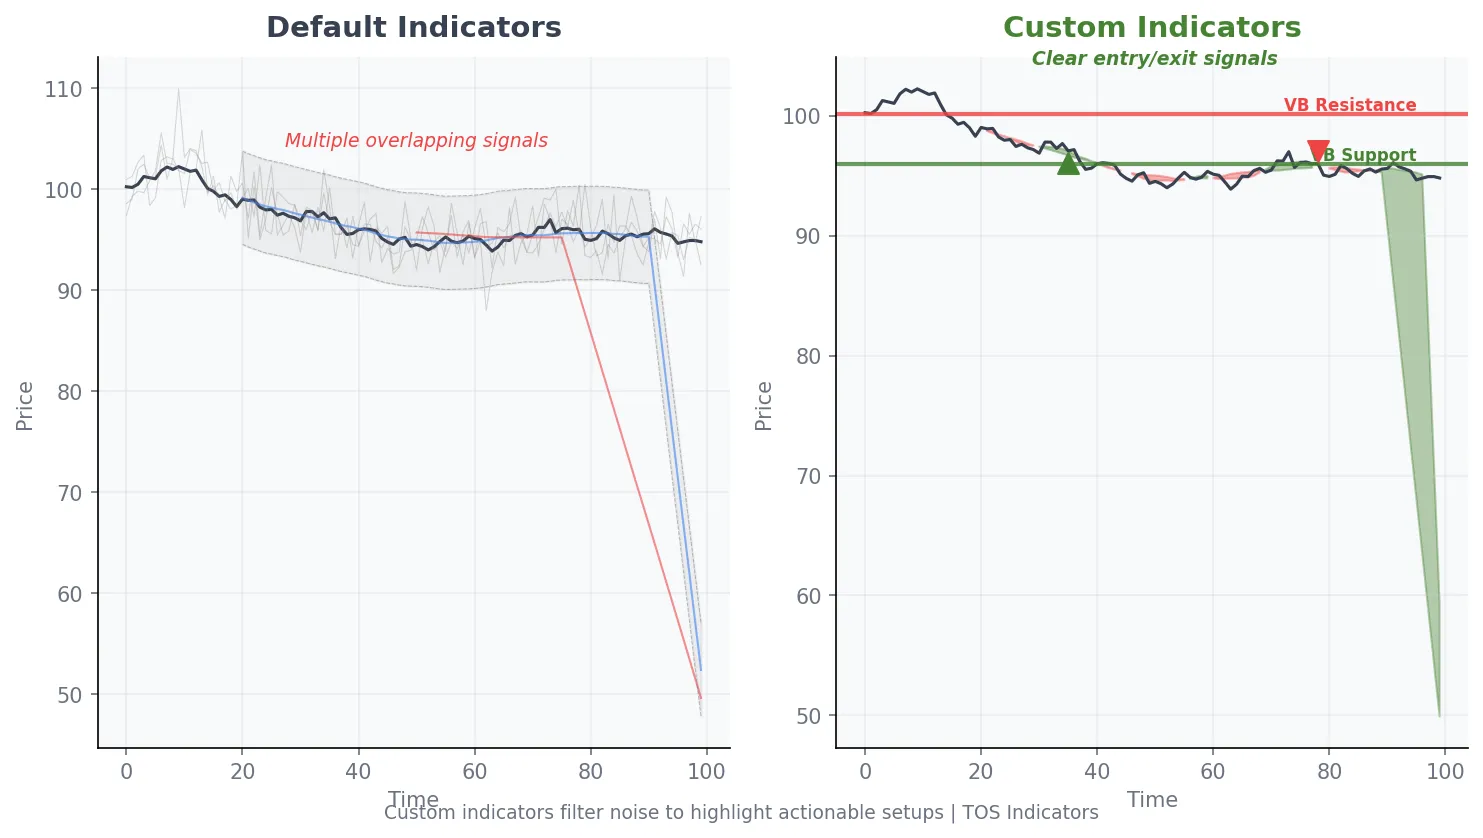
Default indicators show you the same information every other trader sees. Custom indicators filter noise and highlight setups that align with your edge. The difference between a profitable setup and a losing trade often comes down to confirmation signals that default tools miss entirely.
ThinkorSwim custom indicators are written in ThinkScript, a proprietary scripting language designed specifically for the platform. ThinkScript allows you to create studies, strategies, watchlist columns, and scanner filters that would be impossible with built-in tools alone.
How to Add Custom Indicators to ThinkorSwim
Adding custom indicators to ThinkorSwim takes less than 60 seconds. The process works the same whether you are installing a study, scanner filter, or watchlist column.
Open ThinkorSwim and navigate to the Charts tab. Right-click on the chart and select Studies, then Edit Studies. Click "Create" in the lower left corner. Name your study, paste the ThinkScript code, and click OK. The indicator will appear in your personal studies list for use on any chart.
For shared indicators like those in our indicator library, use the Setup dropdown and select "Open Shared Item." Paste the sharing link and the indicator loads automatically with all settings preserved.
The 15 Best Custom Indicators for ThinkorSwim
These indicators cover four categories: momentum, volume, trend identification, and volatility. We have organized them by use case so you can find what matches your trading style.
Momentum Indicators
1. TTM Squeeze Indicator
The TTM Squeeze identifies volatility compression before explosive moves occur. TTM Squeeze on ThinkorSwim signals when Bollinger Bands contract inside Keltner Channels, indicating a potential breakout setup. The momentum histogram shows directional bias when the squeeze fires.
We have found that squeeze signals combined with volume confirmation produce higher probability trades. The standard settings use 20-period Bollinger Bands with 2.0 standard deviations and 20-period Keltner Channels with 1.5 ATR multiplier.
2. Cumulative TICK Indicator
The Cumulative TICK aggregates NYSE TICK readings throughout the trading day. Cumulative TICK on ThinkorSwim reveals institutional buying and selling pressure that individual price bars cannot show. A rising cumulative TICK line with flat or declining price suggests accumulation.
This indicator works best for day traders watching S&P 500 stocks and index futures. Divergences between cumulative TICK and price action often precede 5-10 point moves on ES futures.
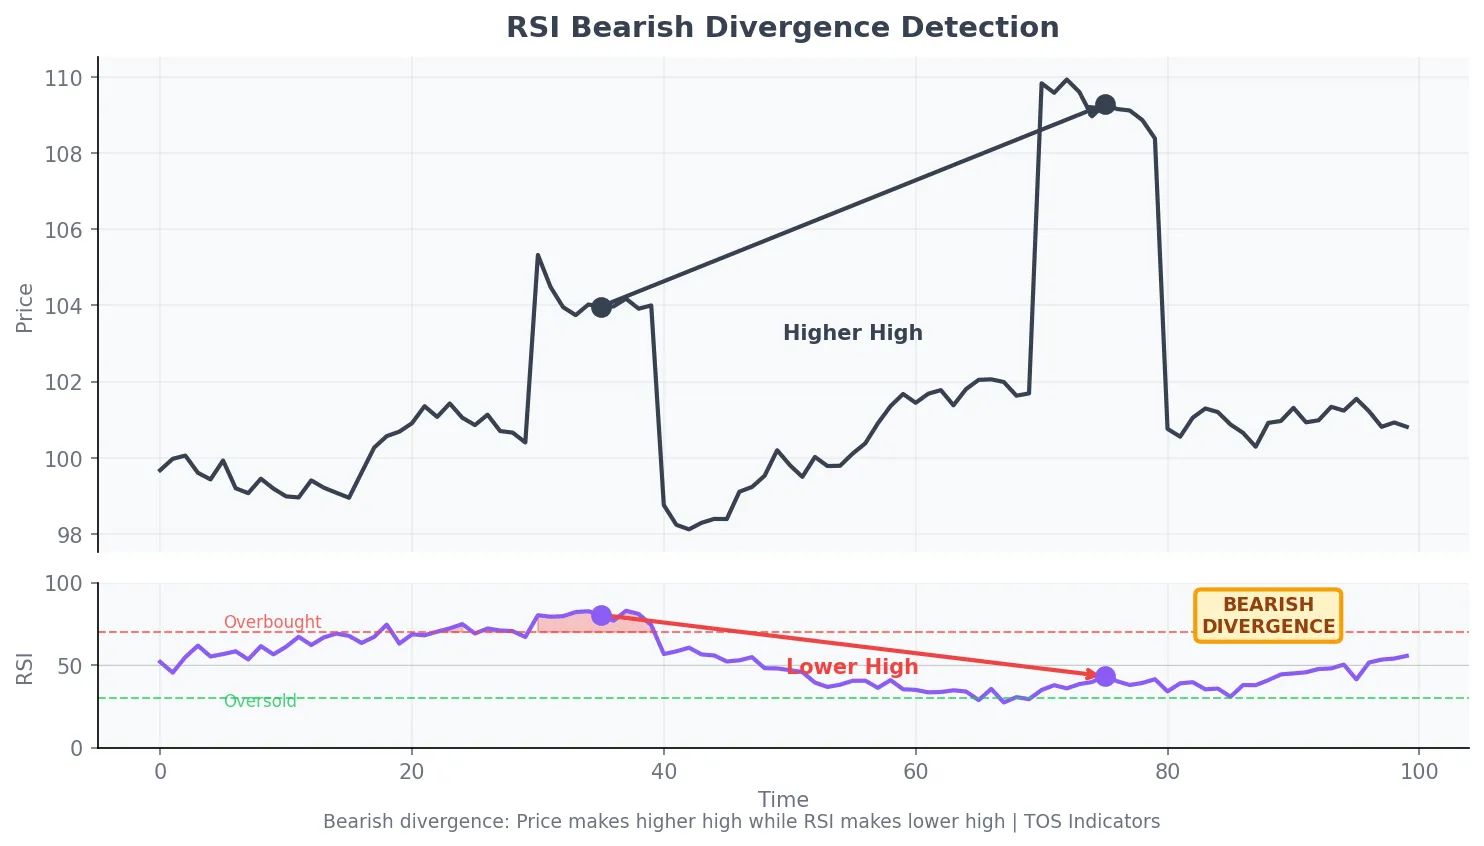
3. RSI with Divergence Alerts
Standard RSI shows overbought and oversold conditions. Our custom version adds automatic divergence detection, highlighting when price makes a new high but RSI makes a lower high. This setup often precedes reversals by 2-5 bars.
The indicator plots visual markers directly on the chart when bullish or bearish divergences form. Alert conditions trigger notifications so you do not have to watch every chart manually.
Volume Indicators
4. Relative Volume (RVOL)
Relative Volume compares current volume to average volume at the same time of day. RVOL on ThinkorSwim helps traders identify unusual activity before significant price moves. A stock with 3x RVOL in the first 30 minutes often trends strongly for the rest of the session.
We use RVOL thresholds of 1.5x for watchlist filtering and 2.5x for active trade consideration. The indicator accounts for time-of-day volume patterns, which is critical since pre-market and opening hour volume profiles differ significantly.
5. Volume Profile
Volume Profile shows where the most trading activity occurred at each price level. Volume Profile on ThinkorSwim creates horizontal histograms that reveal high-volume nodes (support/resistance) and low-volume gaps (areas where price moves quickly).
The Point of Control (POC) marks the price with the highest traded volume. Price tends to return to the POC when it drifts too far away, making it a reliable mean reversion target.
6. VWAP with Standard Deviation Bands
Volume Weighted Average Price represents fair value based on both price and volume. VWAP on ThinkorSwim with standard deviation bands creates dynamic support and resistance levels that institutional traders actively monitor.
The first standard deviation band contains roughly 68% of price action. Touches of the second standard deviation band often mark short-term exhaustion points where mean reversion trades become attractive.
Trend Identification Indicators
7. EMA Cloud Indicator
The EMA Cloud plots a filled area between two exponential moving averages. The EMA Cloud indicator on ThinkorSwim provides instant visual confirmation of trend direction. Green clouds indicate bullish trends; red clouds indicate bearish trends.
We recommend 8-period and 21-period EMAs for day trading, or 21-period and 55-period EMAs for swing trading. Cloud thickness indicates trend strength; thicker clouds suggest stronger momentum.
8. Opening Range Breakout (ORB)
The ORB indicator automatically plots the high and low of a customizable opening period. Opening Range Breakout on ThinkorSwim marks the first 15, 30, or 60 minutes as a reference zone for the trading session.
Our backtesting across 20 years of S&P 500 data shows that 30-minute opening range breakouts with volume confirmation produce win rates above 55% with favorable risk-reward ratios. The indicator includes ATR-based target extensions at 1x, 1.5x, and 2x the opening range size.
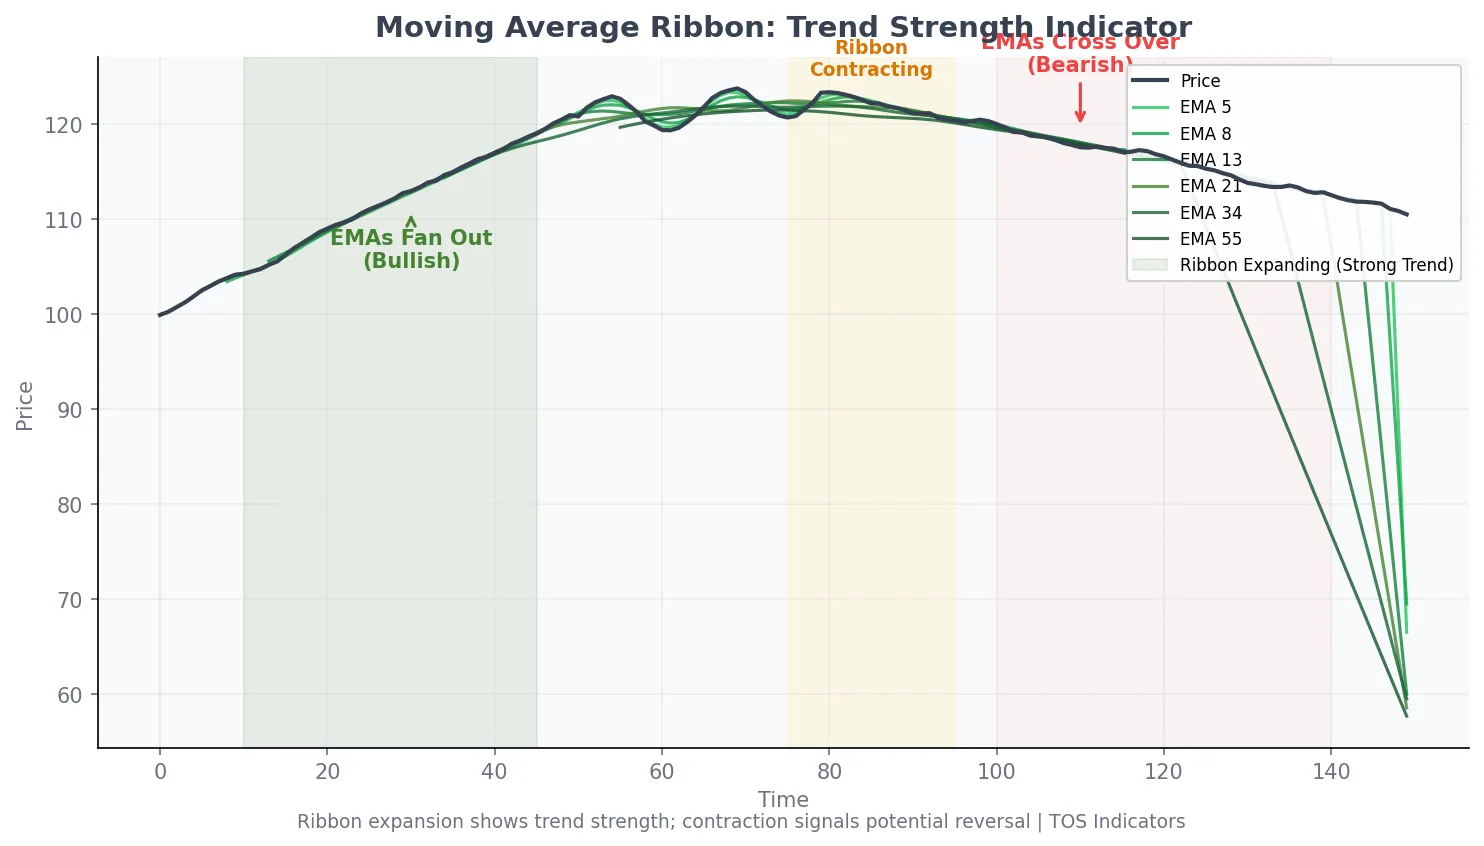
9. Moving Average Ribbon
The Moving Average Ribbon displays multiple EMAs simultaneously, creating a visual "ribbon" effect. Moving Average Ribbon on ThinkorSwim shows trend acceleration when ribbons fan out and potential reversals when they contract or cross.
Standard configuration uses 5, 8, 13, 21, 34, and 55-period EMAs. When all six averages stack in order with positive slopes, the trend is strong. Crossovers within the ribbon often precede trend changes.
Volatility Indicators
10. Keltner Channels with ATR Bands
Keltner Channels use Average True Range to create dynamic volatility envelopes around price. Keltner Channels on ThinkorSwim adapt to current volatility conditions, widening in volatile markets and narrowing in quiet markets.
Price touching the outer bands often signals short-term exhaustion. When combined with the TTM Squeeze, Keltner Channel width helps identify low-volatility consolidations that precede breakouts.
11. Volatility Box Levels
The Volatility Box calculates expected price ranges based on historical volatility patterns. Volatility Box levels on ThinkorSwim show where price is likely to find support and resistance based on statistical analysis of 20+ years of data.
These levels update daily and adapt to current market conditions. Traders use them as profit targets, stop loss references, and entry confirmation zones.
12. ATR Trailing Stop
The ATR Trailing Stop adjusts dynamically based on current volatility. ATR Trailing Stop on ThinkorSwim keeps you in trends longer during strong moves and tightens stops during choppy conditions.
Standard configuration uses a 14-period ATR with a 2x multiplier. The indicator plots a trailing line that moves with price in the direction of the trade but never moves against it.
13. Implied Volatility Rank (IVR)
IVR shows where current implied volatility stands relative to its 52-week range. IVR on ThinkorSwim helps options traders identify when premiums are rich (high IVR) or cheap (low IVR).
IVR above 50 suggests options premiums are elevated relative to recent history. This makes credit strategies more attractive. IVR below 30 favors debit strategies where you are buying options.
14. Market Pulse Breadth Indicator
Market Pulse aggregates advance/decline data, new highs/lows, and volume ratios into a single breadth reading. The Market Pulse indicator on ThinkorSwim shows whether the broader market supports or contradicts individual stock setups.
Strong readings above 60 suggest broad participation in rallies. Weak readings below 40 during market advances warn of potential reversals due to narrow leadership.
15. Fibonacci Cluster Indicator
The Fibonacci Cluster plots multiple Fibonacci retracements from different swing points simultaneously. Fibonacci Cluster on ThinkorSwim identifies confluence zones where multiple retracement levels overlap, creating stronger support and resistance areas.
Confluence zones with three or more overlapping Fibonacci levels tend to produce stronger reactions than single-level analysis. The indicator automatically detects swing highs and lows within a configurable lookback period.
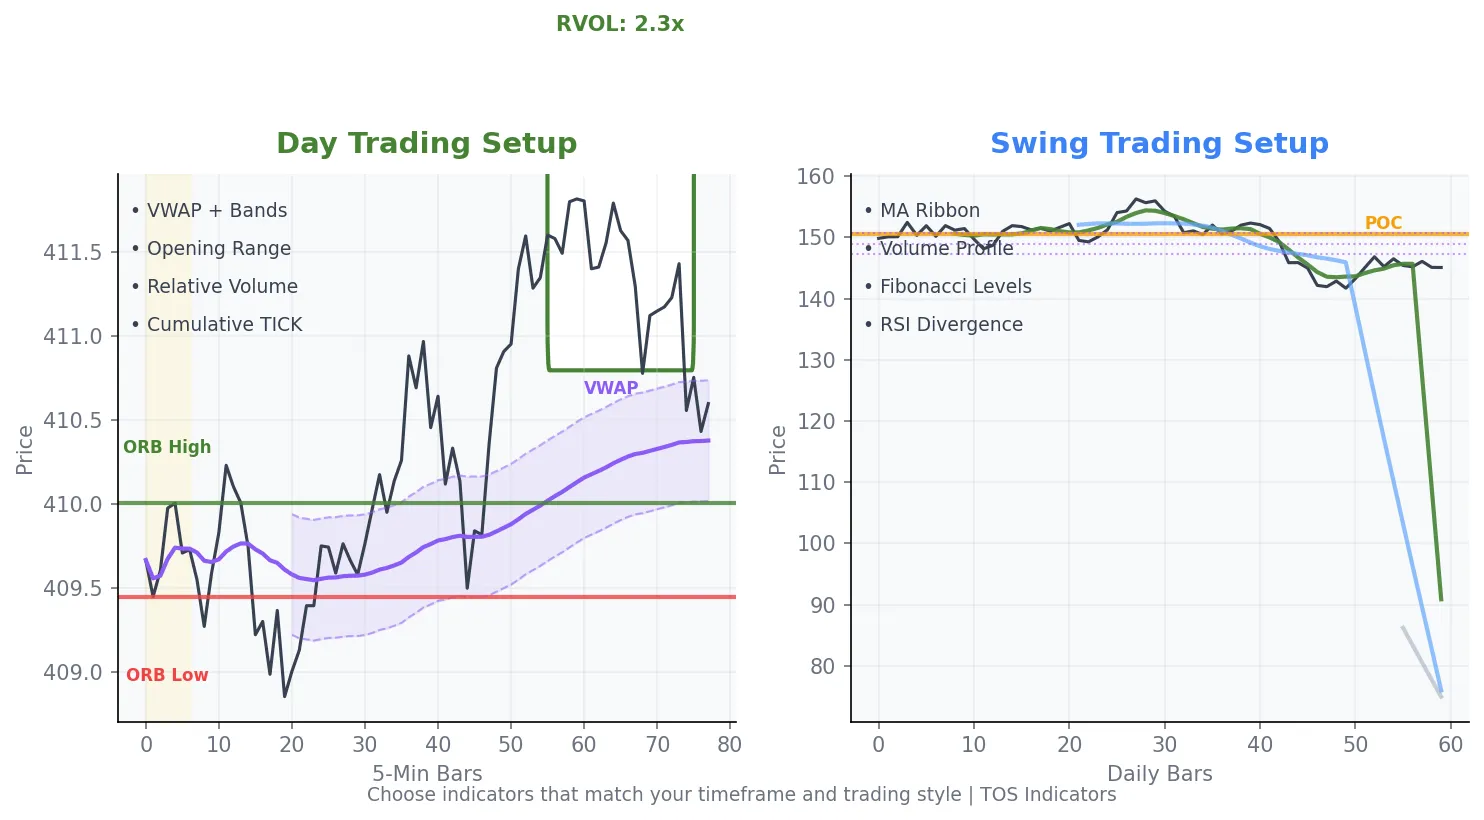
Best Indicator Combinations for Day Trading
Single indicators provide signals, but combinations filter false positives. We have found these pairings work well together for intraday trading on ThinkorSwim.
The RVOL plus VWAP combination identifies stocks with unusual volume trading near significant levels. RVOL above 2x combined with price approaching VWAP creates high-probability mean reversion setups.
The Cumulative TICK plus ORB combination confirms opening range breakouts with market internals. When cumulative TICK trends in the same direction as the breakout, follow-through rates improve significantly.
The TTM Squeeze plus EMA Cloud combination filters squeeze signals by trend direction. Only take squeeze breakouts in the direction of the EMA Cloud color to align with the dominant trend.
Best Indicator Combinations for Swing Trading
Swing traders need indicators that work on daily timeframes and filter out intraday noise. These combinations have performed well in our backtesting.
The MA Ribbon plus RSI Divergence combination catches trend exhaustion before major reversals. When RSI divergence forms while price trades into the MA ribbon, probability of reversal increases.
The Volume Profile plus Fibonacci Cluster combination identifies high-probability support and resistance zones. Areas where high-volume nodes coincide with Fibonacci confluence levels create strong reaction points.
Free vs Premium Indicators: What to Expect
Free ThinkorSwim indicators from our library cover most trading needs. They include studies for momentum, volume, and trend analysis with full ThinkScript code you can modify.
Premium indicators add features that require ongoing data or complex calculations. The Volatility Box, for example, requires daily recalculation of volatility levels across 595 stocks and 10 futures contracts. This computational intensity exceeds what a standalone indicator can provide.
Start with free indicators to learn what works for your trading style. Upgrade to premium tools when you need specific features like backtested levels, automated scanners, or real-time alerts across multiple symbols.
How to Customize Indicator Settings
Default indicator settings work for general use, but customization improves results for specific markets and timeframes. Here is how to approach optimization without curve-fitting.
Start with standard settings and trade them for at least 50 occurrences before changing parameters. This baseline shows you what the indicator does in real market conditions.
Adjust one parameter at a time. If you change the period from 14 to 20, observe results for another 50 trades before making additional changes. This isolates the impact of each modification.
Test settings across different market conditions: trending, ranging, high volatility, and low volatility. An indicator that only works in one condition will fail when conditions change.
Common Mistakes When Using ThinkorSwim Indicators
More indicators do not mean better trading. Charts cluttered with six or more indicators create analysis paralysis. Choose 2-3 complementary indicators and master their signals.
Avoid using multiple indicators that measure the same thing. RSI, Stochastic, and CCI all measure momentum. Pick one momentum indicator rather than three that give similar signals.
Do not ignore the larger timeframe context. A buy signal on a 5-minute chart means little if the daily chart shows a strong downtrend. Always check the next higher timeframe before acting on indicator signals.
Frequently Asked Questions
How do I add custom indicators to ThinkorSwim?
To add custom indicators to ThinkorSwim, open the Charts tab and right-click on any chart. Select Studies, then Edit Studies. Click "Create" to open the ThinkScript editor. Name your indicator, paste the code, and click OK. The new study appears in your custom studies list for use on any chart.
What are the best ThinkorSwim indicators for day trading?
The best ThinkorSwim indicators for day trading include VWAP with standard deviation bands, Relative Volume (RVOL), Cumulative TICK, and the Opening Range Breakout indicator. These tools help identify intraday momentum, volume anomalies, and key support and resistance levels that matter for short-term trades.
Are ThinkorSwim custom indicators free?
Many ThinkorSwim custom indicators are free. Our indicator library includes over 100 free ThinkScript studies covering momentum, volume, trend, and volatility analysis. Premium indicators exist for advanced features requiring daily data updates or complex calculations, but most traders start with free tools.
What is the TTM Squeeze indicator on ThinkorSwim?
The TTM Squeeze indicator on ThinkorSwim identifies volatility compression setups. It signals when Bollinger Bands contract inside Keltner Channels, indicating low volatility that often precedes explosive moves. The momentum histogram below the squeeze dots shows directional bias for the expected breakout.
How many indicators should I use on ThinkorSwim charts?
Use 2-3 complementary indicators on ThinkorSwim charts. Choose indicators that measure different aspects of price action, such as one momentum indicator, one volume indicator, and one trend indicator. More than 3-4 indicators creates clutter and analysis paralysis without improving trading decisions.
Can I create my own indicators in ThinkorSwim?
Yes, you can create custom indicators in ThinkorSwim using ThinkScript, the platform's built-in programming language. ThinkScript lets you build studies, strategies, watchlist columns, and scanner filters. The language uses functions similar to other programming languages with syntax designed specifically for financial analysis.
What is the difference between studies and strategies in ThinkorSwim?
Studies on ThinkorSwim display information on charts without generating orders. Strategies include buy and sell logic that can be backtested and paper-traded. Studies show you data like moving averages or RSI values. Strategies tell you when to enter and exit positions based on coded rules.
Next Steps: Building Your Indicator Setup
Start with one indicator from each category: momentum, volume, and trend. Trade this combination for 2-4 weeks before adding or removing anything. Document what works and what does not in a trading journal.
Visit our indicator library to download free ThinkScript studies. Each indicator includes installation instructions and recommended settings for different trading styles.
For traders who want pre-calculated levels based on 20+ years of volatility data, explore the Stock Volatility Box or Futures Volatility Box. These tools provide daily support and resistance levels that complement any indicator setup.


Ready to Trade With an Edge?
Join 40,000+ traders using institutional-grade tools for ThinkOrSwim.
Get the Bundle