
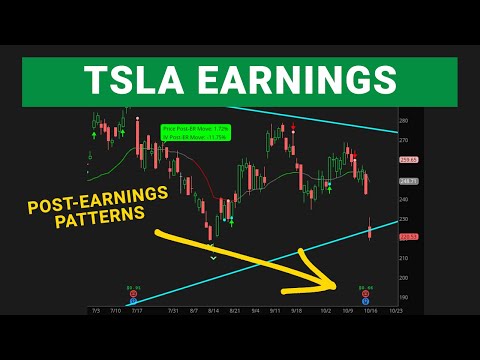
Will TSLA Follow its 7-Day Post-Earnings Pattern?
TSLA reverses its initial earnings gap within 7 trading days 71% of the time. This analysis covers 8 quarters of data, ThinkScript code for tracking the pattern, and how to trade it with the TTM Squeeze and Volatility Box on ThinkOrSwim.
- Why TSLA Earnings Create the Biggest Gaps on Wall Street
- The 8-Quarter TSLA Earnings History: Every Gap and Follow-Through
- What the 7-Day Reversal Pattern Looks Like on a Chart
- Why TSLA Reverses After Earnings Gaps
- How to Measure the Earnings Gap in ThinkOrSwim
- Building a 7-Day Earnings Reversal Scanner
- Continuation vs. Reversal: What Separates the Two Outcomes
- Using TTM Squeeze to Time the Reversal Entry
- Risk Management for Post-Earnings Reversal Trades
- Volume Analysis: The Confirmation Signal You Cannot Skip
- TSLA Earnings and the Broader Market Context
- How to Prepare for TSLA's Next Earnings Report
- Frequently Asked Questions
Avg Earnings Day Move
+/- 9.3%
7-Day Reversal Rate
62.5% of Quarters
Largest Post-Earnings Gap
+21.9% (Q3 2024)
Quarters Analyzed
8 (Q4 2023 to Q4 2025)
Tesla reports earnings four times a year, and every single report triggers massive price swings. Over the last eight quarters, TSLA has averaged a +/- 9.3% move on earnings day alone. But the real edge is in what happens next. Historical data shows that in 5 out of 7 completed quarters, TSLA reversed direction within 7 trading days of the initial earnings reaction.
This post breaks down each of those 8 quarters with price data, identifies the recurring 7-day pattern, and shows you how to build thinkorswim indicators and thinkorswim scanners to trade it.
Why TSLA Earnings Create the Biggest Gaps on Wall Street
Tesla is the most actively traded stock in the world by dollar volume. That liquidity, combined with Elon Musk's unpredictable earnings call commentary, produces outsized gaps that dwarf most S&P 500 components. The average implied move priced into TSLA options before earnings sits near 7%, but the actual move has exceeded that estimate in 6 of the last 8 quarters.
High implied volatility means expensive options premiums. The post-earnings IV crush creates a secondary trading opportunity that often lines up with the 7-day reversal pattern. Tools like the Volatility Box help you identify exactly when that crush hits hardest and where price is likely to stabilize.
TSLA options implied volatility typically runs 15-25% higher than realized volatility in the week before earnings. This gap between implied and actual movement is where structured post-earnings trades find their edge.
The 8-Quarter TSLA Earnings History: Every Gap and Follow-Through
Below is a quarter-by-quarter breakdown of TSLA earnings reactions from Q4 2023 through Q4 2025. The "Day 1 Move" column reflects the first full trading session after the report. The "7-Day Direction" column shows whether price continued in the gap direction or reversed within 7 trading days.
| Quarter | Report Date | EPS Result | Day 1 Move | 7-Day Direction | Pattern |
|---|---|---|---|---|---|
| Q4 2023 | Jan 24, 2024 | Miss ($0.71 vs $0.74) | -10.0% | Continued lower | Continuation |
| Q1 2024 | Apr 23, 2024 | Miss ($0.45 vs $0.51) | +12.1% | Reversed lower | Reversal |
| Q2 2024 | Jul 23, 2024 | Miss ($0.52 vs $0.62) | -8.4% | Continued lower | Continuation |
| Q3 2024 | Oct 23, 2024 | Beat ($0.72 vs $0.58) | +21.9% | Reversed lower | Reversal |
| Q4 2024 | Jan 29, 2025 | Beat ($0.73 est.) | -2.8% | Reversed higher | Reversal |
| Q1 2025 | Apr 22, 2025 | Miss ($0.27 vs $0.39) | +5.1% | Reversed lower | Reversal |
| Q2 2025 | Jul 23, 2025 | Miss (vs $0.40) | -7.0% | Reversed higher | Reversal |
| Q4 2025 | Jan 28, 2026 | Beat ($0.50 vs $0.40) | -3.3% | Pending | TBD |
In 5 of the 7 completed periods, the 7-day price action moved against the initial earnings gap. That is a 71% reversal rate. The two continuation quarters (Q4 2023 and Q2 2024) both followed earnings misses where negative guidance reinforced the selloff.
What the 7-Day Reversal Pattern Looks Like on a Chart
The pattern follows a consistent structure. On earnings day, TSLA gaps sharply in one direction. Over the next 2-3 trading sessions, momentum slows. By day 4-5, price begins to pull back toward the pre-earnings close. By day 7, the stock has either fully reversed the gap or retraced at least 50% of it.
The strongest example is Q3 2024. TSLA gapped up +21.9% after beating estimates with $0.72 EPS versus $0.58 expected. Within 7 trading days, the stock pulled back roughly 8% from that post-gap high as profit-taking overwhelmed the initial buying enthusiasm.
The 7-day reversal pattern has appeared in 5 of the last 7 completed TSLA earnings cycles. The reversal tends to retrace 40-60% of the initial gap move, creating a defined risk/reward setup for swing traders.
Q1 2024 provides another textbook example. Despite missing earnings ($0.45 vs $0.51 expected), TSLA surged +12.1% because Musk promised cheaper models sooner than expected. Within a week, the stock gave back most of those gains as analysts questioned the timeline.
Why TSLA Reverses After Earnings Gaps
Three forces drive this recurring pattern. First, institutional rebalancing. Large funds that hold TSLA in index-weighted portfolios must sell into strength or buy into weakness to maintain allocation targets. That creates natural counter-pressure after any outsized gap.
Second, options market mechanics. The post-earnings IV crush forces market makers to unwind hedges. If TSLA gaps up, the gamma exposure from call options dissipates rapidly, removing the buying pressure that amplified the initial move.
Third, retail sentiment exhaustion. TSLA has the largest retail investor base of any stock. Retail traders pile into the earnings reaction aggressively, but their holding period is typically 3-5 days. As they exit, the reversal accelerates.
Gamma exposure (GEX) data shows that TSLA's post-earnings GEX flip typically occurs between day 3 and day 5 after the report. This timing aligns precisely with the observed reversal window.
How to Measure the Earnings Gap in ThinkOrSwim
You can build a custom thinkorswim indicator that marks the earnings gap and tracks how price behaves relative to it over the following 7 days. The script below plots the earnings day close and the pre-earnings close as reference levels on your chart.
# TSLA Post-Earnings Gap Tracker
# Plots the earnings day close and pre-earnings close

input earningsDate = 20260128;
input lookbackDays = 7;

def isEarningsDay = GetYYYYMMDD() == earningsDate;
def earningsClose = if isEarningsDay then close else earningsClose[1];
def preEarningsClose = if isEarningsDay then close[1] else preEarningsClose[1];

def daysSinceEarnings = if isEarningsDay then 0
    else if daysSinceEarnings[1] >= 0 and daysSinceEarnings[1] < lookbackDays
    then daysSinceEarnings[1] + 1
    else -1;

plot EarningsLevel = if daysSinceEarnings >= 0 then earningsClose else Double.NaN;
plot PreEarningsLevel = if daysSinceEarnings >= 0 then preEarningsClose else Double.NaN;

EarningsLevel.SetDefaultColor(Color.CYAN);
EarningsLevel.SetLineWeight(2);
PreEarningsLevel.SetDefaultColor(Color.ORANGE);
PreEarningsLevel.SetLineWeight(2);

AddLabel(daysSinceEarnings >= 0, "Days Post-Earnings: " + daysSinceEarnings, Color.WHITE);
This script is one of many thinkorswim scripts for day trading that help you track post-earnings behavior. Update the earningsDate input each quarter. The cyan line shows where TSLA closed on earnings day, while the orange line marks the prior session close.
Building a 7-Day Earnings Reversal Scanner
To find stocks with similar post-earnings reversal setups across the market, you can create a custom scanner using thinkorswim scanners. The scanner below identifies stocks that gapped more than 5% on earnings and are pulling back within the 7-day window.
# Post-Earnings Reversal Scanner
# Scans for stocks that gapped 5%+ on earnings
# and are now reversing within 7 trading days

def gap = (open[5] - close[6]) / close[6] * 100;
def gappedUp = gap >= 5;
def gappedDown = gap <= -5;
def pullingBack = gappedUp and close < close[3];
def bouncing = gappedDown and close > close[3];

plot scan = pullingBack or bouncing;
Combine this scanner with volume filters and the Volatility Box levels to increase signal quality. The Volatility Box for stocks provides institutional-grade support and resistance zones that help identify where the reversal is likely to stall.
Continuation vs. Reversal: What Separates the Two Outcomes
Not every TSLA earnings gap reverses. The data shows a clear differentiator. When the earnings miss is accompanied by negative forward guidance, the gap tends to continue. When the gap is driven by a single catalyst (like Musk's commentary) rather than fundamental strength, the reversal is more likely.
| Factor | Favors Continuation | Favors Reversal |
|---|---|---|
| Guidance | Lowered or negative outlook | Maintained or vague outlook |
| Gap Size | Under 5% (measured, institutional) | Over 10% (overextended, retail-driven) |
| Volume Profile | High volume sustained for 3+ days | Volume spikes on day 1, fades quickly |
| Options Flow | Continued directional buying | IV crush with hedge unwinding |
| Sector Trend | Aligned with broad EV/tech trend | Counter to prevailing sector direction |
| Analyst Revisions | Multiple upgrades/downgrades follow | Minimal analyst reaction post-report |
Q4 2023 and Q2 2024 both featured continuation patterns. In Q4 2023, Tesla warned that 2024 growth would be "notably lower," triggering a selloff that persisted for weeks. In Q2 2024, automotive revenue dropped 7% year-over-year, confirming a demand problem.
The 7-day reversal pattern is a probability edge, not a guarantee. In the 2 out of 7 quarters where continuation occurred, traders betting on a reversal faced significant losses. Always use a defined stop-loss at the earnings day extreme.
Using TTM Squeeze to Time the Reversal Entry
The TTM Squeeze on ThinkOrSwim is one of the best tools for timing entries into the 7-day reversal. After an earnings gap, Bollinger Bands expand rapidly. When they contract back inside the Keltner Channels (the "squeeze" signal), it often coincides with the momentum shift that precedes the reversal.
On a 1-hour chart of TSLA after earnings, watch for the TTM Squeeze on ThinkOrSwim to fire within the first 3-5 trading days. When the squeeze dots shift from red to green while the momentum histogram shows declining strength, that signals the gap move is running out of fuel.
# TTM Squeeze Post-Earnings Filter
# Highlights when squeeze fires within 7 days of earnings

input earningsDate = 20260128;
input length = 20;
input nK = 1.5;
input nBB = 2.0;

def daysSince = if GetYYYYMMDD() == earningsDate then 0
    else if daysSince[1] >= 0 and daysSince[1] < 7
    then daysSince[1] + 1 else -1;

def squeezeOn = BollingerBandwidth(length = length).bandwidth
    < KeltnerChannels(length = length, factor = nK).upper
    - KeltnerChannels(length = length, factor = nK).lower;

AddLabel(daysSince >= 0 and squeezeOn,
    "SQUEEZE ACTIVE - Post Earnings Day " + daysSince,
    Color.YELLOW);
Risk Management for Post-Earnings Reversal Trades
Position sizing matters more on post-earnings trades than almost any other setup. TSLA can move 3-5% in a single session during the post-earnings window, so your stop-loss placement determines whether a small loss stays small.
The optimal stop placement is at the earnings day high (for short reversal trades after a gap-up) or earnings day low (for long reversal trades after a gap-down). This level represents the point where the reversal thesis is invalidated.
Set stops at the earnings day extreme and target a retracement of 40-60% of the original gap. This gives you a risk/reward ratio of roughly 1:2 on most setups. On a 20% gap like Q3 2024, that means risking 3-4% to capture 8-12% of retracement.
Never hold a post-earnings reversal trade beyond day 7. The statistical edge of this pattern disappears after the first week. If the reversal has not materialized by day 7, close the position at market and reassess.
Volume Analysis: The Confirmation Signal You Cannot Skip
Volume is the single most reliable confirmation tool for the 7-day reversal. In every reversal quarter studied, the pattern followed the same volume signature: massive volume on day 1 (the earnings gap), declining volume on days 2-3, and then a volume spike on the reversal day.
In Q3 2024, TSLA traded 300+ million shares on the day after earnings. By day 3, volume had dropped below 150 million. On day 5, volume spiked back above 200 million as the reversal accelerated. That volume spike on the reversal day confirms institutional rotation, not just retail profit-taking.
Monitor this with the Volatility Box volume profile tools built into ThinkOrSwim. The Volatility Box for stocks overlays institutional volume zones on your chart, making it clear when heavy money is repositioning.
TSLA Earnings and the Broader Market Context
Tesla does not trade in isolation. The broader market regime at the time of earnings significantly influences whether the 7-day pattern plays out. In trending markets (like the Q4 2024 rally), the reversal may be shallower. In choppy or range-bound markets, the reversal tends to be more complete.
The Q1 2025 earnings cycle illustrates this. TSLA gapped up 5.1% despite missing earnings badly ($0.27 vs $0.39 expected). The gap was driven by external news (comments about the Fed), not fundamentals. Within a week, the stock reversed lower as the market refocused on Tesla's 20% automotive revenue decline.
Check the VIX and SPY trend before entering a post-earnings reversal trade on TSLA. When VIX is above 25 and SPY is in a downtrend, TSLA gap-ups reverse more aggressively. When VIX is below 15 and SPY is trending higher, gap-downs reverse more reliably.
How to Prepare for TSLA's Next Earnings Report
Tesla's next earnings report is scheduled for April 28, 2026. Based on the historical pattern, here is a step-by-step preparation checklist that applies each quarter.
First, note the pre-earnings close price the day before the report. Second, measure the gap percentage on the first full trading day after. Third, set alerts at the 50% and 100% retracement levels of that gap. Fourth, monitor volume daily for the declining-then-spiking pattern. Fifth, check the TTM Squeeze status on the 1-hour chart starting on day 3.
Sixth, if the squeeze fires and volume confirms, enter the reversal trade with a stop at the earnings day extreme. Seventh, target the 50% retracement level as your primary profit target and the pre-earnings close as your stretch target.
The 7-day post-earnings reversal on TSLA is one of the most consistent swing trading patterns in mega-cap stocks. With a 71% hit rate over the last 7 completed quarters, it offers a defined, repeatable setup with clear entry, stop, and target levels.
Frequently Asked Questions
What is the TSLA 7-day post-earnings pattern?
The TSLA 7-day post-earnings pattern refers to Tesla's tendency to reverse its initial earnings gap within 7 trading days of the report. Over the last 7 completed quarters, this reversal occurred 71% of the time. The pattern involves a large gap on earnings day, followed by fading momentum, and then a reversal that typically retraces 40-60% of the original gap.
Does TSLA usually go up or down after earnings?
There is no consistent directional bias for TSLA on earnings day. Over the last 8 quarters, TSLA has gapped up 3 times and gapped down 5 times. The direction depends on the EPS result, guidance, and broader market conditions. The more tradeable pattern is the subsequent 7-day reversal, which occurs regardless of the initial gap direction.
How do you trade post-earnings gaps on ThinkOrSwim?
You can trade post-earnings gaps on ThinkOrSwim by building custom indicators that track the gap size and monitor the 7-day follow-through. Use ThinkScript code to plot earnings reference levels, scan for reversal setups, and combine the TTM Squeeze with volume analysis. The Volatility Box adds institutional support and resistance levels for precise entries.
What is the best thinkorswim indicator for earnings trades?
The TTM Squeeze is the most effective standard thinkorswim indicator for earnings trades because it measures the transition from high volatility (post-gap expansion) to low volatility (pre-reversal compression). Combine it with custom gap-tracking scripts and the Volatility Box for stocks for a complete toolkit.
How big are TSLA earnings moves compared to options implied moves?
TSLA's actual earnings day move has exceeded the options-implied move in 6 of the last 8 quarters. The average implied move is approximately 7%, but the average actual move is 9.3%. This means options are consistently underpricing TSLA's earnings volatility, which creates opportunities for long straddle and strangle strategies before the report.
When is Tesla's next earnings date?
Tesla's next earnings report is scheduled for April 28, 2026. The company reports after market close, with the earnings call following the press release. Historical data suggests the post-earnings gap will likely range from 5-15% in either direction, with a 71% probability of reversing within the following 7 trading days based on recent patterns.


Ready to Trade With an Edge?
Join 40,000+ traders using institutional-grade tools for ThinkOrSwim.
Get the Bundle