
Trend Shift Scanner: Catch Reversals at the Inflection Point
Identify early trend reversals with MACD momentum shifts, ADX/DMI crossovers, and volume confirmation. Free ThinkScript code included.
- What Is the Trend Shift Scanner?
- How the Trend Shift Scanner Works
- How to Add the Trend Shift Scanner to ThinkorSwim
- ThinkScript Code: Trend Shift Scanner (Free Version)
- Understanding the Indicator Settings
- Trading Strategy: How to Use Trend Shift Signals
- Combining Trend Shift Scanner with Other Indicators
- Pro Version Features
- Building a Trend Shift Scanner in ThinkorSwim
- Real Trade Examples
- Frequently Asked Questions
- FAQ
- Key Takeaways
Published: March 27, 2026 | Last Updated: March 27, 2026
Most traders catch trend reversals too late. By the time the new trend is "obvious," the has already been made. The Trend Shift Scanner solves this by combining MACD momentum shifts with ADX/DMI crossovers and volume confirmation to identify reversals at the inflection point, not after the fact.
Learn more: Early Trend Shifts and S&P 500 Volatility
Learn more: Options Pricing and Volatility Reversals – NET,...
Learn more: 3×8 EMA Pattern to Catch Reversals (With Examples)
This indicator fires when three conditions align: the MACD histogram changes direction, the Directional Movement Index confirms with a crossover, and volume surges above average. These three factors together create a high-probability signal that the current trend is losing steam and a new one is beginning.
What Is the Trend Shift Scanner?
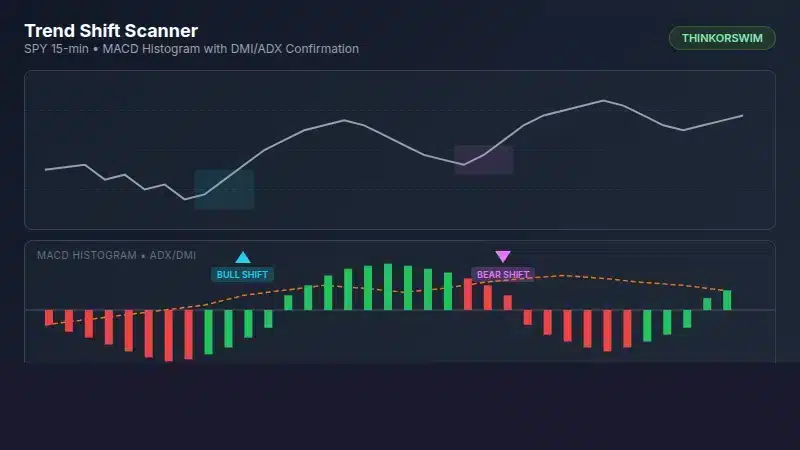
The Trend Shift Scanner is a lower-panel indicator that identifies early trend reversals by detecting momentum shift points. Instead of waiting for moving average crossovers or price to break support/resistance, this indicator catches the moment when buying or selling pressure begins to change direction.
The indicator displays:
- MACD Histogram: Color-coded bars showing momentum direction and slope (green = rising momentum, red = falling momentum).
- Cyan Up Arrows: Bullish trend shift detected (momentum turning up from negative territory with DMI confirmation).
- Magenta Down Arrows: Bearish trend shift detected (momentum turning down from positive territory with DMI confirmation).
- ADX Line: Orange dashed line showing trend strength (scaled to fit the histogram panel).
- Status Labels: Real-time ADX, +DI, -DI values plus volume surge alerts.
The key insight: a trend shift is not just about momentum changing. It requires confirmation from directional movement (who is winning, buyers or sellers?) and volume (does the market care?). All three must align for a valid signal.
How the Trend Shift Scanner Works
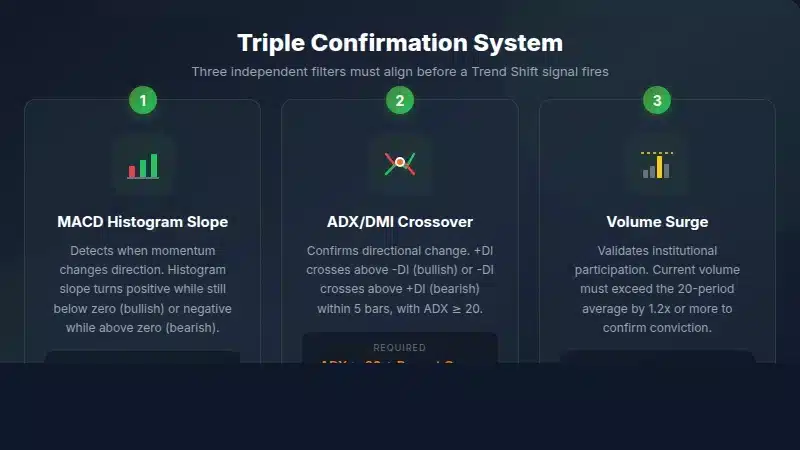
The indicator combines three independent confirmation systems. Each system answers a different question about market structure:
1. MACD Histogram Slope Change
The MACD histogram measures momentum by subtracting the signal line from the MACD line. When the histogram slope changes from negative to positive (bars start getting taller after getting shorter), momentum is shifting. This is the earliest signal of a potential trend change.
We look for histogram turning points specifically when the histogram is on the "wrong side" of zero. A bullish signal requires the histogram to turn up while still negative. A bearish signal requires it to turn down while still positive. This catches the shift before the histogram even crosses zero.
2. ADX/DMI Crossover Confirmation
The Directional Movement Index shows who is winning: buyers (+DI) or sellers (-DI). The ADX measures trend strength regardless of direction. For a valid trend shift:
- ADX must be above the threshold (default 20) to confirm a real trend exists
- A DMI crossover must have occurred within the lookback period (default 5 bars)
- +DI crossing above -DI confirms bullish shift; -DI crossing above +DI confirms bearish shift
3. Volume Surge Validation
Volume confirms that institutional traders are participating. A trend shift on low volume often fails. The indicator requires volume to exceed the 20-period average by 1.2x (adjustable) for a valid signal. High volume at a turning point indicates conviction behind the move.
How to Add the Trend Shift Scanner to ThinkorSwim
Follow these steps to install the indicator:
- Open ThinkorSwim and go to any chart.
- Click the Studies button (beaker icon) in the upper right corner.
- Select Edit Studies from the dropdown menu.
- In the Edit Studies window, click Create in the lower left.
- Name the study "TrendShiftScanner" and click OK.
- Delete any default code in the thinkScript editor.
- Paste the complete code provided below.
- Click OK to save, then Apply to add it to your chart.
The indicator will appear as a lower panel below your price chart. You will see the MACD histogram with signal arrows and status labels showing ADX and DMI values.
ThinkScript Code: Trend Shift Scanner (Free Version)
Here is the complete, compilable ThinkScript code. Copy and paste this into ThinkorSwim:
# Trend Shift Scanner - Free Version
# TOS Indicators - tosindicators.com
# Type: Indicator
# Category: indicators
#
# Identifies early trend reversals by combining:
# 1. MACD Histogram slope change (momentum shift)
# 2. ADX trend strength threshold
# 3. DMI crossover confirmation
# 4. Volume surge validation
#
# Buy Signal: MACD histogram turns up from negative, +DI crosses above -DI, volume above average
# Sell Signal: MACD histogram turns down from positive, -DI crosses above +DI, volume above average

declare lower;

# ============================================
# INPUTS
# ============================================
input macdFastLength = 12;
input macdSlowLength = 26;
input macdSignalLength = 9;
input adxLength = 14;
input adxThreshold = 20;
input volumeAvgLength = 20;
input volumeMultiplier = 1.2;

# ============================================
# MACD HISTOGRAM CALCULATIONS
# ============================================
def macdValue = ExpAverage(close, macdFastLength) - ExpAverage(close, macdSlowLength);
def macdSignal = ExpAverage(macdValue, macdSignalLength);
def macdHistogram = macdValue - macdSignal;

# Histogram slope: positive = rising, negative = falling
def histogramSlope = macdHistogram - macdHistogram[1];

# Detect histogram turning points
def histogramTurningUp = histogramSlope > 0 and histogramSlope[1] <= 0;
def histogramTurningDown = histogramSlope < 0 and histogramSlope[1] >= 0;

# ============================================
# ADX / DMI CALCULATIONS
# ============================================
def hiDiff = high - high[1];
def loDiff = low[1] - low;
def plusDM = if hiDiff > loDiff and hiDiff > 0 then hiDiff else 0;
def minusDM = if loDiff > hiDiff and loDiff > 0 then loDiff else 0;

def ATR = WildersAverage(TrueRange(high, close, low), adxLength);
def plusDI = 100 * WildersAverage(plusDM, adxLength) / ATR;
def minusDI = 100 * WildersAverage(minusDM, adxLength) / ATR;

def DX = if (plusDI + minusDI > 0) then 100 * AbsValue(plusDI - minusDI) / (plusDI + minusDI) else 0;
def ADX = WildersAverage(DX, adxLength);

# DMI crossover signals
def bullishDMICross = plusDI crosses above minusDI;
def bearishDMICross = minusDI crosses above plusDI;

# ============================================
# VOLUME CONFIRMATION
# ============================================
def avgVolume = Average(volume, volumeAvgLength);
def volumeSurge = volume >= avgVolume * volumeMultiplier;

# ============================================
# TREND SHIFT SIGNALS
# ============================================
# Bullish Trend Shift: histogram turning up + recent DMI cross + volume confirmation
def recentBullishDMI = Sum(bullishDMICross, 5) >= 1;
def bullishShift = histogramTurningUp and macdHistogram < 0 and recentBullishDMI and volumeSurge and ADX >= adxThreshold;

# Bearish Trend Shift: histogram turning down + recent DMI cross + volume confirmation
def recentBearishDMI = Sum(bearishDMICross, 5) >= 1;
def bearishShift = histogramTurningDown and macdHistogram > 0 and recentBearishDMI and volumeSurge and ADX >= adxThreshold;

# ============================================
# PLOTS
# ============================================
# Main histogram display
plot Histogram = macdHistogram;
Histogram.SetPaintingStrategy(PaintingStrategy.HISTOGRAM);
Histogram.DefineColor("Rising", Color.GREEN);
Histogram.DefineColor("Falling", Color.RED);
Histogram.AssignValueColor(if histogramSlope > 0 then Histogram.Color("Rising") else Histogram.Color("Falling"));

# Zero line
plot ZeroLine = 0;
ZeroLine.SetDefaultColor(Color.GRAY);
ZeroLine.SetStyle(Curve.SHORT_DASH);

# Signal arrows
plot BullishSignal = if bullishShift then macdHistogram else Double.NaN;
BullishSignal.SetPaintingStrategy(PaintingStrategy.ARROW_UP);
BullishSignal.SetDefaultColor(Color.CYAN);
BullishSignal.SetLineWeight(3);

plot BearishSignal = if bearishShift then macdHistogram else Double.NaN;
BearishSignal.SetPaintingStrategy(PaintingStrategy.ARROW_DOWN);
BearishSignal.SetDefaultColor(Color.MAGENTA);
BearishSignal.SetLineWeight(3);

# ADX reference line (shows when trend has enough strength)
plot ADXLine = ADX / 5;  # Scaled to fit histogram panel
ADXLine.SetDefaultColor(Color.ORANGE);
ADXLine.SetStyle(Curve.SHORT_DASH);
ADXLine.SetLineWeight(1);

# ============================================
# LABELS
# ============================================
AddLabel(yes, "ADX: " + Round(ADX, 1), if ADX >= adxThreshold then Color.GREEN else Color.GRAY);
AddLabel(yes, "+DI: " + Round(plusDI, 1), if plusDI > minusDI then Color.GREEN else Color.GRAY);
AddLabel(yes, "-DI: " + Round(minusDI, 1), if minusDI > plusDI then Color.RED else Color.GRAY);
AddLabel(volumeSurge, "Vol Surge", Color.YELLOW);
Understanding the Indicator Settings
The Trend Shift Scanner includes seven adjustable inputs. Here is what each one controls and recommended values for different trading styles:
| Parameter | Default | Day Trading | Swing Trading | Description |
|---|---|---|---|---|
| macdFastLength | 12 | 8-10 | 12 | Fast EMA period for MACD calculation |
| macdSlowLength | 26 | 17-21 | 26 | Slow EMA period for MACD calculation |
| macdSignalLength | 9 | 7-9 | 9 | Signal line EMA period |
| adxLength | 14 | 10-12 | 14 | Period for ADX/DMI calculations |
| adxThreshold | 20 | 15-18 | 20-25 | Minimum ADX value for valid signals |
| volumeAvgLength | 20 | 10-15 | 20 | Period for average volume calculation |
| volumeMultiplier | 1.2 | 1.0-1.2 | 1.2-1.5 | Required volume surge (1.2 = 20% above average) |
For day trading on 5-15 minute charts, use shorter periods to generate faster signals. For swing trading on daily charts, the defaults work well. Higher ADX thresholds reduce false signals but may miss some valid reversals.
Trading Strategy: How to Use Trend Shift Signals
The Trend Shift Scanner provides entry timing signals. Use this systematic approach for trading the signals:
Learn more: Module 3: Entry Criteria
Entry Rules
- Wait for a signal arrow: Cyan up arrow for bullish, magenta down arrow for bearish.
- Confirm trend context: Check the higher timeframe. A bullish shift on the 15-minute chart is stronger if the daily chart is also bullish.
- Enter on the next bar: Place your entry order after the signal bar closes. Do not chase; if price gaps significantly, wait for a pullback.
- Position size: Risk no more than 1-2% of account per trade.
Exit Rules
- Opposite signal: Exit when the opposite arrow appears (long exits on magenta arrow, short exits on cyan arrow).
- ADX collapse: If ADX drops below 15, the trend is weakening. Consider taking profits.
- Histogram zero cross: If the histogram crosses zero against your position, tighten your stop.
- Time stop: If no progress within 10-15 bars, consider exiting at breakeven.
Stop Loss Placement
Place stops below the recent swing low (for longs) or above the recent swing high (for shorts). A 1.5-2x ATR stop typically works well. The indicator catches early reversals, so stops should be tight enough to preserve capital if the shift fails.
Combining Trend Shift Scanner with Other Indicators
The Trend Shift Scanner works well as a standalone timing tool, but combining it with additional filters improves accuracy:
Trend Shift + VWAP
VWAP provides institutional context. For bullish shifts, require price to be above VWAP. For bearish shifts, require price to be below VWAP. This simple filter aligns your entries with the dominant institutional flow.
Trend Shift + Moving Average Envelope
Use a 20-period EMA with bands at +/- 1 ATR. Bullish shifts near the lower band offer better risk/reward than shifts in the middle. Bearish shifts near the upper band have more room to run.
Trend Shift + RSI
RSI adds oversold/overbought context. A bullish shift with RSI below 35 is higher probability than one with RSI at 50. The combination catches reversals from extreme conditions.
Pro Version Features
The Pro version of Trend Shift Scanner adds features for serious traders:
- Multi-Timeframe Confirmation: Only fires signals when the higher timeframe (daily by default) trend aligns with the signal direction.
- Signal Quality Scoring: Rates each signal from 1-5 based on histogram extremes, ADX strength, volume level, DMI spread, and MTF alignment.
- Configurable Sensitivity: Three modes (Aggressive, Normal, Conservative) adjust how quickly the indicator reacts.
- Sound and Email Alerts: Get notified when signals fire, with special alerts for high-quality (4+/5) signals.
- Built-in Backtester: Track win rate, average P/L, and trade count directly on the chart.
- Scanner-Ready Output: Includes boolean plots for direct use in ThinkorSwim stock scans.
Get the Pro Version: The Trend Shift Scanner Pro is available to Volatility Box members. Get multi-timeframe confirmation, signal quality scoring, alerts, and the built-in backtester.
Building a Trend Shift Scanner in ThinkorSwim
For traders who want to find stocks showing trend shifts across the entire market, you can convert this indicator into a scanner. Here is a simplified scanner version:
- Go to the Scan tab in ThinkorSwim.
- Click Add Study Filter.
- Select Custom and paste the following code:
# Trend Shift Scanner - Scan Version
# Use this as a custom study filter in ThinkorSwim Scanner

def macdValue = ExpAverage(close, 12) - ExpAverage(close, 26);
def macdSignal = ExpAverage(macdValue, 9);
def macdHistogram = macdValue - macdSignal;
def histogramSlope = macdHistogram - macdHistogram[1];
def histogramTurningUp = histogramSlope > 0 and histogramSlope[1] <= 0;

def hiDiff = high - high[1];
def loDiff = low[1] - low;
def plusDM = if hiDiff > loDiff and hiDiff > 0 then hiDiff else 0;
def minusDM = if loDiff > hiDiff and loDiff > 0 then loDiff else 0;
def ATR = WildersAverage(TrueRange(high, close, low), 14);
def plusDI = 100 * WildersAverage(plusDM, 14) / ATR;
def minusDI = 100 * WildersAverage(minusDM, 14) / ATR;
def DX = if (plusDI + minusDI > 0) then 100 * AbsValue(plusDI - minusDI) / (plusDI + minusDI) else 0;
def ADX = WildersAverage(DX, 14);

def bullishDMICross = plusDI crosses above minusDI;
def recentBullishDMI = Sum(bullishDMICross, 5) >= 1;

def avgVolume = Average(volume, 20);
def volumeSurge = volume >= avgVolume * 1.2;

plot scan = histogramTurningUp and macdHistogram < 0 and recentBullishDMI and volumeSurge and ADX >= 20 and close > 1 and volume > 100000;
This scanner finds stocks with bullish trend shifts. Modify the logic for bearish shifts by changing histogramTurningUp to histogramTurningDown and macdHistogram < 0 to macdHistogram > 0.
Real Trade Examples
Here are three scenarios where the Trend Shift Scanner provides high-value signals:
Use Case 1: Catching the Bottom of a Pullback
Stock is in a daily uptrend but has pulled back for several days. On the 15-minute chart, the Trend Shift Scanner fires a bullish signal when the pullback loses momentum. Entry near the pullback low offers excellent risk/reward with a tight stop below the swing low.
Use Case 2: Fading an Overextended Move
After a strong rally, the stock becomes extended above its moving averages. The Trend Shift Scanner fires a bearish signal as momentum peaks. Short entry at the exhaustion point with a stop above the high captures the mean reversion move.
Use Case 3: Breakout Confirmation
Stock breaks above resistance but you are unsure if it is a real breakout or a fake-out. A bullish Trend Shift signal after the breakout confirms that momentum is indeed shifting higher with volume. Enter on the signal with confidence.
Frequently Asked Questions
FAQ
What makes the Trend Shift Scanner different from regular MACD?
Regular MACD only shows momentum. The Trend Shift Scanner combines MACD histogram slope changes with ADX/DMI directional confirmation and volume validation. This triple confirmation reduces false signals by requiring momentum shift, directional change, and institutional participation to align before triggering.
What timeframe works best for the Trend Shift Scanner?
The indicator works on any timeframe, but 15-minute to daily charts provide the best signal quality. On timeframes shorter than 5 minutes, noise increases and false signals become more common. For scalping, use faster MACD settings (8/17/7) and a lower ADX threshold (15).
How do I reduce false signals?
Increase the ADX threshold from 20 to 25 to require stronger trends. Increase the volume multiplier from 1.2 to 1.5 to require larger volume surges. The Pro version adds multi-timeframe confirmation which further filters signals to only fire when aligned with the higher timeframe trend.
Can I use this indicator for options trading?
Yes. The Trend Shift Scanner identifies directional moves early, which is valuable for options entries. For call options, enter on bullish signals. For put options, enter on bearish signals. The early timing can improve your entry price compared to waiting for obvious trend confirmation. Consider ATM or slightly ITM options to reduce time decay risk.
What does the ADX line in the indicator show?
The orange dashed ADX line shows trend strength, scaled to fit in the histogram panel (divided by 5). When ADX is above the threshold (visible as a higher line position), trends are strong enough to trade. Low ADX indicates a ranging market where trend shift signals are less reliable. The ADX value is also displayed in the status label.
Why does the indicator require volume confirmation?
Volume confirms institutional participation. A momentum shift on low volume often fails because there is not enough buying or selling pressure to sustain the new direction. By requiring volume 20% above average (adjustable), the indicator filters out weak shifts that lack conviction. High volume at turning points indicates real money is behind the move.
How accurate is the Trend Shift Scanner?
Accuracy depends on market condition, timeframe, and parameter settings. The triple confirmation system (MACD slope change, DMI crossover, volume surge) filters out many false signals, but no indicator is perfect. Performance tends to be stronger in trending markets and weaker in choppy, range-bound conditions. The Pro version includes a built-in backtester so you can measure actual performance on your specific instruments and timeframes. Regardless of signal accuracy, risk management and position sizing remain essential.
Key Takeaways
- The Trend Shift Scanner identifies early trend reversals using three confirmation layers: MACD momentum shift, ADX/DMI crossover, and volume surge.
- Signals fire at inflection points before the new trend is obvious, giving you earlier entries than traditional indicators.
- Cyan up arrows mark bullish shifts (momentum turning up from negative territory); magenta down arrows mark bearish shifts.
- ADX must be above threshold (default 20) to confirm a tradeable trend exists.
- Volume surge requirement (20% above average) filters out weak signals lacking institutional participation.
- Combine with VWAP, moving averages, or RSI for additional confirmation.
- The Pro version adds multi-timeframe confirmation, signal quality scoring, alerts, and a built-in backtester.
The Trend Shift Scanner gives you an edge by catching reversals at the moment they begin, not after the move has already happened. Add it to your ThinkorSwim charts and start identifying trend shifts with confidence. For more ThinkorSwim indicators and trading tools, explore our full indicator library.

Ready to Trade With an Edge?
Join 40,000+ traders using institutional-grade tools for ThinkOrSwim.
Get the Bundle