
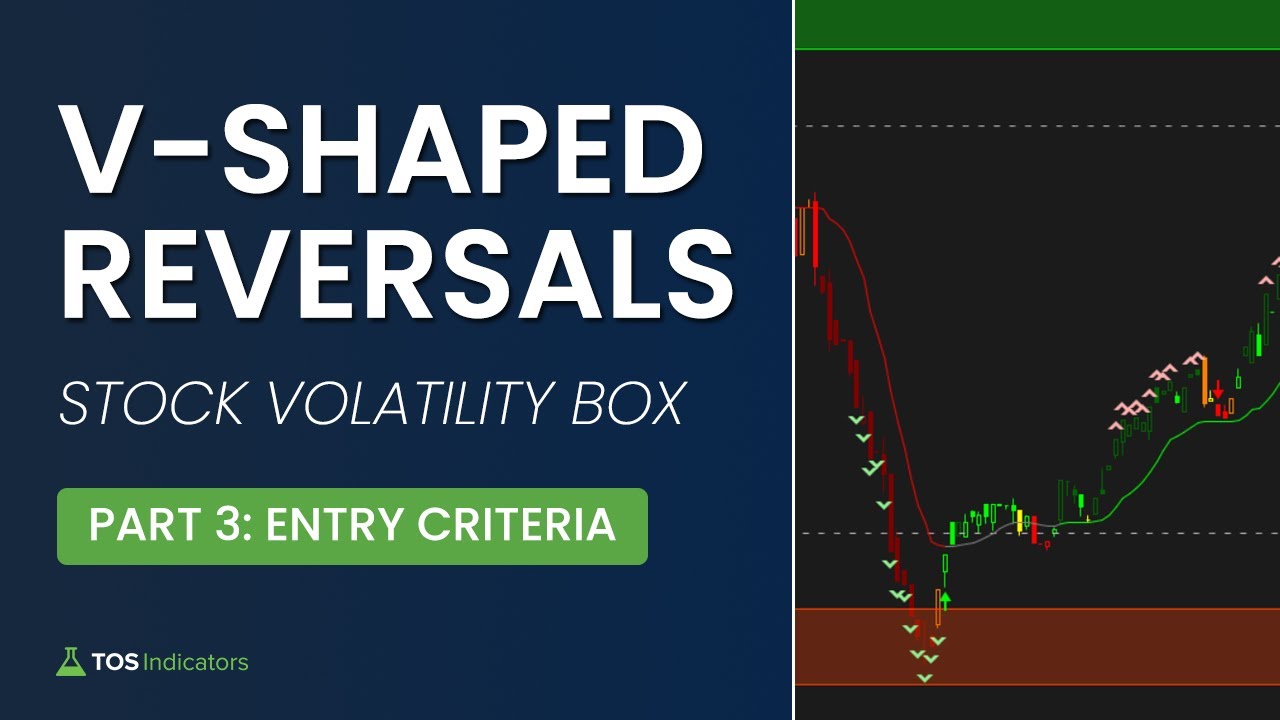
How to Find V-Shaped Reversals
3-Step Process to Find V-Shaped Reversals
In this part, I'd like to break down everything about the entry for this particular setup.
It can be boiled down to a simple 3-step process:
- Step 1: Pick and choose stocks from Live Scanner (or choose all of them)
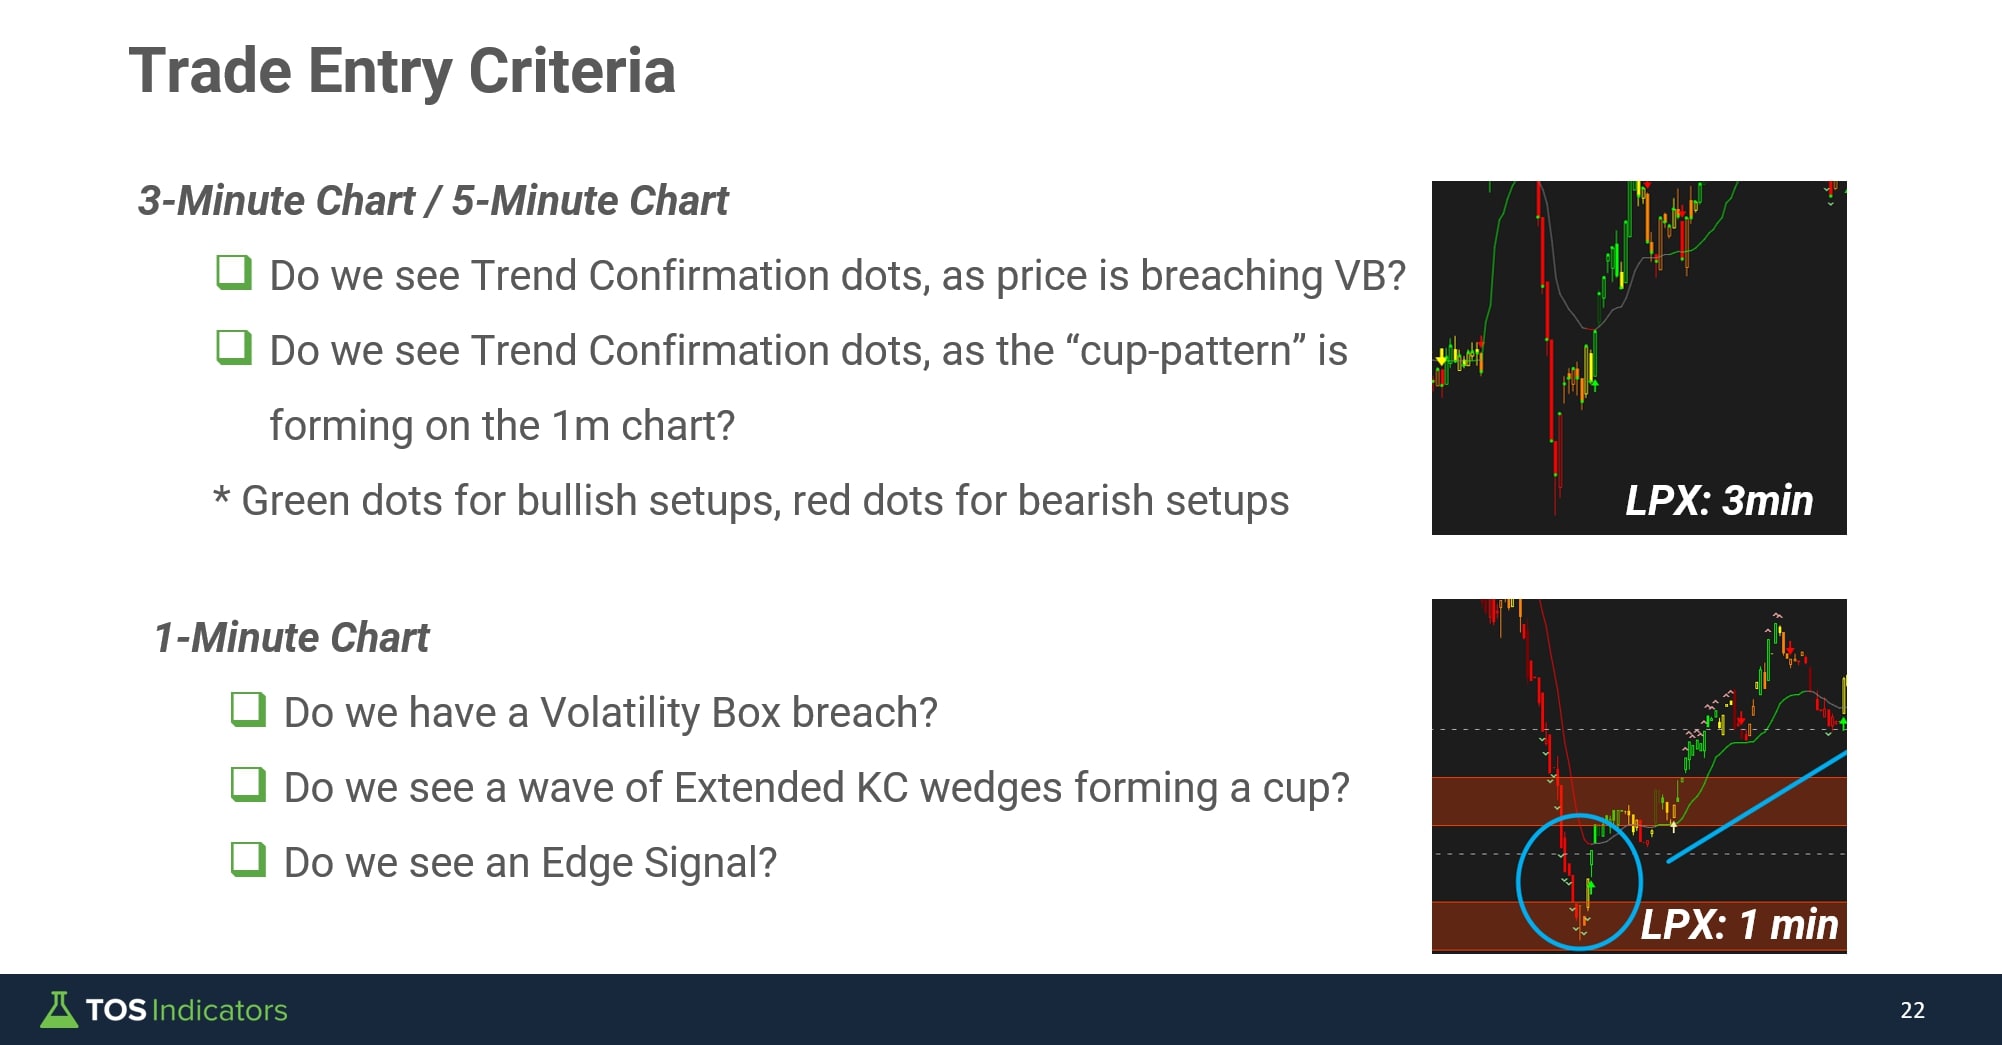
- Step 2: Plug the symbol first into a 3-minute chart, and use the Trend Confirmation indicator to verify if we have a larger trend in-place
- Step 3: If we do have trend confirmation, then plug the symbol into a 1-minute chart, and wait for the "cup" pattern, confirmed with an Edge Signal in the direction of the trade
Once you develop a feel for this setup, you should be able to go through the Live Scanner quickly, and efficiently.
For reference, it takes me about 1 second to go from the Live Scanner to evaluating whether or not I'm interested in this setup, and you'll see the chart settings I use in Part 6, so you can do that too.
Example of the 3-Step Process
Let's start with step 1, which is to pick and choose stocks from our Live Scanner.

I've already chosen one stick - "BJ" - as the one we will continue to use for the exercise, but you would repeat the same process for all stocks on the scanner.
Now, we move onto Step 2, which is to plug the stock into a 3-min chart in ThinkOrSwim. We can use the Trend Confirmation label in the top left, or the green dots on the candles, to verify if the trend lines up.
For bullish (aka "buy the dip" trades), we are looking for green trend confirmation dots / green label reading "Longs Only".
For bearish (aka "sell the rip" trades), we are looking for red trend confirmation dots / red label reading "Shorts Only".
In this case, since "BJ" triggered on our Live Scanner as an Aggressive Long entry, we are looking for the Trend Confirmation label to be green, reading "Longs Only".

Great. So far, "BJ" has crossed the first and second checkpoints we have.
Now, let's move on to the third, and final step: the cup pattern.
If we take a look at BJ's 1-minute chart, we see the cup pattern clearly forming.

The Extended Keltner Channel wedges were forming a nice cup, which eventually bottomed out.
Once we had the green Edge Signal arrow print, all of our setup rules were met, and that was our cue to enter the trade.
By the way, for those curious, this is what my actual chart setup looks like (we'll go into more detail in Part 6 of this series).

Next, let's take this 3-step process and turn it into a repeatable checklist.
Entry Checklist
Here is our entry checklist:
- Is the stock/ETF on our Live Scanner?
- If yes, do we have Trend Confirmation on the 3-minute chart as price was breaching our Volatility Box zones (green Trend Confirmation dots)?
- If yes, do we have Trend Confirmation on the 3-minute chart continuing to exist, when the 1-minute cup pattern is forming?
- If yes, do we have the 1-minute cup pattern forming, with an Edge Signal arrow?
If the answer to all of the above is yes (and you're comfortable with the risk associated on the trade), then the closing price of the candle with the Edge Signal confirmation is our entry price marker.
Printable version of the above checklist:
If the risk is too large for you (ie. those handful of times where the 1-min candle with the Edge Signal confirmation is a 2 ATR+ move candle), then either wait for a better entry, or move on to the next trade setup.
Semi-Automated Trading for Entry
Given the "if / then" approach that we have for this setup, we have the opportunity to leverage semi-automated trading scripts to streamline the process.
For example...
IF we have the cup pattern forming on the 1-minute chart, but we have not yet seen an Edge Signal arrow yet
AND you know we have longer timeframe Trend Confirmation bias
AND you know it's a setup you want to trade
You could leverage a semi-automated script trigger to automatically enter you into a trade, if the previously closed candle has an Edge Signal confirmation.
Here is an example of a script to automatically buy, once we see an Edge Signal confirmation (always test in paper trade first):
plot signal = TI_EdgeSignals().bullishTrigger[1];
If you haven't already seen our semi-automated trading tutorial, here is a link.
It shares techniques on creating your own triggers, including examples with the Edge Signals indicator.
In our next video, we'll discuss stop loss zones in more detail and talk about the risks we're considering for every trade.