How to Find V-Shaped Reversals

Chart Settings:
In this section, I'll share my chart setup, and break down the indicator stack that I like to have, when trading this setup.
2-Panel Grid:
I like to have two charts for this setup.
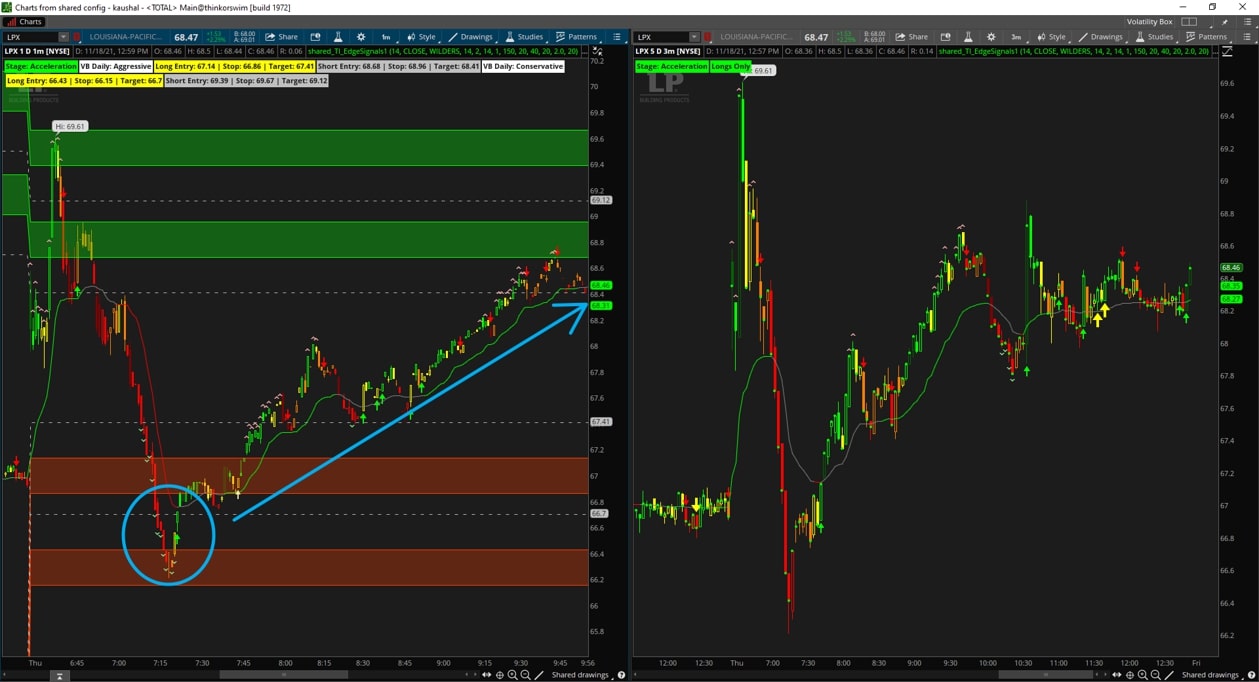
One is a one-minute chart, and the other is either a three-minute or five-minute chart, and they're (usually) side-by-side.

Let's remind ourselves of the 3-Step Process from Part 3, to understand why we need 2 different timeframe charts:
- Step 1: Pick and choose stocks from Live Scanner (or choose all of them)
- Step 2: Plug the symbol first into a 3-minute chart, and use the Trend Confirmation indicator to verify if we have a larger trend in-place
- Step 3: If we do have trend confirmation, then plug the symbol into a 1-minute chart, and wait for the "cup" pattern, confirmed with an Edge Signal in the direction of the trade
The three-minute chart is useful for step 2 of the above process, as the Trend Confirmation labels make it easy to tell if you should focus on long setups, or short setups, or neither.
The one-minute chart is useful for Step 3 of the above process, as we can use the Extended Keltner Channel wedges, in conjunction with the Edge Signal indicator to confirm our "cup" pattern rules are met.
1-Minute Chart Indicator Set:
Let's go through the specific indicators on each side of my chart, one-by-one.

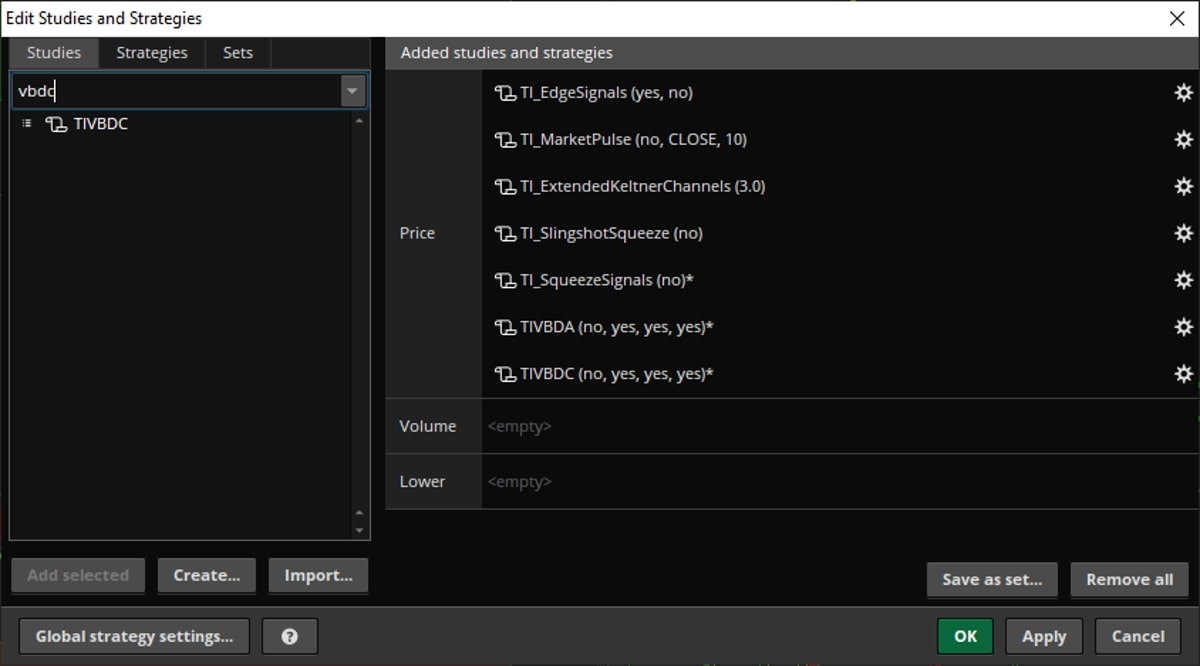
Here are the indicators I have on my 1-minute time frame chart:
- Edge Signals indicator - our overbought oversold confirmation signal indicator (it replaces RSI, Stochastics, and even some momentum indicators like MACD). It's also an excellent barometer for timing some spectacular market reversals. That's his broader objective, as long as we can give it proper context.
- Market Pulse indicator - Replace all of the other moving averages, and take a much simpler, and more objective approach to assessing trend. Either a trend is in a stage of acceleration, deceleration, accumulation, or distribution. There is no 4th "what-if" bucket.
- Extended Keltner Channels indicator (set to a 3.0 factor) - When the cup pattern begins forming, you may observe small wedges forming. This is the indicator that causes those wedges to form, suggesting that the closing price of the candle is now outside of the 3.0 factor Keltner Channels.
- Slingshot Squeeze indicator - This is the first in our (current) set of squeeze indicators. The Slingshot Squeeze helps us catch early entries, in stocks that are forming a nice squeeze, and starting to gather momentum.
- Squeeze Signals indicator - This is the second in our (current) set of squeeze indicators. The Squeeze Signals indicator helps us catch squeezes before they are about to take-off. These are squeezes that have been building up momentum, and are shaping up to breakout soon. Note: I like to think of the Slingshot Squeeze + Squeeze Signals indicator as a 1-2 punch duo, with the Slingshot Squeeze plotting first, and then a few candles later, the Squeeze Signals.
- Volatility Box models - This is for those of you that prefer seeing the Volatility Box levels on your charts, instead of on the Dashboard inside of the Stock VB platform. I have both, the Aggressive and Conservative Volatility Box models loaded on, and this is the core of where all trade decisions normally start.
Now, the difference in this setup is that by going to that 3-minute chart first (instead of trying to generate an indicator file right away), we can filter down that entire list of stocks on the Live Scanner down to just a handful.
By following this approach, you can focus on the very best stocks. If the Trend Confirmation indicator doesn't align with the type of trade (ie. Trend Confirmation says "Shorts Only" but the actually trade is an "Aggressive Long"), we can skip the trade.
If and only if the Trend Confirmation indicator aligns with the type of trade (ie. "Longs Only" and the trade is "Aggressive Long"), we can spend the time to generate an indicator file.
3-Minute Chart Indicator Set:

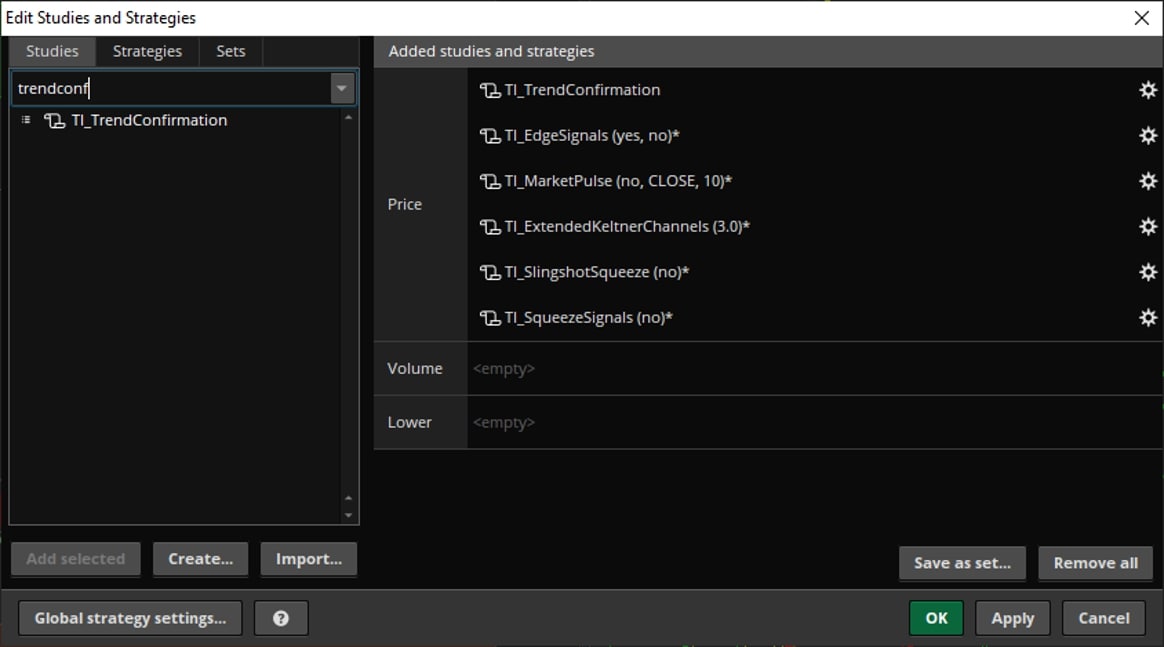
For the other side of my chart, I have a 3-minute time frame, with the following indicators:
- Trend Confirmation indicator - Our "first line of defense" to make sure we are trading in the direction of the overall trend. Do we have a bullish, bearish or no trend at all, on longer time frames?
- Edge Signals indicator - same as above.
- Market Pulse indicator - same as above.
- Extended Keltner Channels indicator - same as above.
- Slingshot Squeeze indicator - same as above.
- Squeeze Signals indicator - same as above.
- Volatility Box models - same as above.
The primary goal of the 3-minute chart is to utilize the Trend Confirmation indicator and confirm the trend.
What is the Trend Confirmation Indicator?
The purpose of the Trend Confirmation indicator is to ensure that we are trading trading on the right side of the trend.

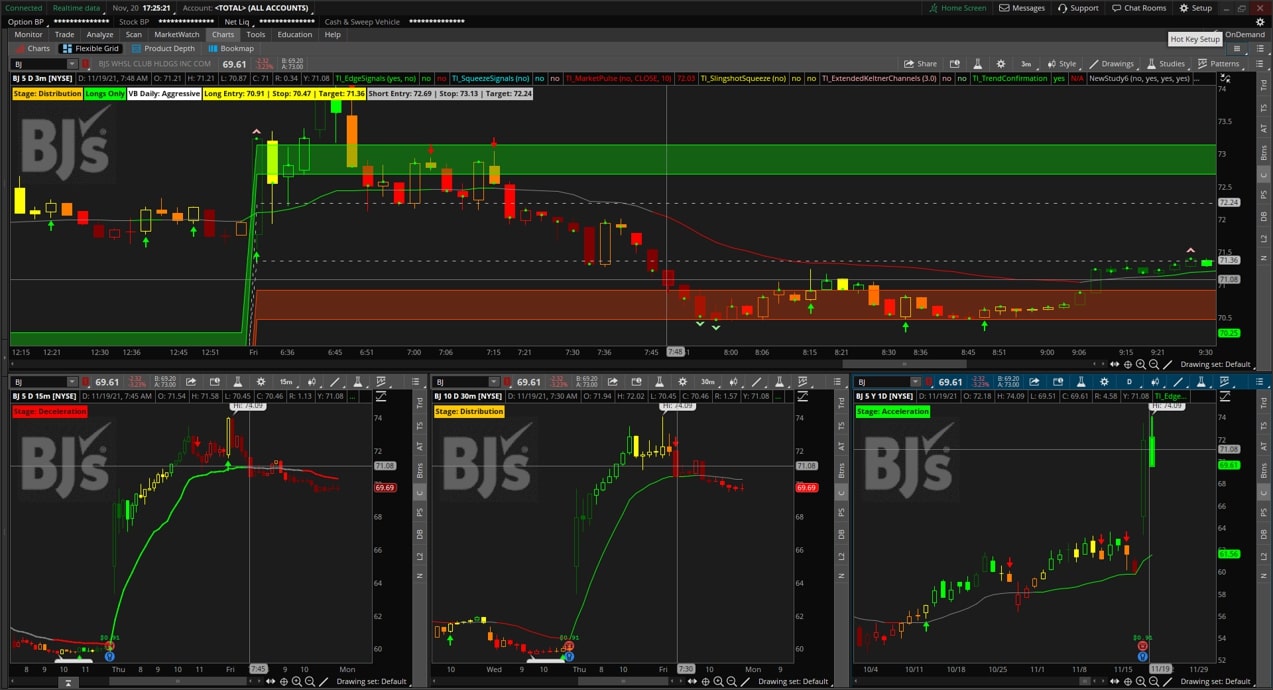
It uses the current trends on longer time frame charts, and boils that down into easy-to-read dots, and a label.
- If the overall trend on longer time frame charts is bullish, then we will see green dots printing, and the label will read "Longs Only" with a green background --> this means, we are looking for Aggressive or Conservative Long setups only
- If the overall trend on longer time frame charts is bearish, then we will see red dots printing, and the label will read "Shorts Only" with a red background --> this means, we are looking for Aggressive or Conservative Short setups only
- If there is no overall trend on longer time frame charts, then we will not see any dots printing, and the label will read "N/A" with a black background --> this means, we have no trend bias, and that particular market does not meet the rules of this setup
The Trend Confirmation indicator makes it easy to confirm that we are trading on the correct side of the trend, and updates with each new candle, if trend changes.
Note: The Trend Confirmation indicator will only work on either a 3-minute or 5-minute timeframe, in its current format. We may look at expanding support for additional time frames, as a future tutorial.
V-Shaped Reversal Setup Summary
Let's summarize the V-Shaped reversal setup one more time.
And this time, we'll try and use a slightly different idea, based on the "lines of defense."
- The Live Scanner is your watchlist. Plug in stocks from our Live Scanner into a 3-minute chart first. You can pick and choose your favorite stocks, or plug in all of them. It doesn't matter.
- The 3-minute is our first line of defense. If the trade type does not align with the longer time frame trend, then we do not move on to the one minute timeframe chart.
- The 1-minute is our second line of defense. If the trend aligns, we are looking for the cup pattern, formed by the wedges, and the move away from our Volatility Box zone confirmed by the Edge Signal indicator.
We spent all this time talking about the setup. Let's look at some examples. I will show you different examples and talk about each one. And I'll show you an example of where day trading versus swing trading is a little bit different, and how the trade results are also different as a result of that.
Let's now apply everything that we've learned, by taking a look at some real chart examples.
We'll even discuss how day and swing trading stops and entries may be different, so you have an idea how to customize the setup, and make it work for you.

