Keltner Channel Wedges
Easily identify the best mean reversion trades, without cluttering your charts with unnecessary information.

Introduction
Good afternoon, everyone and welcome to a five-minute thinkScript video.
In today's video, we're going to answer the question - "How do we build an indicator that lets us know whenever price action is too extended?"
If you're new to thinkScripting, this is going to be a great introduction and is a beginner friendly tutorial (we'll write less than 10 lines of code).
To give you an idea of how this a tutorial is broken down...
- In the first minute, I'll show you a preview of the final version of the indicator
- We'll spend the next three or so minutes writing thinkScript code. I'll spend a little bit more time breaking down individual concepts, to help explain the code along the way.
- Finally, I'll spend the last minute to summarize what we've accomplished in this tutorial, along with ways that you can take the concepts that we discussed in today's video, especially this idea of being overly extended, and turn that into something a little more powerful.
With that, let's get started.
Volatility Box Invite
We are TOS Indicators.com, home of the Volatility Box.
The Volatility Box is our secret tool, to help us consistently profit from the market place. We’re a small team, and we spend hours every day, after the market close, doing nothing but studying thousands of data points to keep improving and perfecting the Volatility Box price ranges.
We have two different Volatility Boxes - a Futures Volatility Box and a Stock Volatility Box.
Futures Volatility Box - Trade Major Markets With an Edge
Designed For: Futures, Micro-Futures and Index Market Traders
Supported Models: Hourly Volatility Box models
Supported Markets: 10 Major Futures Markets
The Futures Volatility Box comes with:
- 5 Volatility Models for each market
- Support for 10 Futures Markets (/ES, /NQ, /YM, /RTY, /CL, /GC, /SI, /ZB, /HG, /NG)
- Video Setup Guide
- Trade Plan
- Access to all members-only resources, including Squeeze Course
Learn More About the Futures Volatility Box
Trade futures and micro futures with a consistent volatility edge
Stock Volatility Box - Powerful Web Based Volatility Platform
Designed For: Stock and Options Traders
Supported Models: Hourly and Daily Volatility Box models
Supported Markets: 10,000+ Stocks and ETFs (new markets added frequently)
A Stock Volatility Box membership includes access to:
- Live Scanner - A powerful scanner we've built from scratch, to scan 10,000 symbols every 2 seconds for new volatility breaches
- Dashboard - A quick and easy way to view daily volatility model levels online
- Short Interest Scanner - Short interest, Squeeze, and EMA data to find short squeezes
- Squeeze Course - All of our proprietary squeeze tools, including robust backtesters
- All Members Only Indicators - We don't nickel and dime you. Everything really is included.
- And much more!
Learn More About the Stock Volatility Box
Trade stocks and options with a consistent volatility edge
Demo of the Final Version of the Indicator
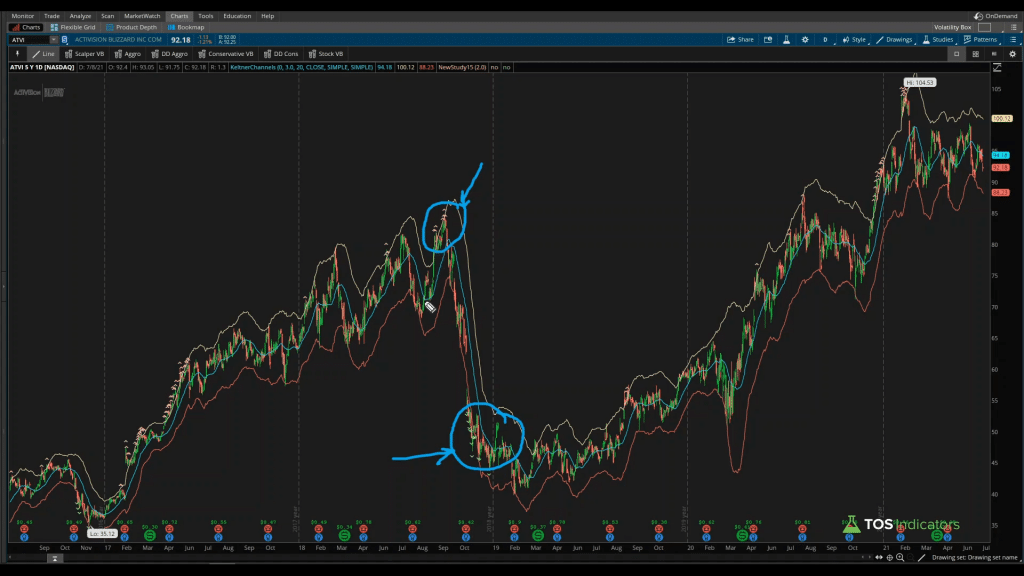
Here's what the final version of the "Overly Extended" indicator looks like:

You should notice the "Boolean Wedges" (that's what ThinkOrSwim calls them), indicating that price action is too extended. Our definition of "extended" involves using the Keltner Channels, and specifically measuring price action's relationship to the upper and lower Keltner Channel bands.
It will plot both long and short wedges, using a very simple boolean condition, which we will write in the thinkScript section of this tutorial.
Understanding the Keltner Channels
Before we start writing our "Overly Extended" indicator, we need to understand the Keltner Channels code.
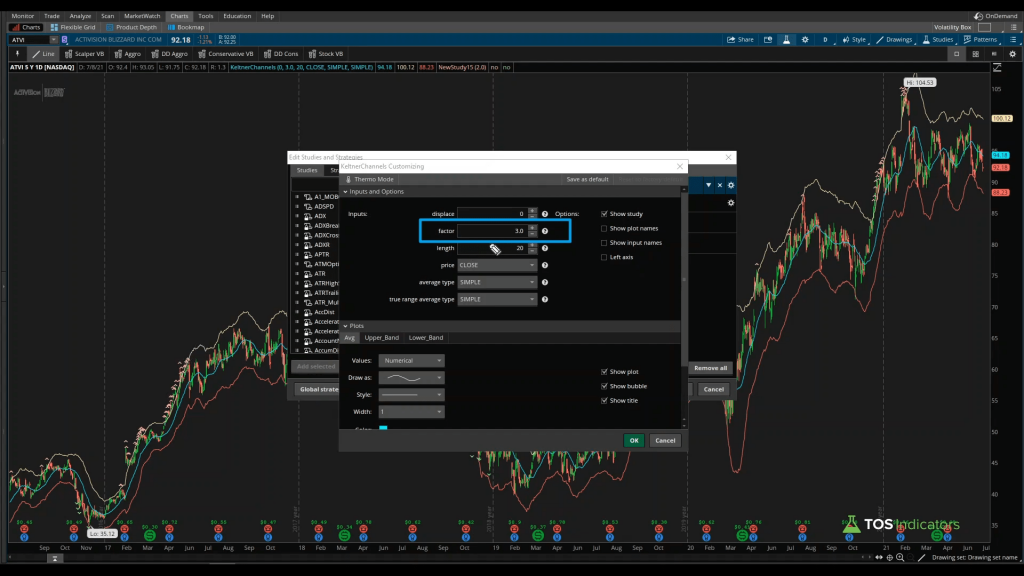
Let's start with the user inputs.

While there are a few different inputs available, the one input that we care about is the "Factor" variable. The "Factor" variable is what determines how elastic the Keltner Channel upper and lower bands are (the higher the number, the "more extended").
A 3.0 factor means we're increasing the elasticity of the Keltner Channels. As you continue to increase the factor, and if the "Overly Extended" boolean wedges continue to plot, the further extended we are.
This "Factor" input is something we'd like the user to be able to control from the studies menu in our version of the final indicator. With the value that the user inputs, the upper and lower bands of the Keltner Channel will adjust accordingly (and thus, our wedges).
Using your newfound knowledge about the Keltner Channels, we are now ready to start writing some custom thinkScript code.
Writing thinkScript Code
Now, let's start writing some thinkScript code. We can give our new indicator a name, calling it TI_ExtendedKeltnerChannels.
We can start by first defining our one input variable, which is the Keltner channel "Factor." We make this an input variable, so the user can change the value directly from the study's menu, instead of needing to edit code. We can define this variable as "KCfactor" and give the variable a default value of 3.0.
Next, I can define our extended variables, which is what will contain the logic behind what plots on our chart.
Let's start defining the long-side extended variable, which we can call "extendedLong." Our condition checks if the closing price of the current candle is greater than the Upper Band of the Keltner Channels. If it is, then "extendedLong" will return a 1, plotting true.
Now, we can copy paste this one more time, for our short side.
The reverse of the above condition is true for the short side. In this case, we are checking if the closing price of the current candle is less than the Lower Bands of the Keltner Channels, using the same "KCFactor" variable.
Finally, we can add in the appropriate formatting, by defining the painting strategy. We can set the painting strategy for extendedLong and extendedShort to wedges, using:
- "PaintingStrategy.BOOLEAN_WEDGE_UP"
- "PaintingStrategy.BOOLEAN_ARROW_DOWN"
And, finally, we can also define the color, with our overly extended on the long side wedges painting as pink, and the short wedges as light_green.
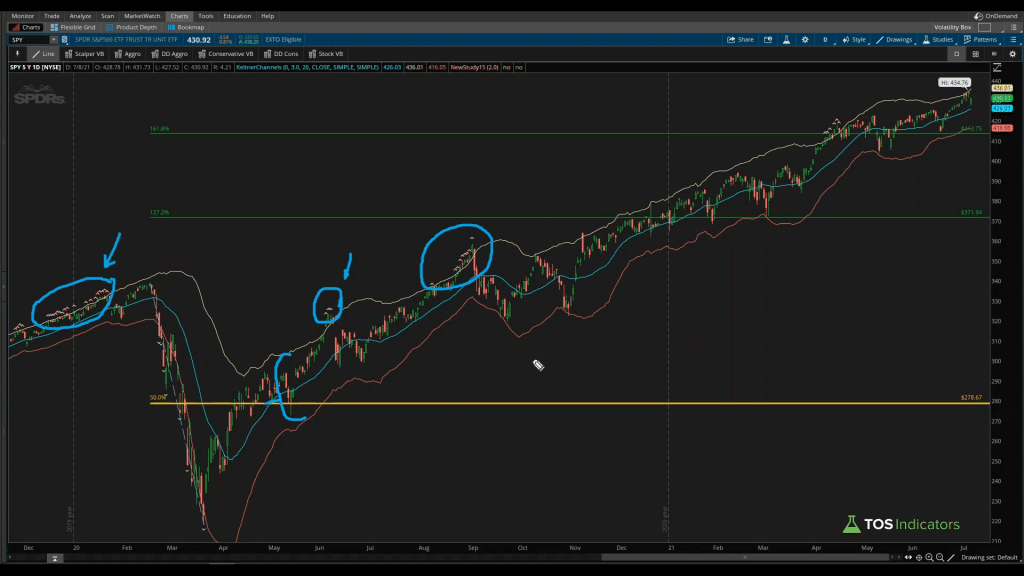
Here's an example of what the final version of the indicator looks like, plotting on a chart of the S&P 500 ETF (SPY) on a daily time frame chart:

In terms of how you can continue to improve this indicator beyond what we currently have, you can start to make these conditions a bit more intricate. For example, you may also want to include an oversold/overbought indicator, such as the RSI (ie. RSI > 70).
You can layer on other indicators that you may prefer trading with, to continue to build out the "extendedLong" and "extendedShort" variables, and start to make these conditions a bit more complex.
The goal of the indicator is to not only help save you chart space, but also the mental bandwidth to automatically alert you when we are overly extended.
Frequently Asked Questions
Keltner Channels are volatility-based bands to help analyze current trends. They forecast market reversals and provide traders with the confidence they need to know when to enter or exit certain trades. These channels can be used for any time frame, and are often used in conjunction with Bollinger Bands, to find periods of compressed volatility (such as in the Triple Squeeze indicator).
Keltner Channel settings will change, based on your trading style, and how aggressive or conservative your strategy is.
The most commonly used Keltner Channel settings for a trader who uses +/- 3 Standard Deviations and a 20-Period moving average are the following:
- Displace: 0
- Factor: 3.0
- Length: 20
- Price: Close
- Average Type: Simple
- True Range Average Type: Simple
Keltner Channels are calculated using the Average True Range (ATR), whereas Bollinger Bands are based on standard deviations. Both indicators help identify overbought conditions and oversold conditions, but use different criteria to identify these states.
The Bollinger Band width is frequently turning in a new direction, suggesting a shift in market conditions more often. The ATR indicator seldom changes its orientation completely. As a result, the Bollinger Bands usually provide signals earlier (but may also provide more false signals, than the Keltner Channels).
The key to trading with Keltner Channels is that you enter the trade at the middle line (mean), trading in the direction of the pre-existing trend. Take profits either the upper band of the Keltner Channels, or just outside of it.
If price is outside of the upper or lower Keltner Channel bands, look for a reversion to the mean, and for price to snap back to the middle line. The Edge Signal is a great overbought/oversold indicator, that lets you catch these reversals (and works well with the Extended Keltner Channels indicator).
Conclusion
The first thing we did is we created an input variable ("KCFactor"). That means that the user can change one variable, and automatically interact with the rest of our code.
The KCFactor variable then fed into the Keltner Channel calculations, determining where the upper and lower bands plotted. These conditions together, in comparison to our closing price, help determine when our "Overly Extended" wedges will plot.
We also spent some time formatting the output of the indicator, defining the painting strategy and color.
I hope this tutorial was helpful for those of you that are newer to thinkScripting, and gives you an idea of how you can write just a few lines of code to start to perform some fairly powerful calculations.
Take care everyone.
Good luck trading, and we'll see you in the next tutorial.