How to Find V-Shaped Reversals

Introduction
By now, you have had a chance to learn more about the setup and our trade management.
Now it's time to become a master of recognizing the pattern.
Let's train your eyes to understand and recognize the setups as they happen in real time.
Example 1: Louisiana Pacific (LPX)
Let's start with our entry checklist first.
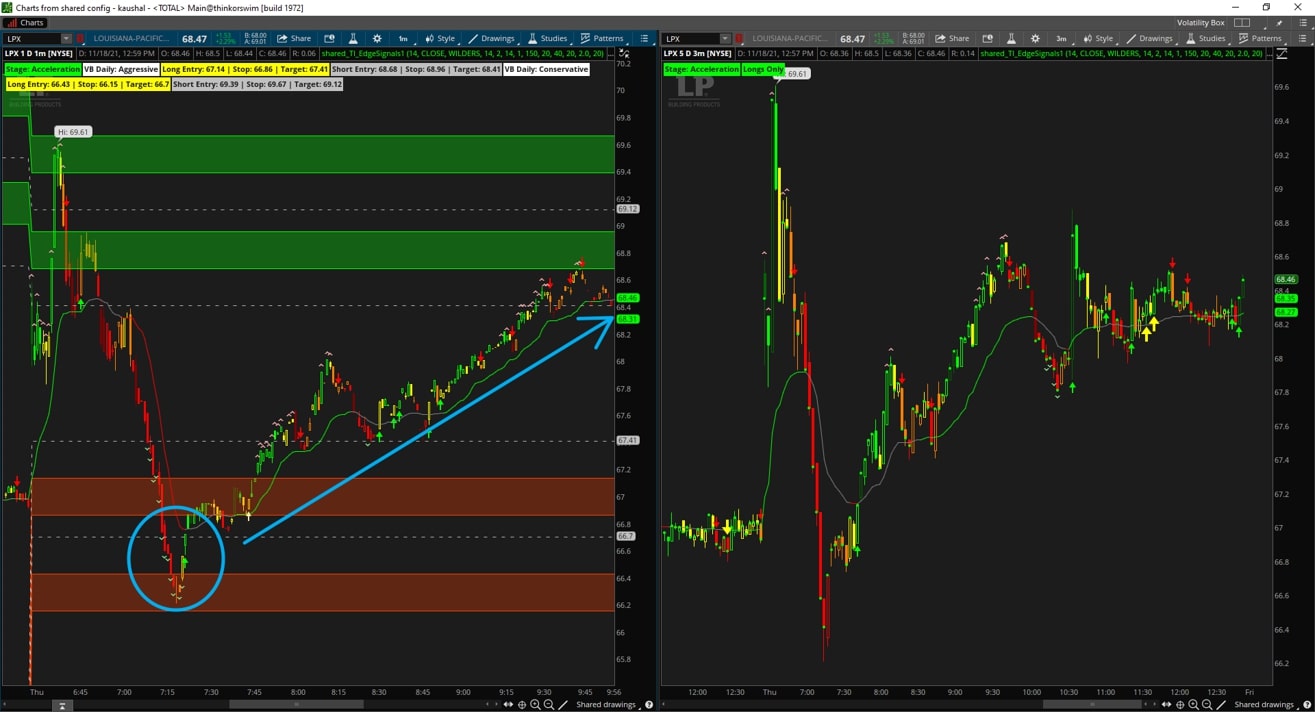
Checkpoint #1: 3-Minute Time Frame Chart
- Trend Confirmation dots plotting as price action breaches the Volatility Box clouds
- Trend Confirmation dots plotting as the cup pattern is forming on the 1-minute time frame chart
If yes to both questions above, then move onto Checkpoint #2.
Checkpoint #2: 1-Minute Time Frame Chart
- Do we have a Volatility Box breach?
- Do we see a wave of Extended KC wedges forming a cup?
- Do we see an Edge Signal?
All of our rules are met, and the closing price of the candle with the Edge Signal is our entry point.
Stop: Outside of the Volatility Box clouds, as it is wider when compared to the recent pivot point
If you are willing to risk the capital required on this trade, based on a stop outside of the Volatility Box clouds, then the trade is a go.
Target: For our first target, we're looking for our minimum risk to reward ratio (1:1).
Once we hit the first target, which happened fairly quickly here, we have a few different options for our stop.
- If you moved your stop to break-even, you still had an opportunity to ride the overall trend
- If you moved your stop to the pivot point, you still had an opportunity to ride the overall trend
- If you did not move your stop at all, you still had an opportunity to ride the overall trend, without your stops being hit
For our second target, we went all the way to the opposite side's Volatility Box target lines, which is typically a "best-case" scenario. 1:2, even 1:3 targets would have been hit along the way.
The trade inside LPX would be a good "demonstration" of a picture-perfect trade with this setup.
Our entry rules were met, our stop was clear, little to no heat on the trade, and we even hit our stretch targets.
Now, let's move on to our next example inside of AMD.
Example 2: Advanced Micro Devices Inc. (AMD)
Let's start with our entry checklist first.
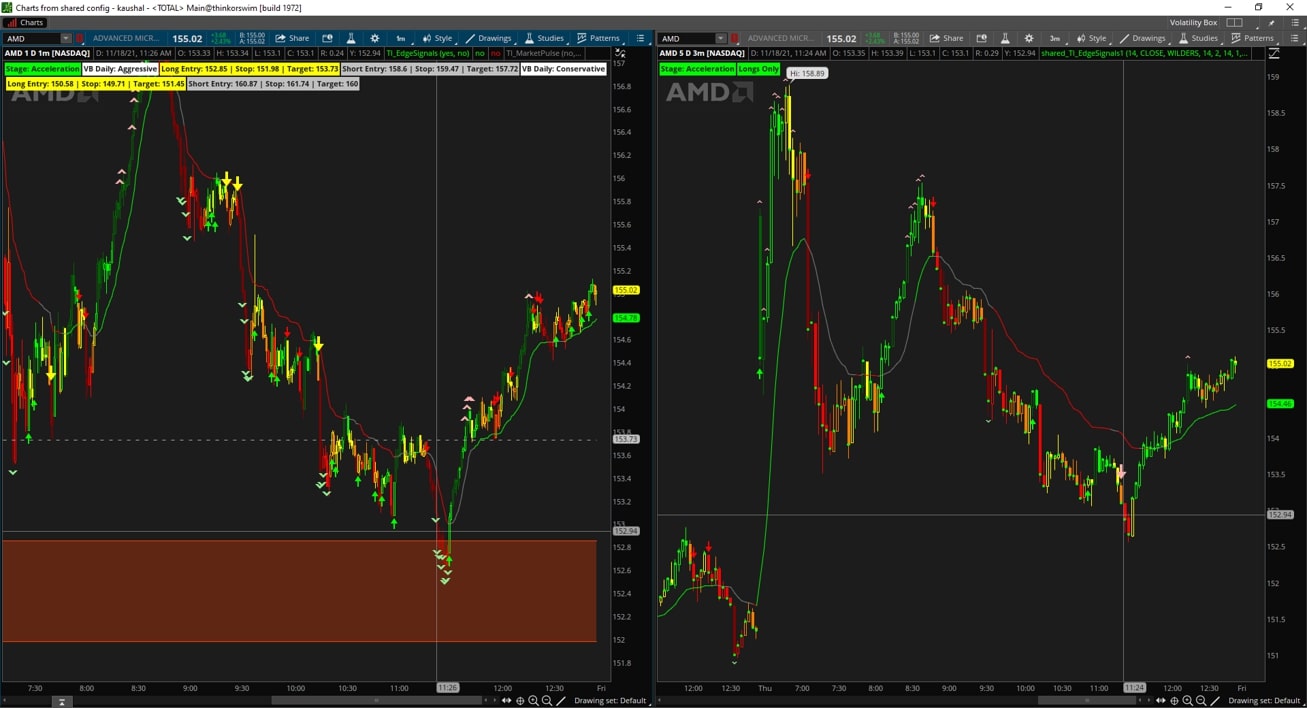
Checkpoint #1: 3-Minute Time Frame Chart
- Trend Confirmation dots plotting as price action breaches the Volatility Box clouds
- Trend Confirmation dots plotting as the cup pattern is forming on the 1-minute time frame chart
If yes to both questions above, then move onto Checkpoint #2.
Checkpoint #2: 1-Minute Time Frame Chart
- Do we have a Volatility Box breach?
- Do we see a wave of Extended KC wedges forming a cup?
- Do we see an Edge Signal?
All of our rules are met, and the closing price of the candle with the Edge Signal is our entry point.
Stop: Outside of the Volatility Box clouds, as it is wider when compared to the recent pivot point
If you are willing to risk the capital required on this trade, based on a stop outside of the Volatility Box clouds, then the trade is a go.
Target: For our first target, we're looking for our minimum risk to reward ratio (1:1).
One little caveat to call out.. this trade was a little bit towards the end of the day. Usually, that doesn't leave much "buffer" time for follow-through; the trade has to start going in your direction NOW.
And that's exactly what happened.
Once we hit the first target, which happened fairly quickly here, we have a few different options for our stop.
- If you moved your stop to break-even, you still had an opportunity to ride the overall trend
- If you moved your stop to the pivot point, you still had an opportunity to ride the overall trend
- If you did not move your stop at all, you still had an opportunity to ride the overall trend, without your stops being hit
For our second target, the end of day target was the one that had to be used, given the late entry into the trade.
For swing traders holding with overnight risk, AMD continued to trend your way even on Friday, giving you a nice 2-day winner, by taking advantage of the most optimal entry points.
The trade inside AMD would be a good "demonstration" of the power of trading with the trend. Despite a later-in-the-day setup entry, AMD had almost "instant" follow-through, with buyers coming in.
Our entry rules were met, our stop was clear, little to no heat on the trade, and something for both day and swing traders alike.
Now, let's move on to our next example inside of XLNX.
Example 3: Xilinx (XLNX)
This setup is very similar to that of AMD.
Let's start with our entry checklist first.
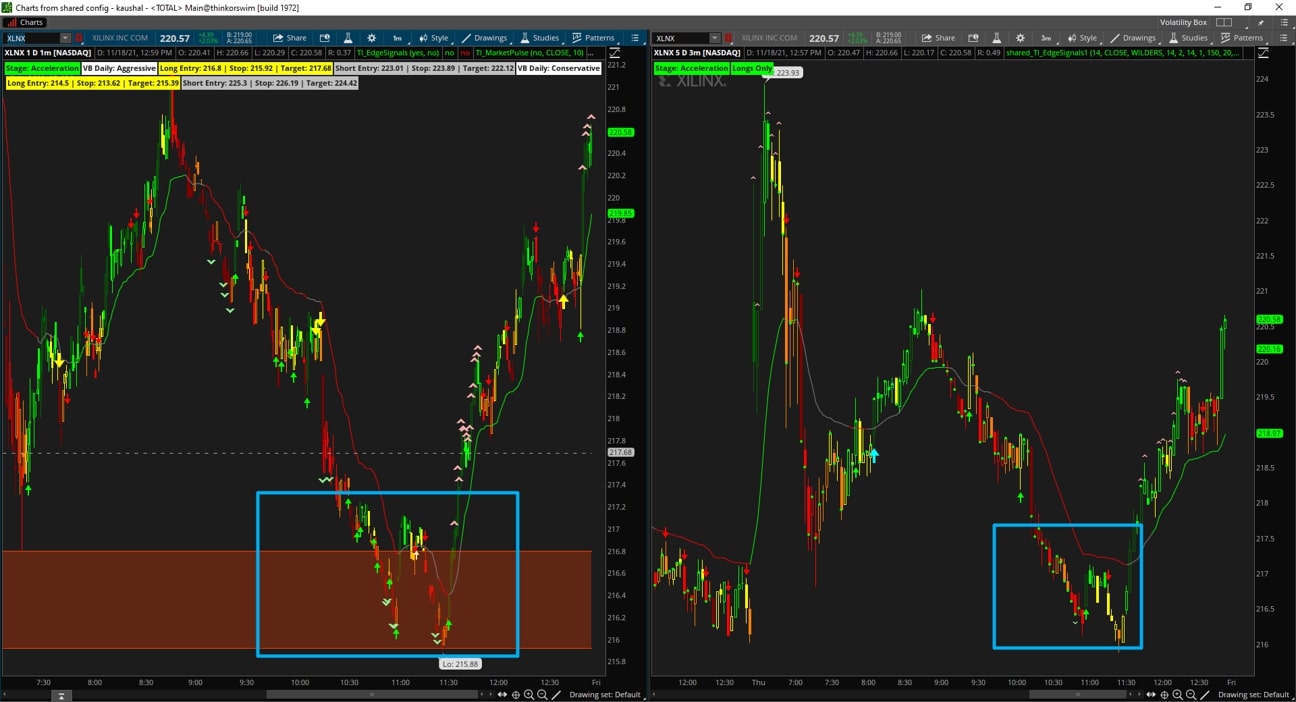
Checkpoint #1: 3-Minute Time Frame Chart
- Trend Confirmation dots plotting as price action breaches the Volatility Box clouds
- Trend Confirmation dots plotting as the cup pattern is forming on the 1-minute time frame chart
If yes to both questions above, then move onto Checkpoint #2.
Checkpoint #2: 1-Minute Time Frame Chart
- Do we have a Volatility Box breach?
- Do we see a wave of Extended KC wedges forming a cup?
- Do we see an Edge Signal?
All of our rules are met, and the closing price of the candle with the Edge Signal is our entry point.
Stop: Outside of the Volatility Box clouds, as it is wider when compared to the recent pivot point
If you are willing to risk the capital required on this trade, based on a stop outside of the Volatility Box clouds, then the trade is a go.
Target: For our first target, we're looking for our minimum risk to reward ratio (1:1).
This trade was a little different when compared to AMD and LPX, in that we actually had to deal with some heat on the trade.
In fact, after the trade started going strongly in our favor, the trend quickly reversed, for a "double-bottom", before finally reversing.
Had you chosen the tighter stop and not followed the stop rules, your stop would have been hit, and the reversal would've taken place without you enjoying the profits.
We hit the first target fairly quickly, once XLNX bounced a second time.
For our second target, the end of day target was the one that had to be used, given the late entry into the trade.
For swing traders holding with overnight risk, XLNX, too, continued to trend your way even on Friday, giving you another nice 2-day winner, by taking advantage of the most optimal entry points.
The trade inside AMD would be a good "demonstration" of the importance in following your trade plan rules (from entries, all the way to exits).
The only reason we were in this trade long enough to see it turn into a winner, is because we followed the stop rules.
Keep in mind, though, it doesn't always work out this way (as you'll see in a later example, below).
Now, let's move on to our next example inside of XPO.
Example 4: XPO Logistics Inc. (XPO)
Let's start with our entry checklist first.
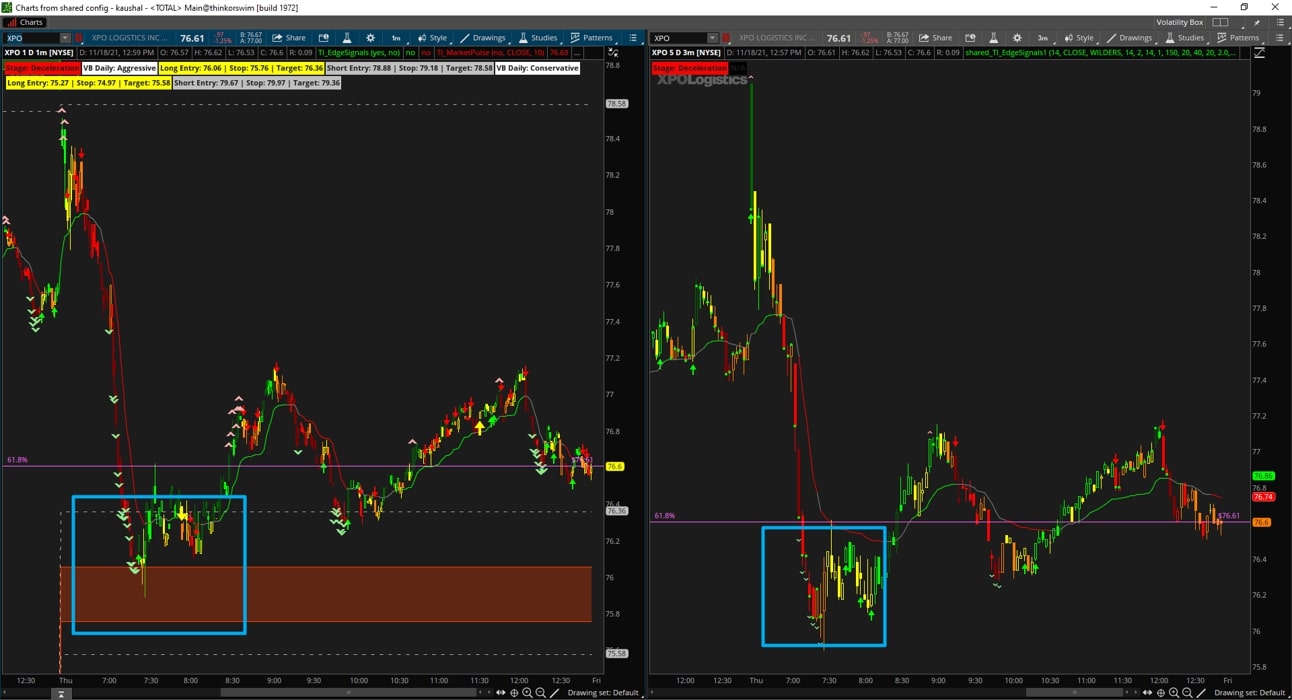
Checkpoint #1: 3-Minute Time Frame Chart
- Trend Confirmation dots plotting as price action breaches the Volatility Box clouds
- Trend Confirmation dots plotting as the cup pattern is forming on the 1-minute time frame chart
If yes to both questions above, then move onto Checkpoint #2.
Checkpoint #2: 1-Minute Time Frame Chart
- Do we have a Volatility Box breach?
- Do we see a wave of Extended KC wedges forming a cup?
- Do we see an Edge Signal?
All of our rules are met, and the closing price of the candle with the Edge Signal is our entry point.
Stop: Outside of the Volatility Box clouds, as it is wider when compared to the recent pivot point
If you are willing to risk the capital required on this trade, based on a stop outside of the Volatility Box clouds, then the trade is a go.
Target: For our first target, we're looking for our minimum risk to reward ratio (1:1).
Once we hit the first target, which happened fairly quickly here, we have a few different options for our stop.
- If you moved your stop to break-even, you still had an opportunity to ride the overall trend (barely - stop missed by a few ticks)
- If you moved your stop to the pivot point, you still had an opportunity to ride the overall trend
- If you did not move your stop at all, you still had an opportunity to ride the overall trend, without your stops being hit
For our second target, either the 1:2 risk-reward ratio target, or the end of day target could be used.
Now, let's move on to our next example inside of QCOM.
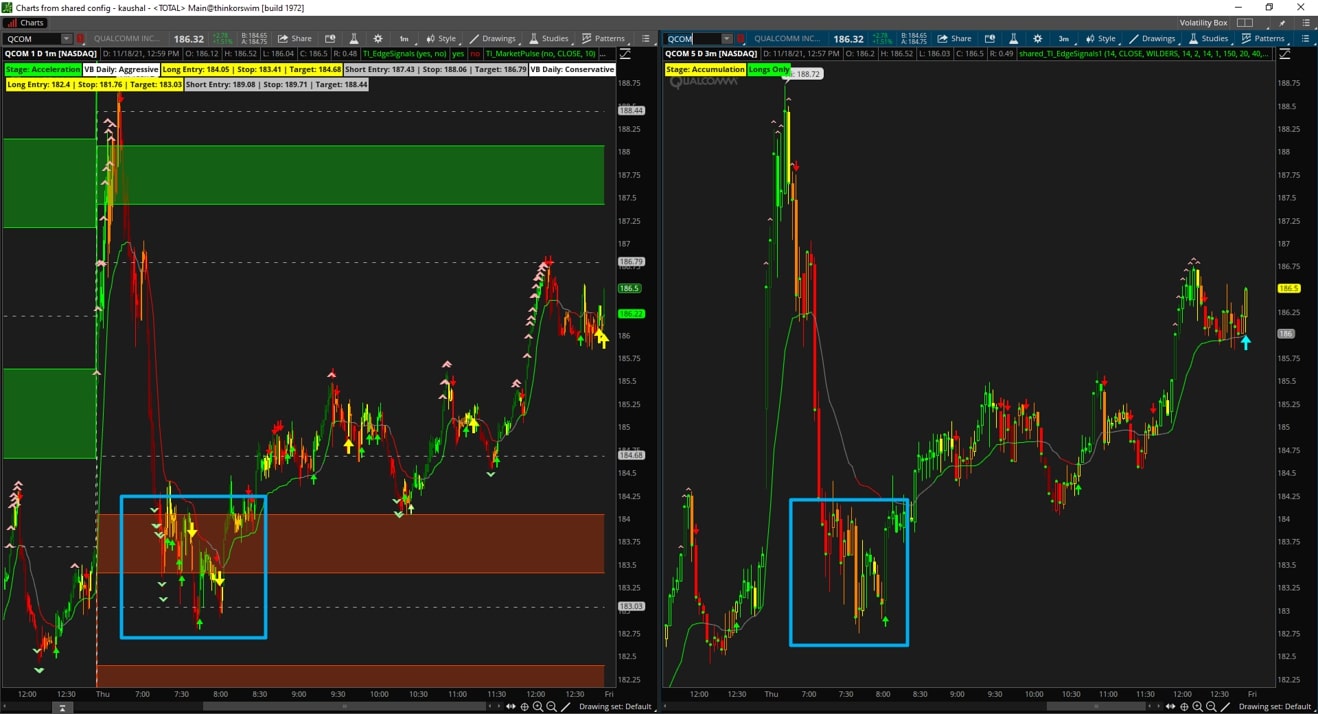
Example 5: Qualcomm (QCOM)
Let's start with our entry checklist first.
Checkpoint #1: 3-Minute Time Frame Chart
- Trend Confirmation dots plotting as price action breaches the Volatility Box clouds
- Trend Confirmation dots plotting as the cup pattern is forming on the 1-minute time frame chart
If yes to both questions above, then move onto Checkpoint #2.
Checkpoint #2: 1-Minute Time Frame Chart
- Do we have a Volatility Box breach?
- Do we see a wave of Extended KC wedges forming a cup?
- Do we see an Edge Signal?
All of our rules are met, and the closing price of the candle with the Edge Signal is our entry point.
Stop: Outside of the Volatility Box clouds, as it is wider when compared to the recent pivot point
In this trade, our day trading stop was hit.
However, if you were a swing trader playing the 30-minute trend bounce instead, your stops were much wider (with entries all the way down into our Conservative Volatility Box zones).
Target: Assuming you were not shaken out of this trade, our first target is at the 1:1 risk-reward ratio, as it usually is.
Once the first target is hit, our stop could have been moved up to break-even (without being hit).
For our second targets, you could use either the opposite side's Volatility Box zones, 1:2 risk-reward, or even the end-of-day exit as your second targets.
Now, let's move on to our final example inside of TTD.
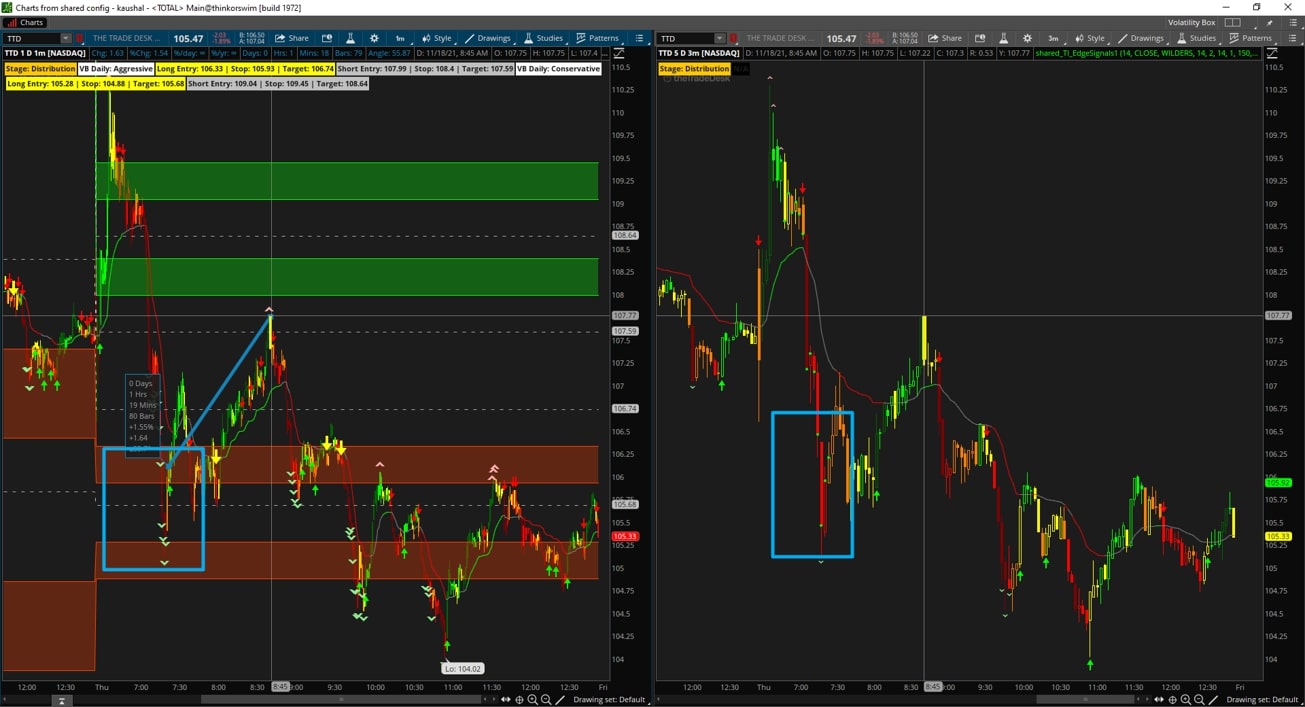
Example 6: The Trade Desk (TTD)
Let's start with our entry checklist first.
Checkpoint #1: 3-Minute Time Frame Chart
- Trend Confirmation dots plotting as price action breaches the Volatility Box clouds
- Trend Confirmation dots plotting as the cup pattern is forming on the 1-minute time frame chart
If yes to both questions above, then move onto Checkpoint #2.
Checkpoint #2: 1-Minute Time Frame Chart
- Do we have a Volatility Box breach?
- Do we see a wave of Extended KC wedges forming a cup?
- Do we see an Edge Signal?
All of our rules are met, and the closing price of the candle with the Edge Signal is our entry point.
What's different about this setup, you ask? Well, it's the entry price. It's much higher, in comparison to the stop that would be required for this trade (outside of the Conservative Volatility Box).
Ask yourself... are you willing to risk the capital that is required, to find out whether or not this trade will be successful?
If yes, then keep reading forward.
If no, then wait for a pullback into a more acceptable risk-tolerance level, as long as we have not hit what would already be our first target.
Stop: Outside of the Conservative Volatility Box clouds, as it is wider when compared to the recent pivot point
Target: For our first target, we're looking for our minimum risk to reward ratio (1:1), which is greater here, given the risk required for this trade.
Once we hit the first target, which happened fairly quickly here, we have a few different options for our stop.
- If you moved your stop to break-even, you were stopped out
- If you moved your stop to the pivot point, you still had an opportunity to ride the overall trend to the other side's target lines
- If you did not move your stop at all, you still had an opportunity to ride the overall trend to the other side's target lines, without your stops being hit
For our second target, either the 1:2 risk-reward ratio target or Volatility Box target lines.
If your second target was a stretch target, and you had not adjusted your stops, your final position would be stopped out in the reversal.
If you adjusted your stop to break-even, and your second target had not yet been hit, that too would have been stopped out for a net wash on the trade.
Conclusion
The V-Shaped Reversal Setup, when detected early in a trend, can lead to some incredible reversals.
A summary, one last time, of our 3-step process:
- Step 1: Pick and choose stocks from Live Scanner (or choose all of them)
- Step 2: Plug the symbol first into a 3-minute chart, and use the Trend Confirmation indicator to verify if we have a larger trend in-place
- Step 3: If we do have trend confirmation, then plug the symbol into a 1-minute chart, and wait for the "cup" pattern, confirmed with an Edge Signal in the direction of the trade
The setup is easy to follow, and effective, as you've seen from the examples above.
For all Stock Volatility Box members, you can download my entire workspace directly from the Insights page.
