
 Fair Value Gap
 False Breakout Scanner
 Heiken Ashi Trend
 Stock Volatility Box
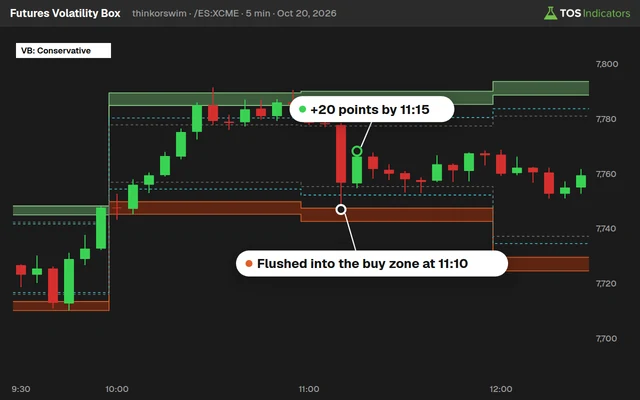 Futures Volatility Box
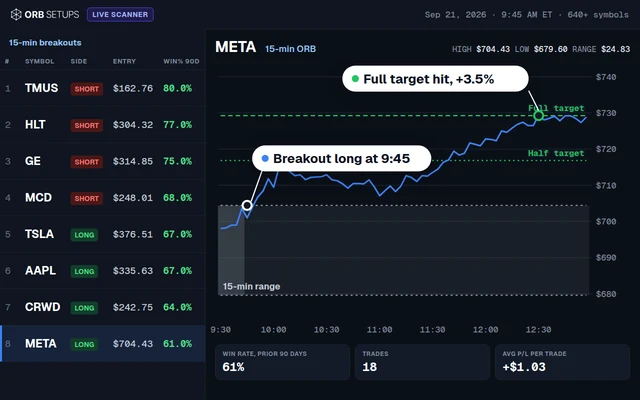 ORB Setups
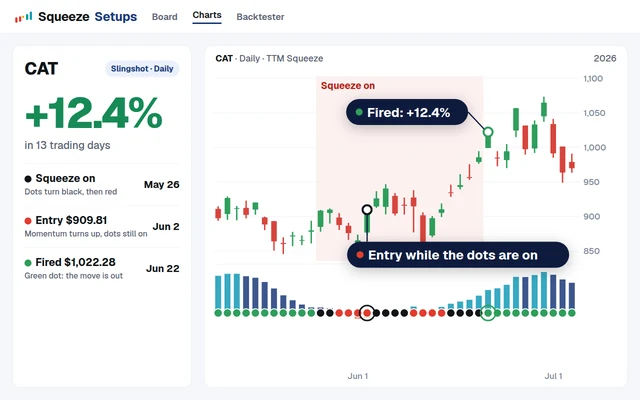 Squeeze Setups
The VVIX index, often called the "volatility of volatility," measures the expected 30-day volatility of the VIX itself. While most traders focus on the VIX as their primary fear gauge, the VVIX can act as a leading indicator for SPY reversals by revealing when options traders are most aggressively hedging against VIX moves.
This research breaks down how to interpret key VVIX levels, use the VVIX/VIX ratio for divergence signals, and build ThinkOrSwim studies that alert you when the VVIX reaches actionable extremes. Watch the full video above for a walkthrough of VVIX setups on live SPY charts.
What Is the VVIX?
The VVIX index measures the expected volatility of the CBOE Volatility Index (VIX). Published by the Chicago Board Options Exchange, the VVIX applies the same methodology used to calculate the VIX but uses VIX options as its input instead of S&P 500 options. The result is a "volatility of volatility" reading.
The VVIX captures how much uncertainty exists around future VIX levels. When the VVIX rises sharply, it signals that options traders expect large moves in the VIX itself. A falling VVIX suggests calm expectations for volatility over the near term.
VVIX vs. VIX: Key Differences
The VIX measures expected volatility of the S&P 500 over the next 30 days. The VVIX measures expected volatility of the VIX over the next 30 days. This distinction matters because the VVIX can spike before the VIX itself moves, making it a potential leading indicator.
The VIX typically ranges between 12 and 35 under normal conditions. The VVIX operates on a wider scale, with a historical average near 85-90 and extreme readings stretching above 130 during market dislocations.
| Characteristic | VIX | VVIX |
|---|---|---|
| What it measures | Expected 30-day S&P 500 volatility | Expected 30-day VIX volatility |
| Input options | S&P 500 (SPX) options | VIX options |
| Normal range | 12 – 25 | 75 – 100 |
| Extreme high | Above 30-35 | Above 120-140 |
| Extreme low | Below 12 | Below 75 |
| Signal type | Coincident / slightly lagging | Potentially leading |
| Primary use | Gauge overall market fear | Gauge uncertainty about VIX direction |
| Mean-reversion speed | Moderate | Fast. Spikes collapse quickly |
Key VVIX Levels and What They Signal
The VVIX provides actionable signals at extreme readings. Sustained readings above 120 historically coincide with elevated fear and often precede SPY bottoming patterns. Readings below 75 indicate complacency, which can set the stage for unexpected volatility spikes.
VVIX Above 120: Peak Uncertainty
The VVIX above 120 signals that options traders expect large, rapid moves in the VIX. This level typically appears during market sell-offs, ahead of major economic data releases, or during geopolitical shocks. For SPY traders, VVIX spikes above 120 have historically marked areas where selling pressure begins to exhaust.
The VVIX tends to mean-revert faster than the VIX. After spiking above 120, the VVIX often collapses within days even if the VIX remains elevated. This fast mean-reversion creates a window for tactical long entries on SPY.
VVIX Below 75: Complacency Warning
The VVIX below 75 reflects low demand for VIX options protection. This reading suggests the market does not expect volatility to change meaningfully. While low VVIX can persist during strong bull trends, extended periods below 75 sometimes precede sharp volatility expansions.
Using the VVIX/VIX Ratio for SPY Trades
The VVIX/VIX ratio provides a normalized view of volatility expectations. The ratio typically ranges between 4 and 6 under normal conditions. When the ratio moves to extremes, it highlights divergences between actual volatility fear (VIX) and the uncertainty around that fear (VVIX).
High VVIX/VIX Ratio (Above 6)
A high VVIX/VIX ratio means uncertainty about VIX direction is elevated relative to the VIX level itself. This can occur when the VIX is relatively low but traders are loading up on VIX options. The reading warns that a volatility spike may be approaching, which would pressure SPY to the downside.
Low VVIX/VIX Ratio (Below 3.5)
A low VVIX/VIX ratio appears when the VIX has already spiked but VVIX demand has started fading. This divergence suggests the market has priced in the worst-case volatility scenario. SPY traders watch for this compression as a potential signal that the sell-off is nearing exhaustion.
VVIX as a Leading Indicator for SPY Reversals
The VVIX has demonstrated leading indicator properties at major market turning points. The mechanism works through options market positioning. When traders aggressively buy VIX calls to hedge, the VVIX spikes. This hedging wave typically peaks before the actual market bottom, because the most aggressive protection buying happens during the panic phase.
The VVIX peaked before SPY bottomed during several notable market events. During the February 2018 volatility explosion, the VVIX spiked above 170 before the VIX reached its intraday peak above 50. In March 2020, the VVIX reached extreme levels days before SPY found its pandemic low near 218.
The 2022 bear market showed a different VVIX pattern. Rather than a single spike, the VVIX oscillated between 90 and 130 throughout the year, reflecting sustained uncertainty. SPY traders who watched for VVIX exhaustion signals at each wave caught several tradable bounces within the downtrend.
How to Read VVIX Reversals
The VVIX reversal signal works best when three conditions align. First, the VVIX spikes above 120. Second, the VVIX begins to decline while the VIX remains elevated. Third, SPY holds a key support level or shows a bullish candlestick pattern. This three-part confirmation reduces false signals.
Traders who use the Volatility Box can overlay VVIX analysis with statistically derived support and resistance levels. When the VVIX signals exhaustion and SPY sits at a Volatility Box level, the confluence increases the probability of a reversal trade.
Historical VVIX Signals: Major Market Turns
The VVIX has provided actionable signals at several major turning points over the past decade. Each example demonstrates how VVIX extremes preceded or confirmed SPY reversals.
February 2018: Volmageddon
The VVIX surged above 170 as the VIX spiked from 11 to over 50 in a single session. Several volatility-linked ETPs collapsed, including the XIV. SPY dropped roughly 10% from its January 2018 high. The VVIX peaked and reversed before SPY found its February low, giving traders an early signal that the volatility panic was subsiding.
December 2018: Fed Policy Reversal
The VVIX climbed above 130 as SPY sold off 20% from its September peak. The VVIX began declining in late December before SPY bottomed on December 24. When the Federal Reserve signaled a pause in rate hikes, SPY rallied sharply. Traders watching the VVIX decline got positioned ahead of the reversal.
March 2020: Pandemic Bottom
The VVIX hit extreme levels above 200 during the fastest bear market decline in history. SPY fell from 339 to 218 in 23 trading days. The VVIX began mean-reverting several sessions before SPY printed its March 23 low. This confirmed that peak hedging demand had passed.
October 2022: Bear Market Low
The VVIX oscillated but showed a declining pattern of lower highs throughout 2022. By October, the VVIX was making lower highs even as SPY tested its yearly low near 348. This bullish divergence preceded the Q4 2022 rally that marked the end of the bear market.
How to Add VVIX to ThinkOrSwim
ThinkOrSwim allows you to chart the VVIX directly and build custom studies around it. The simplest approach is adding VVIX as a separate chart panel, but you can also create a custom VVIX/VIX ratio indicator.
Adding the VVIX Chart
Type "VVIX" into the ThinkOrSwim symbol box to pull up the CBOE VVIX index chart. Add horizontal lines at the 120 and 75 levels to mark the extreme zones. You can also add it as a lower study on your SPY chart for side-by-side analysis.
VVIX/VIX Ratio Study
The following ThinkScript calculates the VVIX/VIX ratio and plots it with reference lines at key thresholds. Add this as a lower study on any chart to monitor the ratio in real time.
# VVIX/VIX Ratio Study for ThinkOrSwim
# Plots the ratio with extreme-level reference lines

declare lower;

def vvixClose = close("VVIX");
def vixClose = close("VIX");

plot Ratio = vvixClose / vixClose;

plot HighLevel = 6;
plot LowLevel = 3.5;
plot MidLevel = 4.75;

Ratio.SetDefaultColor(Color.CYAN);
Ratio.SetLineWeight(2);

HighLevel.SetDefaultColor(Color.RED);
HighLevel.SetStyle(Curve.SHORT_DASH);
LowLevel.SetDefaultColor(Color.GREEN);
LowLevel.SetStyle(Curve.SHORT_DASH);
MidLevel.SetDefaultColor(Color.GRAY);
MidLevel.SetStyle(Curve.SHORT_DASH);

AddCloud(HighLevel, Ratio, Color.DARK_RED, Color.CURRENT);
AddCloud(Ratio, LowLevel, Color.CURRENT, Color.DARK_GREEN);

AddLabel(yes, "VVIX/VIX: " + Round(Ratio, 2),
  if Ratio > HighLevel then Color.RED
  else if Ratio < LowLevel then Color.GREEN
  else Color.YELLOW);
VVIX Extreme Alert Script
This ThinkScript fires alerts when the VVIX crosses above 120 or below 75, notifying you of extreme readings without watching the chart continuously.
# VVIX Extreme Level Alerts
# Fires alerts at key VVIX thresholds

declare lower;

input highThreshold = 120;
input lowThreshold = 75;

def vvixVal = close("VVIX");

plot VVIX = vvixVal;
plot HighLine = highThreshold;
plot LowLine = lowThreshold;

VVIX.SetDefaultColor(Color.CYAN);
VVIX.SetLineWeight(2);
HighLine.SetDefaultColor(Color.RED);
HighLine.SetStyle(Curve.SHORT_DASH);
LowLine.SetDefaultColor(Color.GREEN);
LowLine.SetStyle(Curve.SHORT_DASH);

Alert(vvixVal crosses above highThreshold,
  "VVIX Above " + highThreshold, Alert.BAR, Sound.Ding);
Alert(vvixVal crosses below lowThreshold,
  "VVIX Below " + lowThreshold, Alert.BAR, Sound.Ring);

AddLabel(yes, "VVIX: " + Round(vvixVal, 1),
  if vvixVal > highThreshold then Color.RED
  else if vvixVal < lowThreshold then Color.GREEN
  else Color.YELLOW);
Building a VVIX Trading Strategy for SPY
A systematic VVIX-based strategy for SPY combines extreme VVIX readings with price confirmation. The approach works on both daily and intraday timeframes, though the daily signals tend to produce the highest-quality setups.
Strategy Rules
Bullish setup (long SPY). The VVIX spikes above 120 and then closes back below 115. The VIX is above 25 but showing signs of flattening. SPY holds above a prior swing low or a key Supply and Demand Edge level. Enter long with a stop below the recent swing low.
Bearish setup (reduce or hedge). The VVIX drops below 75 and the VIX sits below 14. SPY is extended above its 20-day moving average. This setup warns of complacency and potential for a volatility expansion. Consider tightening stops or adding Bollinger Bands Reversal signals as a secondary filter.
Timeframe Considerations
The VVIX works best on the daily timeframe for swing trades lasting 3 to 15 days. Intraday VVIX movements can be noisy, though sharp intraday spikes above 130 during market hours often mark short-term capitulation points. For futures traders, the Futures Volatility Box can help identify precise entry levels when the VVIX signals a reversal.
Combining VVIX with Other Volatility Indicators
The VVIX gains effectiveness when combined with complementary volatility and breadth tools. No single indicator provides complete market context, and the VVIX is most useful as one component of a broader volatility framework.
VVIX + Cumulative TICK. When the VVIX signals exhaustion from above 120 and the Cumulative TICK shows positive divergence, the combined signal carries more weight than either alone. The TICK measures real-time buying pressure while the VVIX captures options positioning.
VVIX + VIX Term Structure. Combine VVIX readings with the VIX futures term structure. When the VVIX spikes while VIX futures shift into backwardation (front month above back months), the market is pricing in immediate risk. This double confirmation often marks significant SPY turning points.
VVIX + Squeeze. A VVIX returning to normal from extreme levels combined with a Multi-Timeframe Squeeze release on SPY creates a high-probability directional trade. The squeeze indicates compressed energy ready to expand in the direction the VVIX signal suggests.
Common VVIX Mistakes to Avoid
Treating VVIX as a standalone signal. The VVIX identifies conditions where reversals are more likely. The VVIX does not pinpoint exact tops or bottoms. Always pair VVIX readings with price confirmation.
Ignoring the trend context. A VVIX spike during a strong downtrend does not guarantee a bottom. In 2008, the VVIX reached extreme levels multiple times before the final low. Each spike produced a bounce, but the downtrend continued until March 2009.
Using stale data. The VVIX updates during market hours only. Pre-market and after-hours events can shift conditions before the VVIX reflects the change. Check VIX futures for overnight context before relying on the previous VVIX close.
Conflating VVIX with VIX. The VVIX can rise while the VIX falls, and vice versa. These are separate indicators measuring different aspects of volatility expectations. Always analyze both independently before drawing conclusions.
Tools for VVIX Analysis
TOS Indicators provides several tools that complement VVIX analysis for SPY trading. The Volatility Box identifies statistically significant price levels, and the squeeze indicators help confirm directional bias when VVIX signals trigger.
 The 4 Stages of FOMC Volatility for Day Trading
 Best ThinkOrSwim Indicators: 15 Custom Studies Every Trader Needs
 Trend Shift Scanner: Catch Reversals at the Inflection Point
 ES Futures Trading Strategy: Volatility Levels, ORB, and ATR-Based Entries
 Best Volume Indicators for ThinkOrSwim: Relative Volume, VWAP, and OBV