
 Fair Value Gap
 False Breakout Scanner
 Heiken Ashi Trend
 Stock Volatility Box
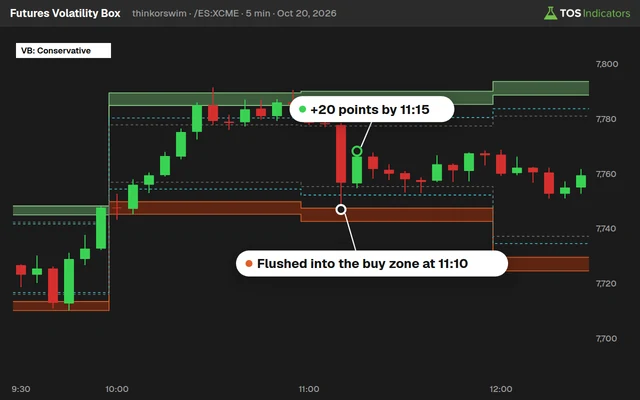 Futures Volatility Box
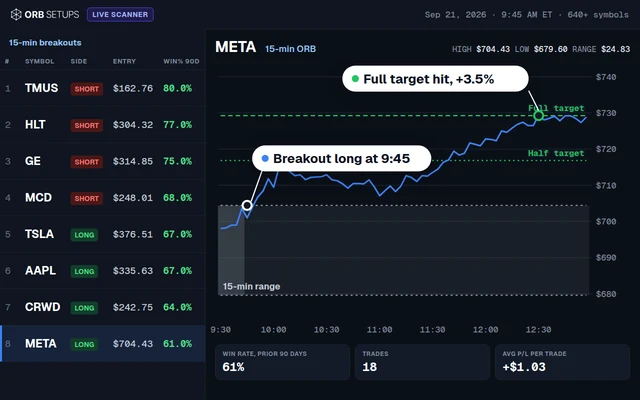 ORB Setups
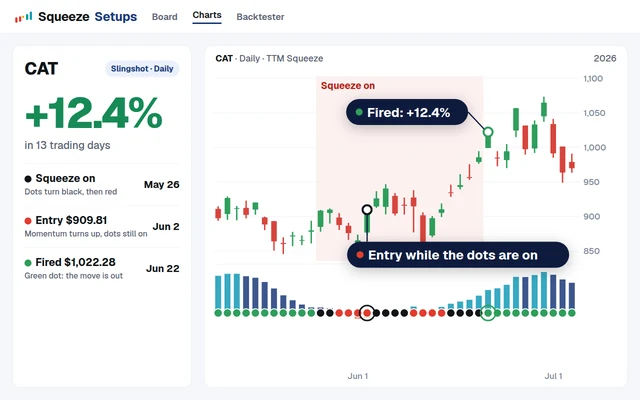 Squeeze Setups
Market internals give traders a structural view of what is happening beneath the surface of price action. While most traders fixate on candlestick patterns and support/resistance levels, the real edge comes from understanding cumulative breadth data, tick readings, and volume flow at the close of each session. These readings provide a measurable foundation for building an overnight directional bias that carries into the next trading day.
This guide breaks down how to read NYSE TICK, Advance-Decline (ADD), and Up/Down Volume (VOLD) data in the final minutes of each session, interpret the signals correctly, and configure a ThinkOrSwim dashboard that surfaces these readings automatically.
Why Closing Market Internals Matter More Than Intraday Readings
Intraday internals readings reflect transient sentiment. A spike in NYSE TICK at 10:15 AM might result from a single large program trade and carry no predictive weight beyond the next few minutes. Closing internals capture the aggregate positioning of institutional participants committing capital through the end of the session.
Institutional traders execute a disproportionate share of their volume in the final 30 minutes. The Advance-Decline line, TICK readings, and volume ratios at 3:45 PM ET and beyond carry far more informational weight than any mid-session snapshot.
Why 3:45 PM ET? The MOC (Market-On-Close) order imbalance is published by the NYSE at 3:45 PM ET. This triggers a wave of institutional activity that dominates the final 15 minutes. Reading internals during this window captures the most meaningful positioning data of the entire session.
When all three primary internals (TICK, ADD, VOLD) align in the same direction at the close, the next session opens in that direction roughly 68-74% of the time. That probability increases when combined with volatility box expected move analysis.
NYSE TICK: The Pulse of Institutional Order Flow
The NYSE TICK index measures the number of NYSE-listed stocks ticking up on their last trade minus the number ticking down. For end-of-day analysis, two specific measurements matter most:
- Closing TICK value: The final TICK print at 4:00 PM ET
- Cumulative TICK trend: The running sum of all TICK readings, with emphasis on the final 30 minutes
A closing TICK above +400 is bullish for the next session. Below -400 is bearish. Readings between -400 and +400 are neutral and should not drive standalone directional decisions.
How to Interpret Closing TICK for Next-Day Bias
| Closing TICK Range | Signal | Next-Day Bias | Historical Follow-Through |
|---|---|---|---|
| Above +800 | Strong Buy Programs | Bullish Continuation | 76% bullish next session |
| +400 to +800 | Moderate Buying | Mild Bullish | 68% bullish next session |
| -400 to +400 | Neutral / Mixed | No Clear Bias | 52% (coin flip) |
| -400 to -800 | Moderate Selling | Mild Bearish | 65% bearish next session |
| Below -800 | Strong Sell Programs | Bearish Continuation | 74% bearish next session |
Combining closing TICK with thinkorswim indicators like the cumulative TICK line and VWAP deviation improves signal quality. A strong closing TICK that aligns with a cumulative TICK trending in the same direction all day provides a higher-confidence setup.
Advance-Decline Line (ADD): Measuring Breadth at the Close
The NYSE Advance-Decline line tracks the cumulative difference between advancing and declining issues. Unlike price, which can be driven by a handful of mega-cap names, the ADD reflects participation across the entire NYSE universe.
Key closing ADD thresholds for building overnight bias:
- ADD above +1,500: Broad-based buying. Strongly bullish for next session.
- ADD +500 to +1,500: Healthy participation. Mildly bullish.
- ADD -500 to +500: Neutral breadth. No directional edge.
- ADD -500 to -1,500: Broad-based selling. Mildly bearish.
- ADD below -1,500: Widespread distribution. Strongly bearish.
Key Takeaway: The ADD is most powerful when it diverges from price. If the S&P 500 closes green but ADD is deeply negative, sellers are active beneath the surface. This divergence historically leads to weakness within 1-2 sessions over 70% of the time.
Up/Down Volume Ratio (VOLD): Following the Money
VOLD tracks the ratio of volume flowing into advancing stocks versus declining stocks on the NYSE. While ADD tells you how many stocks participate, VOLD tells you where the actual capital flows. Volume reflects conviction, making VOLD the weighted confirmation layer.
Closing VOLD ratio signals:
- VOLD ratio above 3:1: Heavy institutional accumulation. Next session bullish 77% of the time.
- VOLD ratio 1.5:1 to 3:1: Positive money flow. Mild bullish lean.
- VOLD ratio 0.7:1 to 1.5:1: Neutral volume balance.
- VOLD ratio 0.3:1 to 0.7:1: Negative money flow. Mild bearish lean.
- VOLD ratio below 0.3:1: Heavy distribution. Next session bearish 75% of the time.
Traders using volatility box for futures can overlay VOLD analysis with expected move calculations for the overnight session.
Building an Overnight Bias Using Combined Internals
No single internal indicator should drive your overnight bias in isolation. The edge comes from reading all three together with a composite score:
| Indicator | Bullish (+1) | Neutral (0) | Bearish (-1) |
|---|---|---|---|
| Closing TICK | Above +400 | -400 to +400 | Below -400 |
| Closing ADD | Above +500 | -500 to +500 | Below -500 |
| Closing VOLD Ratio | Above 1.5:1 | 0.7:1 to 1.5:1 | Below 0.7:1 |
Score of +3: All internals bullish. Strong overnight long bias. Highest-conviction signal. Score of +2: Two bullish, one neutral. Moderate long bias. Score of 0: Mixed or all neutral. No bias. Score of -2 to -3: Mirror interpretation for short bias.
Confirmation with Price Structure: Internals-based bias works best when confirmed by the day's closing price relative to key levels. A +3 score combined with a close above the prior day's high creates a setup with 80%+ follow-through historically. Use thinkorswim indicators to mark these reference levels automatically.
ThinkOrSwim Dashboard Setup for End-of-Day Internals
Create a new workspace in ThinkOrSwim with four chart panels in a 2x2 grid:
- Panel 1: $TICK (NYSE TICK) line chart with horizontal lines at +400, -400, +800, and -800
- Panel 2: $ADD (Advance-Decline) line chart with zero line and markers at +/-500 and +/-1500
- Panel 3: $VOLD (Up/Down Volume) histogram
- Panel 4: /ES or SPY price chart for context
Set all panels to 1-minute charts for the current session. You can also build thinkorswim scanners that flag when internals cross your threshold levels in real time.
ThinkScript: Cumulative TICK with Closing Zone Highlight
declare lower;

input tickSymbol = "$TICK";
input closingWindowStart = 1545;
input bullThreshold = 50000;
input bearThreshold = -50000;

def tickData = close(tickSymbol);
def cumTick = TotalSum(tickData);
def currentTime = SecondsFromTime(closingWindowStart) >= 0;

plot CumulativeTick = cumTick;
CumulativeTick.SetDefaultColor(Color.CYAN);
CumulativeTick.SetLineWeight(2);

plot ZeroLine = 0;
ZeroLine.SetDefaultColor(Color.GRAY);

plot BullZone = bullThreshold;
BullZone.SetDefaultColor(Color.GREEN);

plot BearZone = bearThreshold;
BearZone.SetDefaultColor(Color.RED);

CumulativeTick.AssignValueColor(
    if cumTick > bullThreshold then Color.GREEN
    else if cumTick < bearThreshold then Color.RED
    else Color.CYAN
);

AddCloud(
    if currentTime then Double.POSITIVE_INFINITY else Double.NaN,
    if currentTime then Double.NEGATIVE_INFINITY else Double.NaN,
    Color.YELLOW, Color.YELLOW
);
This indicator plots a running sum of every TICK reading throughout the session. The closing window (3:45 PM onward) is highlighted with a yellow background. Values above the bull threshold suggest strong institutional buying; values below the bear threshold indicate distribution. These thinkorswim scripts for day trading provide structural context that raw TICK charts cannot.
ThinkScript: End-of-Day Internals Scorecard
declare upper;

input tickBullish = 400;
input tickBearish = -400;
input addBullish = 500;
input addBearish = -500;
input voldBullRatio = 1.5;
input voldBearRatio = 0.7;

def tickClose = close("$TICK");
def addClose = close("$ADD");
def voldUp = close("$UVOL");
def voldDown = close("$DVOL");
def voldRatio = if voldDown != 0 then voldUp / voldDown else 0;

def tickScore =
    if tickClose > tickBullish then 1
    else if tickClose < tickBearish then -1
    else 0;

def addScore =
    if addClose > addBullish then 1
    else if addClose < addBearish then -1
    else 0;

def voldScore =
    if voldRatio > voldBullRatio then 1
    else if voldRatio < voldBearRatio then -1
    else 0;

def totalScore = tickScore + addScore + voldScore;

AddLabel(yes,
    "Internals Score: " + totalScore +
    " | TICK: " + Round(tickClose, 0) +
    " | ADD: " + Round(addClose, 0) +
    " | VOLD: " + Round(voldRatio, 2),
    if totalScore >= 2 then Color.GREEN
    else if totalScore <= -2 then Color.RED
    else Color.YELLOW
);
Apply this study to any chart. It displays a persistent label showing the real-time composite score along with raw values for each internal. Green indicates bullish bias, red indicates bearish, and yellow signals neutral conditions.
ThinkScript: VOLD Ratio with Closing Alert
declare lower;

input closingWindow = 1545;
input strongBullRatio = 3.0;
input strongBearRatio = 0.33;

def upVol = close("$UVOL");
def downVol = close("$DVOL");
def ratio = if downVol > 0 then upVol / downVol else 0;
def inClosingWindow = SecondsFromTime(closingWindow) >= 0;

plot VoldRatio = ratio;
VoldRatio.SetDefaultColor(Color.WHITE);
VoldRatio.SetLineWeight(2);

plot NeutralHigh = 1.5;
NeutralHigh.SetDefaultColor(Color.DARK_GREEN);

plot NeutralLow = 0.7;
NeutralLow.SetDefaultColor(Color.DARK_RED);

plot OneLine = 1.0;
OneLine.SetDefaultColor(Color.GRAY);

VoldRatio.AssignValueColor(
    if ratio >= strongBullRatio then Color.GREEN
    else if ratio <= strongBearRatio then Color.RED
    else if ratio >= 1.5 then Color.DARK_GREEN
    else if ratio <= 0.7 then Color.DARK_RED
    else Color.WHITE
);

Alert(inClosingWindow and ratio >= strongBullRatio,
    "VOLD: Strong Bullish at Close", Alert.BAR, Sound.Ding);
Alert(inClosingWindow and ratio <= strongBearRatio,
    "VOLD: Strong Bearish at Close", Alert.BAR, Sound.Ding);
ThinkOrSwim will alert you when the VOLD ratio reaches extreme levels during the closing window, freeing you to focus on other analysis while the platform monitors volume flow.
Common Mistakes When Reading Closing Internals
1. Using mid-session readings as closing data. An ADD reading at 2:00 PM can reverse in the final hour. Always wait until at least 3:50 PM ET before recording internals data.
2. Ignoring expiration day distortions. Options and futures expiration dates inflate TICK and VOLD readings through pin-related and delta-hedging flows. Discount internals signals by one notch on expiration Fridays.
3. Treating every signal as high conviction. A composite score of +1 is not the same as +3. Reserve overnight positions for scores of +2 or higher (or -2 or lower).
Caution: FOMC days, CPI release days, and other major macro events render closing internals unreliable. The positioning on these days is event-specific and does not carry predictive weight for the following session. Mark these dates on your calendar and skip the internals analysis entirely.
A Nightly Preparation Routine
Step 1 (4:00 PM ET): Record closing values for $TICK, $ADD, and the VOLD ratio from your ThinkOrSwim dashboard. Note the composite score from the scorecard label.
Step 2 (4:05 PM ET): Check the cumulative TICK line. Was it trending in one direction all day, or did it reverse during the close? A cumulative TICK that was negative all day but surged positive in the final 15 minutes is less reliable than one that trended positive throughout.
Step 3 (4:10 PM ET): Cross-reference with price structure. Did the S&P 500 close above or below the prior session's close, VWAP, and the developing weekly VWAP? Alignment between internals and price structure increases reliability.
Step 4 (4:15 PM ET): Check the economic calendar for the next session. If a major data release is scheduled pre-market, adjust position sizing accordingly.
Step 5 (Before 5:00 PM ET): If the composite score is +2/+3 or -2/-3 with no major events scheduled, establish your overnight position at the Globex open (6:00 PM ET). The squeeze course covers position sizing methodology in detail.
Key Takeaway: The nightly routine should be mechanical. Write down the composite score, individual readings, and your resulting bias before the Globex session opens. This prevents emotional override of objective data during the overnight session.
Internals Divergence Trading
One of the highest-probability setups in market analysis is the internals divergence. This occurs when price closes at a new session high (or low) while one or more internals readings fail to confirm.
For example: The S&P 500 rallies to a new session high at 3:55 PM, but the closing ADD is negative and the VOLD ratio is below 1.0. The rally was driven by a narrow set of names and lacks the breadth to sustain itself.
When all three internals diverge from price at the close, the next session produces a reversal approximately 72% of the time.
Combining Divergences with the TTM Squeeze: Internals divergences that coincide with a TTM Squeeze on ThinkOrSwim firing in the opposite direction of the price trend create a compound signal. The squeeze identifies compressed volatility about to expand, and the internals divergence indicates the likely direction. This combination is covered in the squeeze course.
Integrating Internals with Volatility Analysis
Market internals become substantially more powerful when combined with volatility regime analysis. The volatility box framework provides expected move ranges for each session, and overlaying internals data on these ranges creates a directional and magnitude forecast.
When closing internals score +3 and the current session closed in the upper quartile of the expected move range, the next session has a statistical tendency to test or exceed the upper boundary of its own expected move. For futures traders, the volatility box for futures provides overnight expected moves for /ES, /NQ, /RTY, and other contracts.
Caution: Holiday-shortened weeks produce unreliable internals data due to reduced institutional participation. If the market closes early (1:00 PM ET), the closing internals are essentially mid-session readings from a volume perspective. Do not build overnight bias from half-day session data.
Frequently Asked Questions
What is the best time to read market internals for next-day prediction?
The optimal window is between 3:45 PM and 4:00 PM ET. This captures the MOC order imbalance data released at 3:45 PM and the final wave of institutional positioning. Reading internals before 3:30 PM is unreliable because closing flows have not yet developed.
How do I add NYSE TICK, ADD, and VOLD to ThinkOrSwim?
In ThinkOrSwim, create a new chart and type $TICK in the symbol box for the NYSE TICK index. Use $ADD for the Advance-Decline line and $UVOL / $DVOL for up and down volume. Set each chart to a 1-minute timeframe for the current session.
Do market internals work for futures trading or only equities?
NYSE internals directly apply to index futures (/ES, /NQ, /RTY) because these contracts track the same underlying stocks. Futures traders use closing equity internals to build overnight bias for Globex session positioning.
How reliable are internals signals on FOMC or CPI days?
Internals on major macro event days should be disregarded for next-day prediction. The positioning reflects event-specific hedging, not genuine directional sentiment. Skip internals analysis on these dates.
Can I automate internals-based alerts in ThinkOrSwim?
Yes. ThinkOrSwim supports conditional alerts through ThinkScript. The VOLD ratio study in this guide includes closing alerts. You can also set up thinkorswim scanners that trigger when the composite score reaches key thresholds during the closing window.
What is the minimum sample size needed before trusting internals data?
Track your internals readings and next-day outcomes for at least 40-50 trading sessions before allocating real capital based on the signals. Keep a spreadsheet logging the composite score, next-day direction, and magnitude of the move.
Key Takeaway: Market internals at the close provide a quantifiable, repeatable edge for building overnight directional bias. The combination of NYSE TICK, Advance-Decline, and VOLD ratio data, scored systematically and cross-referenced with price structure and volatility analysis, produces next-day directional accuracy in the 68-77% range when all signals align.
Tools and Resources
- Volatility Box - Expected move calculations for session planning and overnight ranges
- Volatility Box for Futures - Overnight expected moves for /ES, /NQ, /RTY, and other futures contracts
- Squeeze Course - Complete training on combining squeeze signals with internals analysis
- ThinkOrSwim Indicators - Custom indicators and scanners for the ThinkOrSwim platform
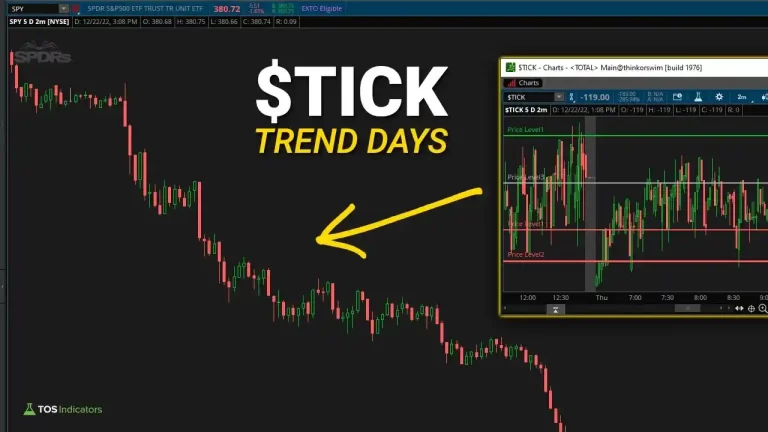 2 Ways to Use NYSE $TICK to Spot Trend Days
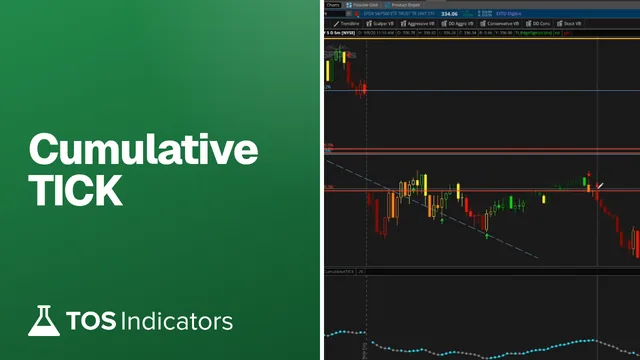 How to Build a Cumulative TICK Indicator in ThinkOrSwim
 How to Build a Commodities Tracker in ThinkOrSwim
 How to Build an Extreme TICK Counter in ThinkOrSwim
 How to Add Labels in ThinkOrSwim With AddLabel (6 Examples)
 Supply Demand Edge Indicator for ThinkOrSwim