
 Fair Value Gap
 False Breakout Scanner
 Heiken Ashi Trend
 Stock Volatility Box
 Futures Volatility Box
 ORB Setups
 Squeeze Setups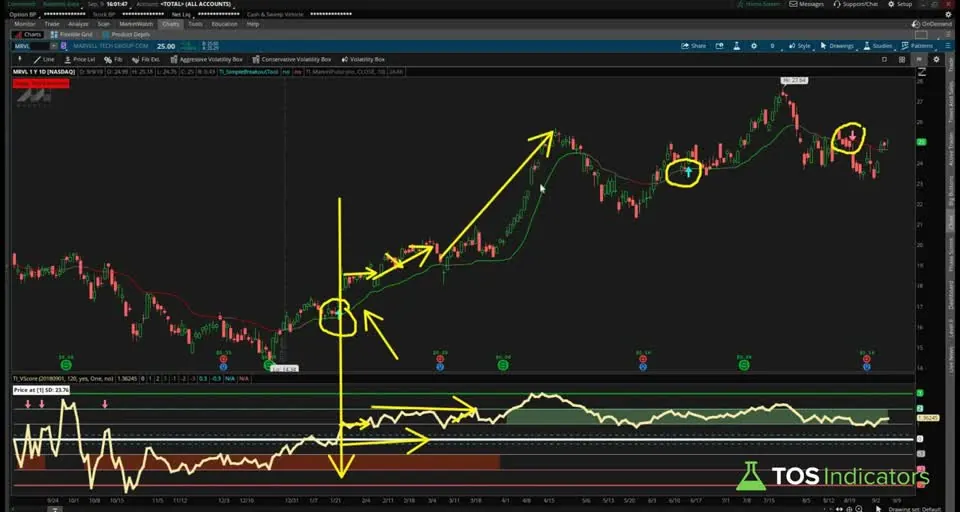
On this page
Overview
In this tutorial I build the Simple Breakout Tool, a free ThinkOrSwim indicator that boils a breakout setup down to one bullish or bearish arrow. It fires when price crosses the 10-period simple moving average, and only when the 100-period average, the slow stochastics and the MACD histogram all agree.
Then I put it on Amazon, Apple and Marvell charts next to our free Market Pulse and V Score indicators. Market Pulse helps me choose between buying an option and selling a credit spread, and the V Score sets the stop and targets. It's for traders who want a clear yes-or-no entry instead of rows of partial signals.
Key Takeaways
- The Simple Breakout Tool plots a bullish arrow when price closes above the 10-period SMA after closing at or below it on the previous bar. The bearish arrow is the same cross to the downside.
- Every arrow also needs price on the right side of the 100-period SMA, slow stochastic K and D (21 and 3) below 80 for bullish or above 20 for bearish, and the MACD histogram above 0 for bullish or below 0 for bearish.
- The download has 3 inputs for the moving average lengths: 10, 30 and 100. The 30-period average is calculated, but no signal uses it.
- In the video, a bullish signal in Market Pulse acceleration or a bearish one in deceleration means buying an at-the-money call or put with at least 60 days left. In accumulation or distribution, I sell an at-the-money credit spread.
- I plan exits with the V Score: the stop goes outside the standard deviation line one step against the trade from where price is, and the targets are the next lines in the trade's direction.
What the Simple Breakout Tool Does
The Simple Breakout Tool is a free ThinkOrSwim indicator that gives one clear trade decision: a bullish arrow, a bearish arrow, or nothing. A subscriber asked me to build a free version of a paid breakout indicator, which shows 3 rows of squares, triangles and circles built from the 10, 30 and 100-period SMAs, the stochastics and the MACD histogram.
Boiled down, those rows work like filters in a scan. I kept the same ingredients and dropped the shapes. The goal is to spot breakouts early enough to take part in most of the move, and I set 3 rules for the tool:
- Keep it simple. Less is more: one arrow on the chart, no rows of shapes.
- Fewer, more accurate entries. I'd rather take fewer trades that add up to a better overall P&L.
- Binary and programmatic. The trade is either on or it isn't, with no "two out of three" signals.
The 3 Filters Behind Every Signal
The Simple Breakout Tool uses a cross of the 10-period SMA as its trigger. The cross alone doesn't print an arrow: the trend filter, the stochastics and the MACD histogram all have to agree on the same bar.
| Check | Setting | Bullish arrow | Bearish arrow |
|---|---|---|---|
| Trigger | 10-period SMA | Close above the 10 SMA, previous close at or below it | Close below the 10 SMA, previous close at or above it |
| Trend | 100-period SMA | Close above the 100 SMA | Close below the 100 SMA |
| Slow stochastics | K 21, D 3, levels 80 and 20 | SlowK and SlowD both below 80 | SlowK and SlowD both above 20 |
| Momentum | MACD histogram | Above 0 | Below 0 |
The 100 SMA keeps each trade on the right side of the trend. The stochastics, slowed down to 21 and 3, keep the tool from buying into overbought readings or selling into oversold ones.
How to Install the Simple Breakout Tool
The Simple Breakout Tool is a free download that includes the study and 2 scan links.
- Download the .zip from this page. It holds TI_SimpleBreakoutToolSTUDY.ts and Simple-Breakout-Scans.txt.
- Import the .ts file as a study. Our guide on how to import a study into ThinkOrSwim walks through it.
- To build it yourself instead, click the Studies icon on a chart, choose Create, name the study (I called mine TI simple breakout tool), and paste in the code.
- Click OK and add the study to a chart. An arrow marks each bar where every check passes.
- To run the scans, load the Bullish or Bearish link from the .txt file as a shared item.
The Inputs and Settings
The Simple Breakout Tool download has 3 inputs, one for each moving average length. The stochastic and MACD settings are written into the code, so you change those by editing it.
| Setting | Default | Where to change it | Role in the signals |
|---|---|---|---|
fastSMALength | 10 | Input | The crossover trigger |
mediumSMALength | 30 | Input | None. It is calculated but not used |
slowSMALength | 100 | Input | The trend filter |
| StochasticSlow levels | 80 overbought, 20 oversold | Code | The overbought and oversold filter |
| StochasticSlow K and D | 21 and 3 | Code | How slow the stochastics are |
MACDHistogram() | Study defaults | Code | The momentum filter |
The variable names stay SMA10, SMA30 and SMA100 even if you change the lengths. Set fastSMALength to 20 and the trigger becomes a 20-period cross that the code still calls SMA10.
How the Code Works
The Simple Breakout Tool code comes in 3 chunks: the moving averages, the slow stochastics and the MACD histogram. Two plot lines then bring them together into a bullish signal and a bearish signal.
Chunk 1: The Simple Moving Averages
This step’s code is free with an account. Create one or sign in.
SimpleMovingAvg takes the price, here the close, and a length. In the video I typed the lengths in directly. The download moves them into inputs so you can change them from the settings window.
Chunk 2: The Slow Stochastics
This step’s code is free with an account. Create one or sign in.
StochasticSlow(80,20,21,3) calls ThinkOrSwim's built-in slow stochastics with 80 and 20 as the overbought and oversold levels and 21 and 3 for the K and D settings. The name after the dot picks the value: SlowK, SlowD, Overbought or Oversold.
Chunk 3: The MACD Histogram
This step’s code is free with an account. Create one or sign in.
One line brings in the MACD histogram. I gave it a short name, MH, so it's quick to type in the signal lines.
The Bullish Signal
This step’s code is free with an account. Create one or sign in.
Read it left to right. This bar closed above the 10 SMA, and the previous bar closed at or below its 10 SMA, so price crossed above it. The close is also above the 100 SMA.
Neither StoSloK nor StoSloD is above the overbought level, and the MACD histogram is above 0. If all of that is true the plot returns 1, otherwise 0.
The Bearish Signal
This step’s code is free with an account. Create one or sign in.
The bearish line flips each test: a close below the 10 SMA after a close at or above it, a close below the 100 SMA, both stochastic lines above the oversold level, and a negative MACD histogram.
Drawing the Arrows
This step’s code is free with an account. Create one or sign in.
Boolean_Arrow_Up draws an up arrow on every bar where bullish is 1, and Boolean_Arrow_Down does the same for bearish. A line weight of 5 makes the arrows easy to spot.
Choosing the Trade With Market Pulse
The Market Pulse indicator sorts price action into 4 stages, and I use the stage to decide how to trade each Simple Breakout signal. On the Market Pulse line, red is deceleration and green is acceleration. Gray after red is distribution, and gray after green is accumulation.
| Signal | Market Pulse stage | What I do in the video |
|---|---|---|
| Bullish | Acceleration (green) | Buy an at-the-money call with at least 60 days to expiration |
| Bearish | Deceleration (red) | Buy an at-the-money put with at least 60 days to expiration |
| Bullish | Accumulation (gray after green) | Sell an at-the-money put credit spread, risking 1 to make 1 |
| Bearish | Distribution (gray after red) | Sell an at-the-money call credit spread |
| Bearish | Acceleration, or chopping between acceleration and accumulation | Skip it |
The stage also tells you when to stay out. When Market Pulse says money is coming into a stock, I don't short it. Buying 60 days or more gives a trade time to chop before the breakout, and a credit spread collects time decay while price chops.
Setting Stops and Targets With the V Score
The V Score indicator plots standard deviation lines around a mean, and I use them to plan the stop and targets before I take a Simple Breakout trade. I draw a line from the signal bar down to the V Score and find the standard deviation line price is closest to.
- Stop: outside the next line against the trade. For a long near the 0 line, that's outside the -1 line. For a short near the 0 line, it's outside the +1 line.
- Targets: the next lines in the direction of the trade. A long near the 0 line targets +1 for T1 and +2 for T2. If you scale out in 3 pieces, the next line is T3, as in the Apple short below.
The V Score's labels show the price of each line, so you can turn the plan into real orders: conditional orders tied to those prices if you trade options, or a stop and targets if you trade the stock.
Examples From the Video
The Simple Breakout Tool was tested on 3 charts in the video: Amazon, Apple and Marvell. These are trade plans I drew on screen. The video doesn't run a backtest or give a win rate.
Amazon
Amazon's first bearish signal came during deceleration, so the plan was an at-the-money put. Price was closest to the -1 line on the V Score, so the stop went outside the 0 line and the first target was the -2 line. Price moved lower after the signal.
Later bearish signals came while Market Pulse chopped between acceleration and accumulation, so I passed on those shorts.
A bullish signal then triggered as the stage went from acceleration to accumulation. That called for an at-the-money put credit spread sold at the close, risking 1 to make 1. Price was closest to the 0 line, so the stop went outside -1 with targets at +1 and +2. The spread worked out and reached its full gain by expiration.
Apple
Apple had 2 bearish signals and 1 bullish signal. The first bearish signal came in deceleration, so the plan was an at-the-money put with at least 60 days left. Price was closest to the 0 line, so the stop went outside +1, with targets at -1, -2 and -3. Price dropped through all 3 targets.
The second bearish signal came while Market Pulse showed acceleration, so I skipped it without checking the V Score. The bullish signal came in acceleration too, which called for an at-the-money call with at least 60 days left. Price was closest to the 0 line, so the target was +1 and the stop went outside -1.
Marvell
Marvell had 2 bullish signals and 1 bearish signal. The first bullish signal came in acceleration, so the plan was an at-the-money call with at least 60 days left. Price was closest to the +1 line, so the stop went outside the 0 line. The stock went sideways, broke out, pulled back and kept moving higher, and the 60 days gave it room to chop.
The second bullish signal came after Market Pulse moved from deceleration through distribution and acceleration into accumulation. That called for an at-the-money put credit spread with at least a 1-to-1 risk to reward. Price chopped sideways, and the spread collected time decay before the stock moved in the trade's direction. With the spread, I didn't need the timing right, only the direction.
The last signal was bearish, in deceleration, so the plan was an at-the-money put with at least 60 days left. The entry came at the close of the signal bar, closest to the +1 line, so the stop went outside the +2 line. With the V Score's stop label set to 2, that line was at $27.17.
The target for that trade was the 0 line, the mean. It hadn't played out when I recorded the video.
How I Use the Simple Breakout Tool
The Simple Breakout Tool gives me the entry, Market Pulse picks the strategy, and the V Score sets the stop and targets. Together they filter out noise, like a short signal in a stock that's accelerating, and they put a price on every order.
An arrow is where I start planning a trade. I set the stop from the V Score before I enter, and I size the position so a stop-out costs a small, fixed share of my account. Not every breakout follows through, so it helps to know how to spot false breakouts too.
At the end of the video I planned to turn the tool into a scan. The download now includes Bullish and Bearish scan links, and members can follow the Simple Breakout Tool Scans tutorial.
Ways to Customize It
The Simple Breakout Tool keeps its moving average lengths in inputs and its other settings in a few lines of code, so it's quick to adjust.
- Change the trigger or trend length. Edit
fastSMALengthorslowSMALengthin the study settings. - Change the stochastics. Edit the 4 numbers in each of the 4
StochasticSlowlines. Keep all 4 lines the same so K, D and the levels match. - Count the signals on a chart. Our AddLabel tutorial copies this tool's signal code, changes the two plots to
def, and usesTotalSumto show how many bullish and bearish signals the chart has. - Read the MACD histogram better. Our MACD breakdown for ThinkOrSwim explains what the histogram measures.
The Simple Breakout Tool on real charts
Drawn from real daily bars with the code on this page, through Oct 20, 2026. The bullish arrow fires when the close crosses above the 10-day SMA while it is above the 100-day SMA, both slow stochastic lines (21, 3) are under 80, and the MACD histogram is above zero. The bearish arrow is the mirror image. I picked the most recent bullish arrow on a well-known name that was higher 10 trading days later, and the most recent that was not.
XLK, Sep 11, 2026: a breakout that held
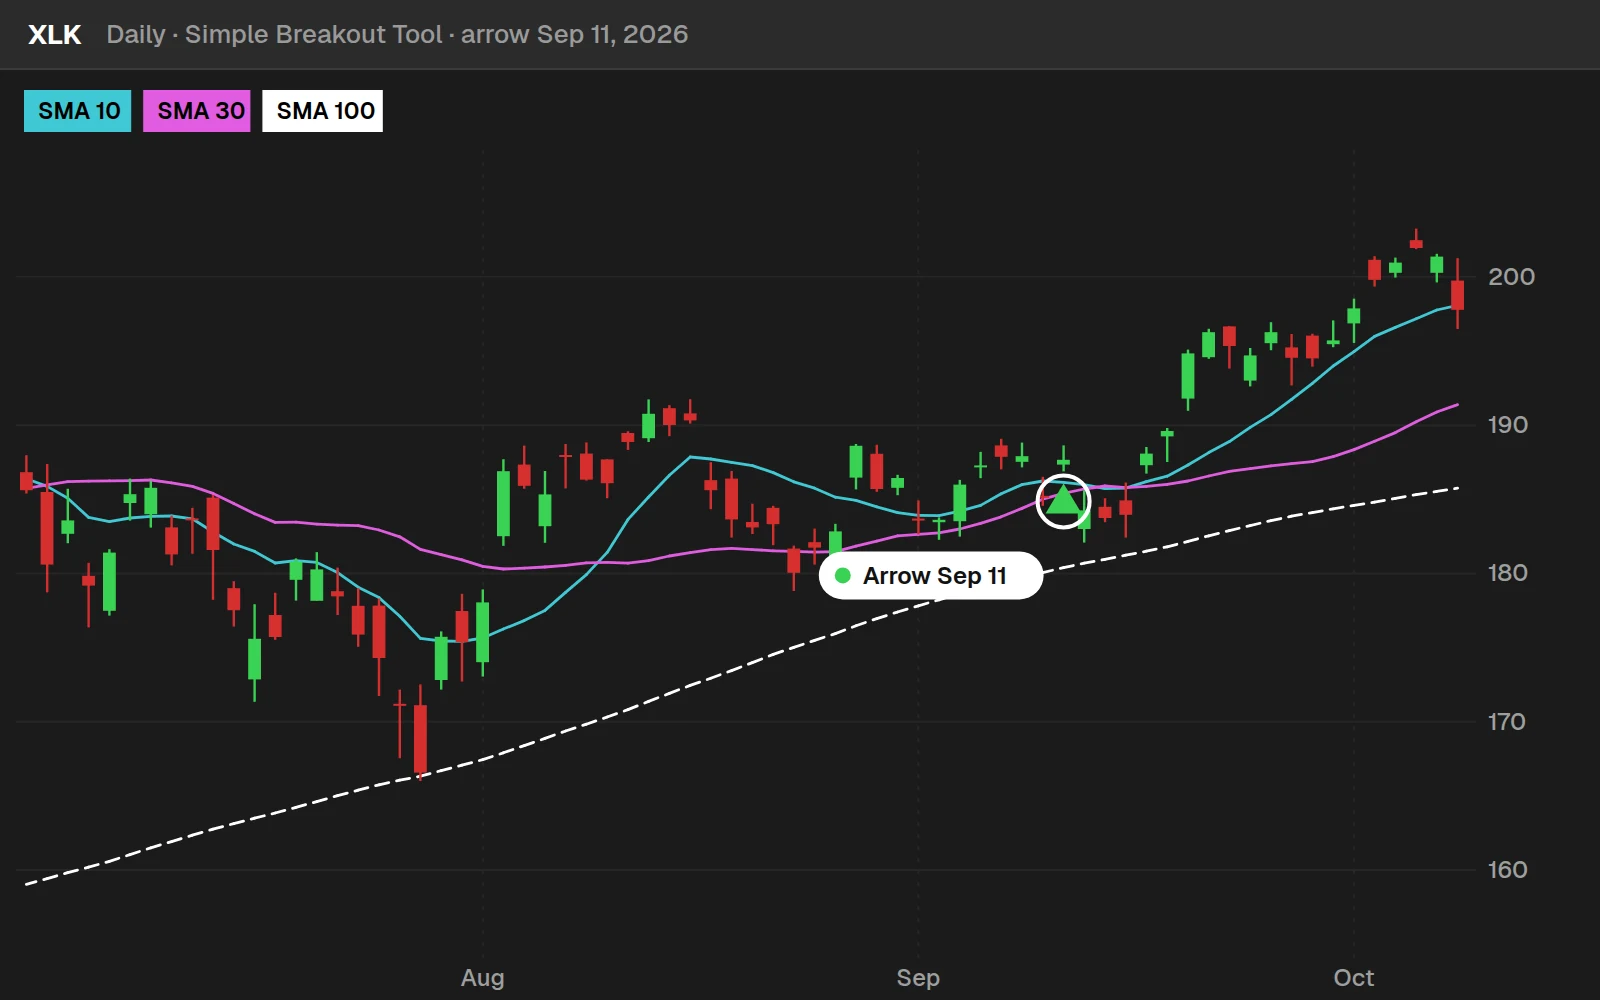
XLK closed at $187.67 on the arrow and at $196.27 ten trading days later, +4.6%.
V, Sep 2, 2026: one that failed
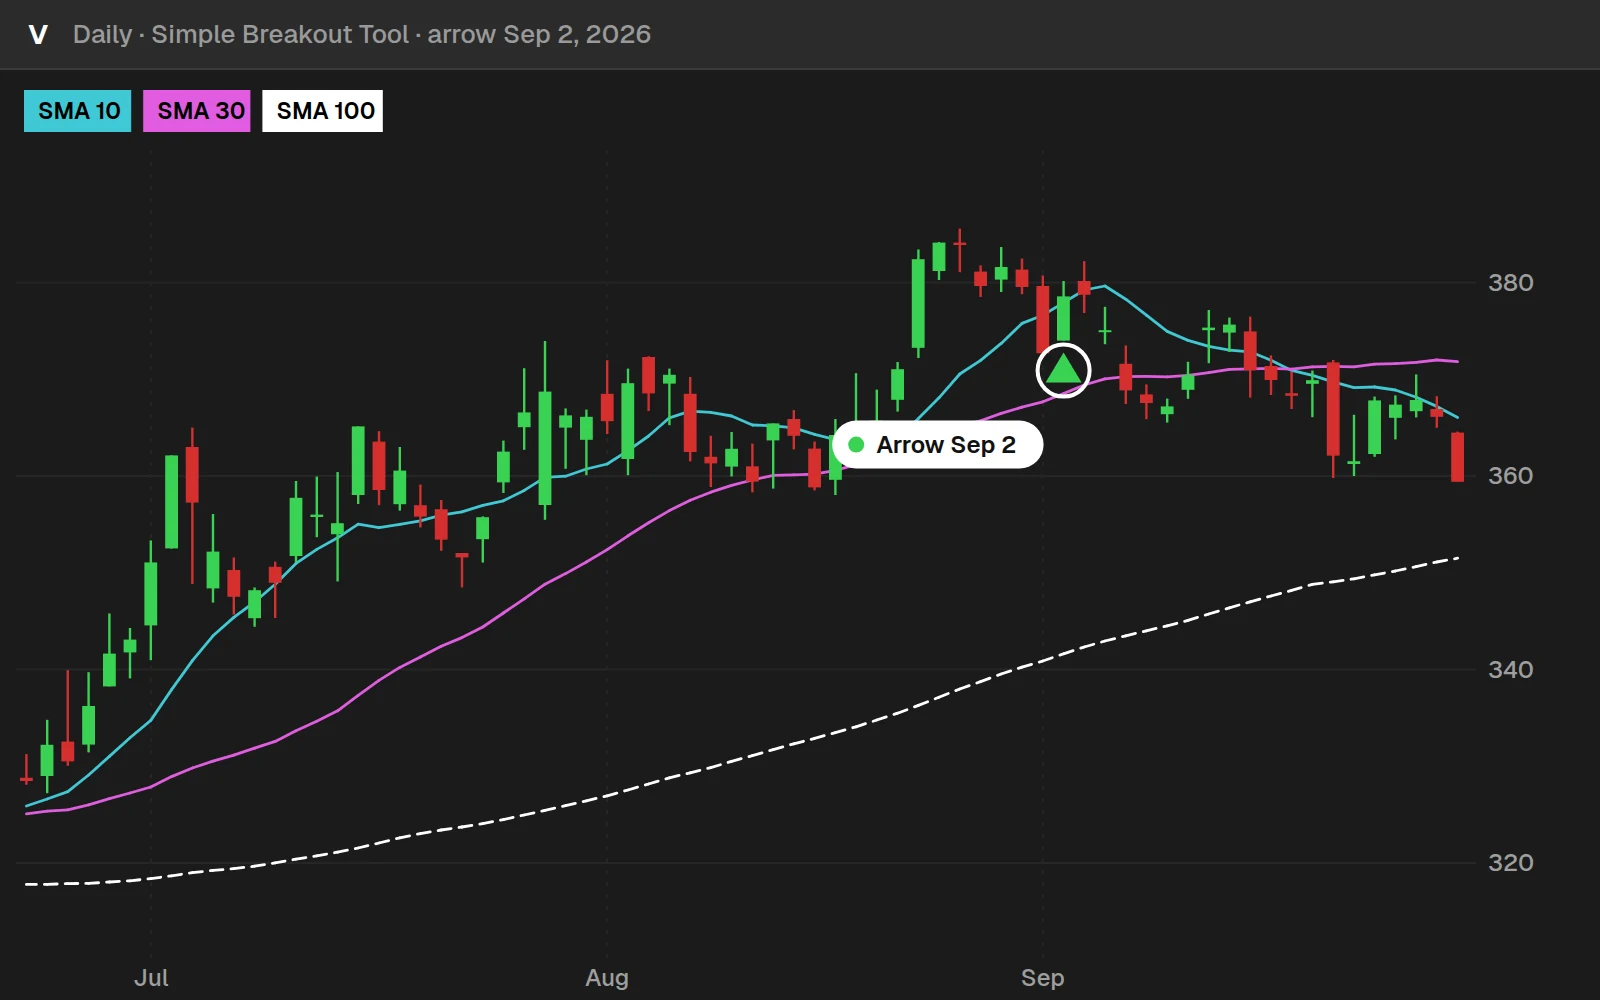
V closed at $378.57 on the arrow and at $369.93 ten trading days later, -2.3%.
By the numbers
Daily bars for 648 stocks and ETFs through Oct 20, 2026: most stocks from July 2024, the 14 ETFs from 2016, counted once the 100-day SMA exists. Against every day in the same symbols over the same bars. Bearish arrows were followed by a lower close 10 days later 47.1% of the time.
Full thinkScript code
Create a free account or sign in to copy all 29 lines and download the file.
Download
Download the Simple Breakout Tool for ThinkOrSwim. The download is a .zip with two files. TI_SimpleBreakoutToolSTUDY.ts is the indicator, which you import as a study. Simple-Breakout-Scans.txt has two ThinkOrSwim shared links, one for a bullish scan and one for a bearish scan. In ThinkOrSwim, click Setup in the top right corner, choose Open shared item, and paste in a link. If you haven't imported a study before, here's how to import into your ThinkOrSwim platform.
Questions
What is the Simple Breakout Tool?
The Simple Breakout Tool is a free ThinkOrSwim indicator that plots one bullish or bearish arrow when a breakout setup is valid. It triggers on a cross of the 10-period simple moving average and confirms it with the 100-period average, slow stochastics set to 21 and 3, and the MACD histogram. If any check fails, no arrow prints.
What does the Simple Breakout Tool need for a bullish signal?
Four things on the same bar. The close crosses above the 10-period SMA after the previous close was at or below it. The close is above the 100-period SMA. Slow stochastic K and D are both below the overbought level of 80. The MACD histogram is above 0. The bearish signal mirrors each check.
What stochastic settings does the Simple Breakout Tool use?
It calls StochasticSlow with 80 and 20 as the overbought and oversold levels and 21 and 3 for the K and D settings. A bullish arrow needs both lines below 80, and a bearish arrow needs both above 20. These values are written into the code, so edit all 4 StochasticSlow lines to change them.
Does the 30-period moving average affect the signals?
No. The download calculates the 30-period SMA from the mediumSMALength input, but neither signal line uses it. The bullish and bearish conditions only check the 10-period average for the cross and the 100-period average for the trend, so changing mediumSMALength won't change any arrows.
How do I use the Simple Breakout Tool with Market Pulse?
Check the Market Pulse stage when an arrow prints. In the video, a bullish signal in acceleration or a bearish signal in deceleration means buying an at-the-money call or put with at least 60 days left. A signal in accumulation or distribution means selling an at-the-money credit spread. A short signal during acceleration gets skipped.
Where should I put the stop on a Simple Breakout signal?
In the video I set it with the V Score. Find the standard deviation line price is closest to at entry, then put the stop outside the next line against the trade. For a long near the 0 line, the stop goes outside -1 and the targets are +1 and +2. The V Score labels give the exact prices.
Is there a scan for the Simple Breakout Tool?
Yes. The download includes a .txt file with 2 ThinkOrSwim shared links, one labeled Bullish and one labeled Bearish. Load a link as a shared item in ThinkOrSwim to add the scan. Members can also follow the separate Simple Breakout Tool Scans tutorial.
How do I change the moving average lengths in the Simple Breakout Tool?
Open the study settings in ThinkOrSwim and change fastSMALength (default 10), mediumSMALength (30) or slowSMALength (100). The fast length sets the crossover trigger and the slow length sets the trend filter. The 30-period length has no effect on the arrows.
Related tools
 Opening Range Breakout
 How to Draw Price Channels
 Smarter Earnings
Get each new indicator by email
One email on Sundays with the week's new tool and its code. A free account also unlocks every .txt download.
No credit card. Unsubscribe anytime.