Table of Contents
Introduction
The Opening Range Breakout setup is one of the more commonly used setups, that traders play nearly every morning.
While the setup is easy to follow, you’ll find that it works well on selective markets.
In this tutorial, I’ll show you how to build your own Opening Range Breakout indicator inside of ThinkOrSwim.

For all Volatility Box members, we have built a separate Opening Range Breakout Backtester.
Volatility Box members only: Click here to download the ORB Backtester code.
This is a full fledged backtester, that allows you to see just how effective the ORB strategy is on any market, and on any time frame.
You can find some examples below, showing off the Opening Range Backtester on a variety of different markets.
Before we start writing any code, let’s first understand when the P/E ratio is best used as a valuation method, and what type of stocks are best suited for it.
Let’s get started!
What is the Opening Range Breakout Strategy?
The Opening Range Breakout (ORB) is a momentum-based trading setup, in which you are waiting for price to break outside of its morning, opening range.
Typically, the “Opening Range” is defined as the time period between 9:30 AM EST – 10:00 AM EST, representing the first 30 minutes of market activity.
During the opening range, draw a line out marking the highest high, and the lowest low, during that period.
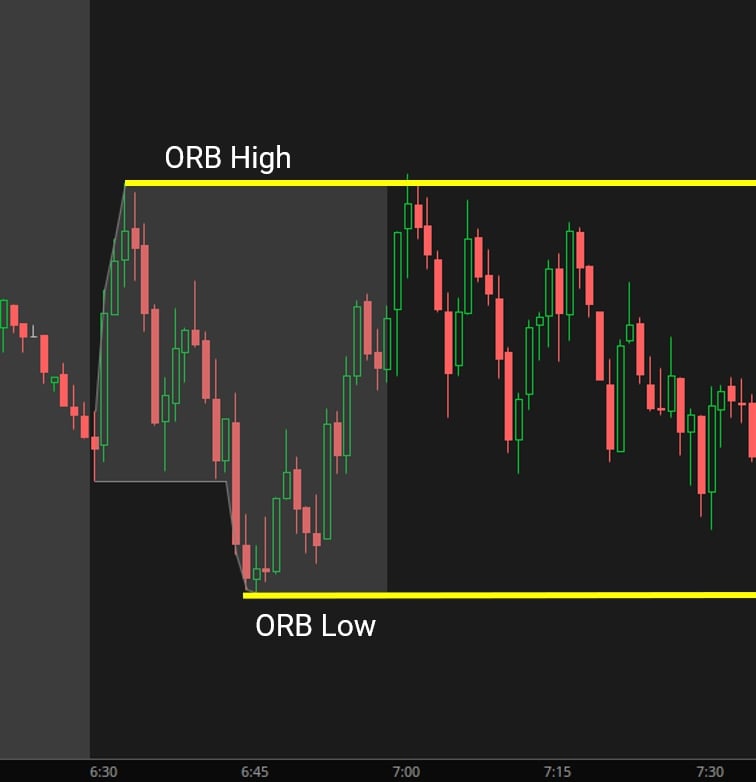
This marks your breakout levels, that price must go outside of, in order to trigger an ‘Opening Range Breakout.’
2 Types of Opening Range Breakouts
For the purposes of our thinkScript tutorial, we can split up the opening range breakout setup into two different kinds of breakouts:
- Wick Touch – This is where we have just a wick (i.e., the high or low) breaking above or below the ORB levels. This is a slightly weaker confirmation, when compared to the second option, in which we have buyers or sellers exhibiting more control.
- Close Above – This is where we have buyers or sellers proving they have control, and we wait for a close above or below the ORB levels. However, the trade-off here is usually worse entry fills, when compared to using stop orders in the first option.
We will need to factor in each one of these two types of breakouts within our thinkScript code.
This will require using a switch thinkScript function, which will allow the user to pick and choose their preferred breakout type, based on their trading style.
Opening Range Breakout Backtester Examples
Backtest the opening range breakout strategy on any stock, ETF or futures market and quickly view P/L, winning vs. losing trades and average ORB range.
With the backtester, you can find the setups that have been performing well, and find any interesting patterns and tendencies, which you can leverage.
Volatility Box members only: Click here to download the ORB Backtester code.
Let’s take a look at a few different examples of the backtester in action!
First example is on a chart of SPY, 1-minute/10-day chart:

This strategy has overwhelmingly been negative inside of the S&P 500 over the past 10 days.
However, if during that same 10-day period, we compare the opening range breakout strategy on a different market… say, something like the Energy Sector ETF (XLE), this is what we see:

Which one of those two markets would you rather be trading the ORB strategy on?
Of course, XLE. It’s the one that has consistently been profitable, and having that kind of information PRIOR to taking the trade can help with filtering, and choosing the best setups.
Let’s take a look at one last example, in a completely different stock. One that isn’t correlated directly to the S&P 500.
Here’s a chart of TEAM (Atlassian Software), and we can see just how effective the ORB strategy has been, thanks to the backtester.
Over the past 10 days, 100% win rate, over 6 trades!
Volatility Box members only: Click here to download the ORB Backtester code.
That’s the power of having a backtester.
You can avoid taking new trades in a market like SPY, and instead, focus on where the setup IS working, in markets like TEAM and XLE.
Opening Range Breakout Indicator for ThinkOrSwim
There are four general steps that I will be following, when building our opening range breakout indicator.
- Step 1: Define Opening Range
- Track high and low during the opening range
- Plot the actual opening range on our ThinkOrSwim charts
- Step 2: Define Range for Valid Trade Entry
- Extrapolate opening range levels
- Step 3: Create Switch Variables for entryType
- Designed to handle the 2 different kinds of opening range breakouts
- Step 4: Plot All Levels
- Opening range high
- Opening range low
- Half range projection, only if ORB setup actually triggers
- Full range projection, only if ORB setup actually triggers
- Half range pullback
Step 1: Define Opening Range
Let’s start with defining the opening range, using a start and end time using thinkScript. Keep in mind, all times in thinkScript are in Eastern Standard Timezone (EST), and this cannot be changed.
input openingRangeStartTimeEST = 930;
input openingRangeEndTimeEST = 1000;
def openingRange = if SecondsTillTime(openingRangeStartTimeEST) = 0 then 1 else 0;
def openingRangeHigh = if SecondsTillTime(openingRangeStartTimeEST) == 0 then high else if openingRange and high > openingRangeHigh[1] then high else openingRangeHigh[1];
def openingRangeLow = if SecondsTillTime(openingRangeStartTimeEST) == 0 then low else if openingRange and low < openingRangeLow[1] then low else openingRangeLow[1];
plot highCloud = if openingRange then openingRangeHigh else double.nan;
plot lowCloud = if openingRange then openingRangeLow else double.nan;
highCloud.setDefaultColor(Color.Gray);
lowCloud.setDefaultColor(Color.Gray);
AddCloud(lowCloud, highCloud, color.gray, color.gray);
Step 2: Define Range for Valid Trade Entry
input tradeEntryStartTimeEST = 1000;
input tradeEntryEndTimeEST = 1100;
def tradeEntryRange = if SecondsTillTime(tradeEntryStartTimeEST) = 0 then 1 else 0;
plot tradeEntryHighExtension = if tradeEntryRange then openingRangeHigh else double.nan;
plot tradeEntryLowExtension = if tradeEntryRange then openingRangeLow else double.nan;
tradeEntryHighExtension.setPaintingStrategy(PaintingStrategy.Horizontal);
tradeEntryLowExtension.setPaintingStrategy(PaintingStrategy.Horizontal);
tradeEntryHighExtension.setStyle(Curve.Short_Dash);
tradeEntryLowExtension.setStyle(Curve.Short_Dash);
tradeEntryHighExtension.setDefaultColor(Color.Gray);
tradeEntryLowExtension.setDefaultColor(Color.Gray);
Step 3: Create Switch Variables for entryType
input entryType = {default wickTouch, closeAbove};
def bullEntryCondition;
def bearEntryCondition;

switch(entryType){
case wickTouch:
    bullEntryCondition = tradeEntryRange and high > openingRangeHigh and high[1] <= openingRangeHigh;
    bearEntryCondition = tradeEntryRange and low = openingRangeLow;
case closeAbove:
    bullEntryCondition = tradeEntryRange and close > openingRangeHigh and close[1] <= openingRangeHigh;
    bearEntryCondition = tradeEntryRange and close = openingRangeLow;
}
def bullishORB = if bullEntryCondition then 1 else if !tradeEntryRange then 0 else bullishORB[1];
def bearishORB = if bearEntryCondition then 1 else if !tradeEntryRange then 0 else bearishORB[1];
Step 4: Plot All Key ORB Levels
def range = openingRangeHigh - OpeningRangeLow;
def halfRange = range / 2;
def midRange = openingRangeLow + halfRange;

plot midRangePlot = if tradeEntryRange then midRange else double.nan;
midRangePlot.setPaintingStrategy(PaintingStrategy.Horizontal);
midRangePlot.setStyle(Curve.Short_Dash);
midRangePlot.setDefaultColor(Color.Gray);

def halfwayUpsideProjection = openingRangehigh + halfRange;
plot halfwayUpsideProjectionPlot = if bullishORB and tradeEntryRange then halfwayUpsideProjection else double.nan;
halfwayUpsideProjectionPlot.setPaintingStrategy(PaintingStrategy.Horizontal);
halfwayUpsideProjectionPlot.setDefaultColor(Color.Light_Green);

def fullUpsideProjection = openingRangehigh + range;
plot fullUpsideProjectionPlot = if bullishORB and tradeEntryRange then fullUpsideProjection else double.nan;
fullUpsideProjectionPlot.setPaintingStrategy(PaintingStrategy.Horizontal);
fullUpsideProjectionPlot.setDefaultColor(Color.Green);

def halfwayDownsideProjection = openingRangelow - halfRange;
plot halfwayDownsideProjectionPlot = if bearishORB and tradeEntryRange then halfwayDownsideProjection else double.nan;
halfwayDownsideProjectionPlot.setPaintingStrategy(PaintingStrategy.Horizontal);
halfwayDownsideProjectionPlot.setDefaultColor(Color.Light_Red);

def fullDownsideProjection = openingRangelow - range;
plot fullDownsideProjectionPlot = if bearishORB and tradeEntryRange then fullDownsideProjection else double.nan;
fullDownsideProjectionPlot.setPaintingStrategy(PaintingStrategy.Horizontal);
fullDownsideProjectionPlot.setDefaultColor(Color.Red);
Conclusion
I hope you found this thinkScript tutorial to be useful.
If you followed the video portion, over 36 minutes, we built a powerful ORB indicator for ThinkOrSwim, that adapts with user conditions.
Some of the bells and whistles that we added include:
- User can control Opening Range start and end time
- User can choose one of two breakout setups
- Automatically project half range and full range ORB projections
- And finally, ability to control the Trade Entry start and end time
Volatility Box members only: Click here to download the ORB Backtester code.
If you have any questions, feel free to reach out to us here.
Happy trading!
ORB Indicator.ts
# Opening Range Breakout for ThinkOrSwim

# Generated by TOS Indicators

# Full tutorial: tosindicators.com/indicators/opening-range-breakout

# User Inputs

input length = 14;


// ... 23 more lines ...Edit input fields in study settings - change 'Opening Range Start/End Time' values. Supports any 24-hour format including pre-market hours. No code modification required.
Yes - use 'Add Alert' feature on plotted half-range levels. Volatility Box members get automated alerts through the premium backtester.
Wick triggers on candle shadows (earlier signals), close triggers require full candle body beyond OR levels (higher confirmation). Test both on SPY charts to compare.
Volatility Box members access built-in backtester - tracks historical 50% win rates. Non-members can manually test via replay mode with date selection.
Yes - set custom times like 4:00-4:30 AM ET for ES_F futures. Combine with volume filters to avoid low-liquidity false breakouts.
ThinkOrSwim does not have a built-in Opening Range Breakout indicator, but you can create one using the Studies > Create function with custom ThinkScript code. Many traders share free ORB indicators in ThinkOrSwim communities, or you can build your own using the comprehensive code examples and tutorials available online.
For ThinkOrSwim ORB indicators, I like to focus on 2-minute charts for 15 and 30 minute ORB ranges (for most stocks). For the 5-minute ORB range, I like to use the 1-minute time frame chart.
Yes, you can backtest ORB strategies in ThinkOrSwim using our Opening Range Breakout Backtester, which will help you analyze the strategy's performance. You can also backtest the ORB trading strategy directly inside of our Opening Range Breakout platform, www.orbsetups.com/backtester.
Here are some resources that you may find useful: