Aggregation Periods – How to Plot Larger Time Frame Indicators on Smaller Time Frames
In this thinkScript tutorial, I’ll show you how to use Aggregation Periods in ThinkOrSwim to plot a daily time frame indicator on an intraday time frame chart.
For example, if you wanted to plot the 50 DAY simple moving average (SMA) on a 5 MINUTE chart, you can do so. This allows you to use key, larger timeframe levels, to play play reactions to and from some of these key levels.
Let me show you an example of why this is useful.
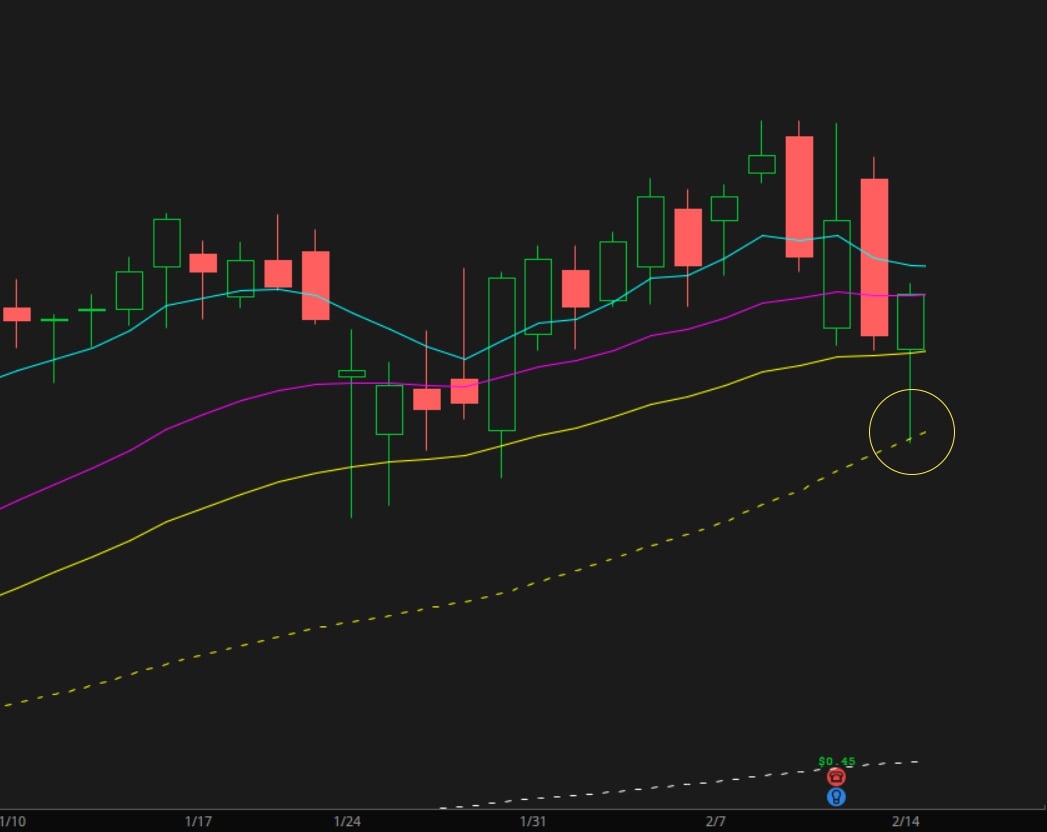
Here’s a recent chart of Coke (KO), and we can see we have stacked moving averages across the board:

Notice that wick touch to the 50-day SMA line, almost down to the penny.
Can we see moments like this setting up intra-day, and be able to play reactions to and from these key levels? Absolutely.
For that to happen, we need to be able to see these levels on an intraday timeframe chart. This means getting rid of the need to go back and forth between a daily and a 5-minute timeframe chart (for this example).
Let’s get started with writing some code.
What Are Aggregation Periods in ThinkOrSwim?
Before we start, it’s important to understand what an aggregation period is, as this will be critical in being able to reference future indicators.
In ThinkOrSwim, an aggregation period is the time frame that you’d like to use, for a particular market’s price or volume. This includes open, high, low, and close prices, as part of the values transmitted.
Some of the more commonly used aggregation periods are:
- 5-minutes
- 15-minutes
- 30-minutes
- 1-hour
- daily
- weekly
You can find a full list of Aggregation Periods on the thinkScript documentation page here.
For additional examples of aggregation period use cases, check out our “Multi-Time Frame” tutorials:
- MTF DMI (Free)
- MTF Squeeze (Free)
- MTF Triple Squeeze (Free for VB Members)
- MTF Squeeze Histogram (Free for VB Members)
If you are not already a Volatility Box member, here is a link to learn more about our 2 different memberships.
Now that you’ve understood more about aggregation periods, let’s move on to writing some custom code for the 50-day SMA.
Aggregation Period thinkScript Example
Let’s take a look at the code needed to plot the 50-period SMA on a 5-minute chart:
plot SMA50 = SimpleMovingAvg(close, 50);
Now, if we wanted to tell the code to use the 50-period SMA, but this time, using the daily time frame candle, then we can use the aggregation period parameter for price.
plot SMA50 = SimpleMovingAvg(close (period = AggregationPeriod.Day), 50);
If we plot the two side by side, on the same chart, here’s what we see:
The yellow line is the 50 SMA using 5-minute candles, and the cyan line is the 50 SMA using daily candles.
As we can see, it’s the same indicator, but now we’re using the daily timeframe to calculate the SMA values.
ATR Aggregation Period thinkScript Example
Let’s take a look at how we can use the aggregation period parameter for another study, ATR.
To be able to control the price element, we need the ATR source code:
input length = 14;
input averageType = AverageType.WILDERS;
plot ATR = MovingAverage(averageType, TrueRange(high, close, low), length);
We need to link each of the high, close, and low prices to the daily aggregation period, instead of the current default chart.
Here’s how we can do that:
input length = 14;
input averageType = AverageType.WILDERS;
plot ATR = MovingAverage(averageType, TrueRange(high (period=AggregationPeriod.Day), close(period=AggregationPeriod.Day), low(period=AggregationPeriod.Day)), length);
And let’s plot out that value using our AddLabel function:
AddLabel(yes, ATR, color.yellow);
Combined, we have the full code:
input length = 14;
input averageType = AverageType.WILDERS;
plot ATR = MovingAverage(averageType, TrueRange(high (period=AggregationPeriod.Day), close(period=AggregationPeriod.Day), low(period=AggregationPeriod.Day)), length);
AddLabel(yes, ATR, color.yellow);
Here’s what that looks like on the chart:

ATR using daily candles (cyan line), with the 14-period ATR length (yellow label).
As we can see, we now have the ability to reference other timeframes, without needing to flip back and forth between different charts.
Conclusion
In this thinkScript tutorial, we learned how to use the aggregation period when creating and referencing ThinkOrSwim indicators.
We practiced this on two different indicators:
It’s important to understand what an aggregation period is, as this will be critical in being able to reference future indicators.
In ThinkOrSwimYou should now have a better understanding of how to control the time frame element when creating custom code for your indicators.
Remember, the aggregation period will be critical in being able to reference future indicators.
As always, if you have any questions, please feel free to reach out to us.
