
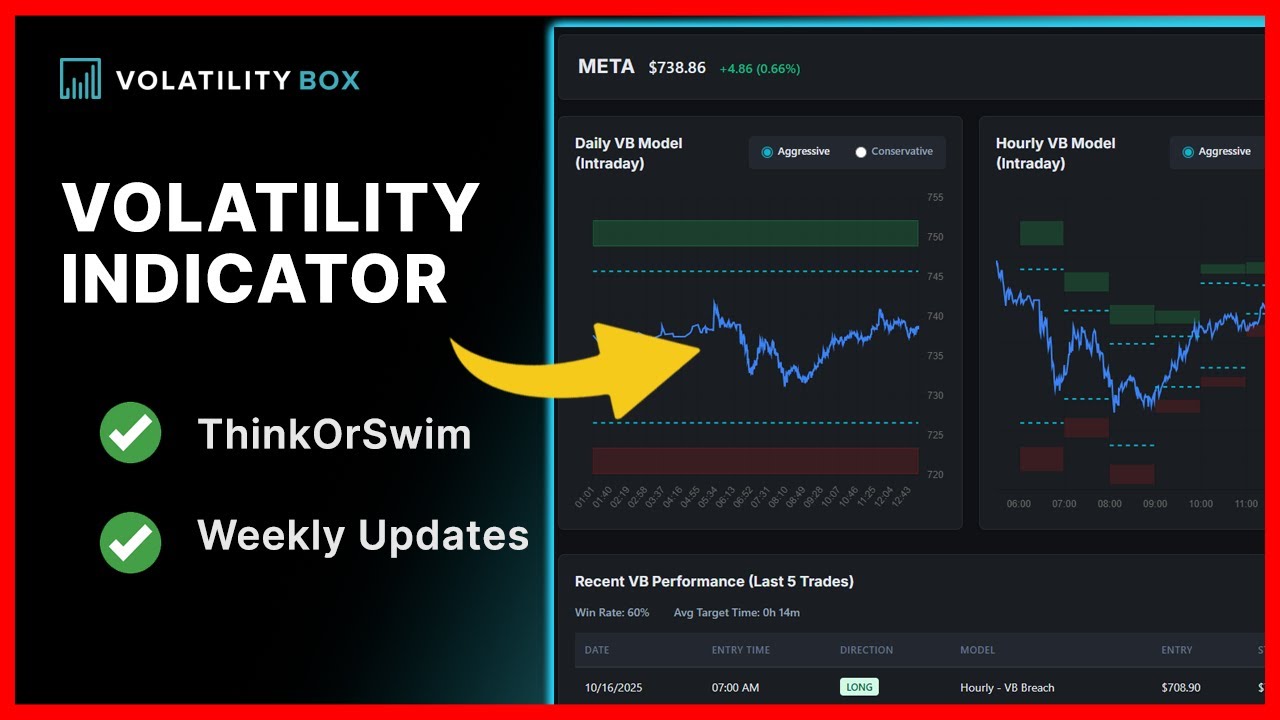
Volatility Trading for ThinkOrSwim
Trade with precision using dynamic volatility levels. Our proprietary models analyze 34,000+ data points weekly to give you institutional-grade support and resistance for 600+ stocks, ETFs, and futures.
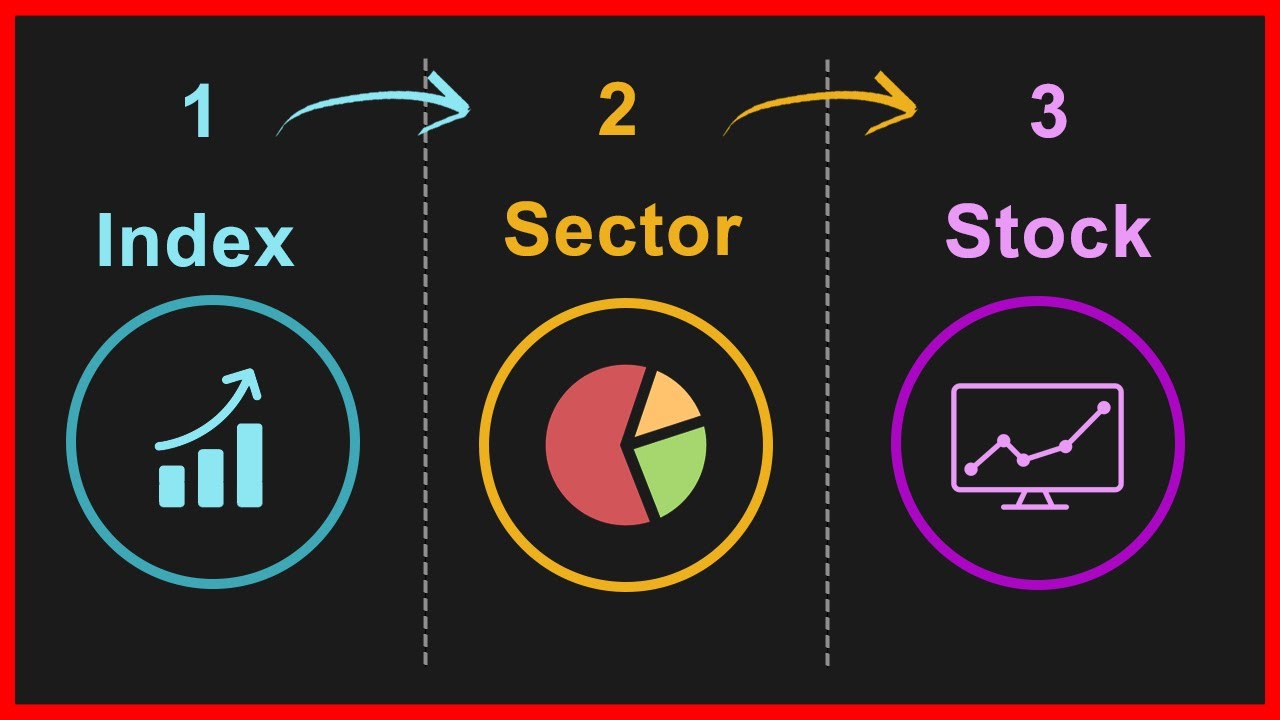
What is Volatility Trading?
Volatility trading uses statistical analysis of price movement to identify where price is likely to find support or resistance. Instead of guessing market direction, volatility models calculate expected price ranges based on historical data — giving you a quantitative edge.
How Volatility Models Work
Volatility models analyze how much price typically moves within a given timeframe. By understanding these patterns, you can:
- Identify high-probability support/resistance — Know where price is statistically likely to stall or reverse
- Set better entries and exits — Use volatility levels as precise targets rather than arbitrary numbers
- Manage risk more effectively — Understand the expected range to size positions appropriately
- Adapt to changing conditions — Models update as market volatility expands or contracts
Key Volatility Concepts
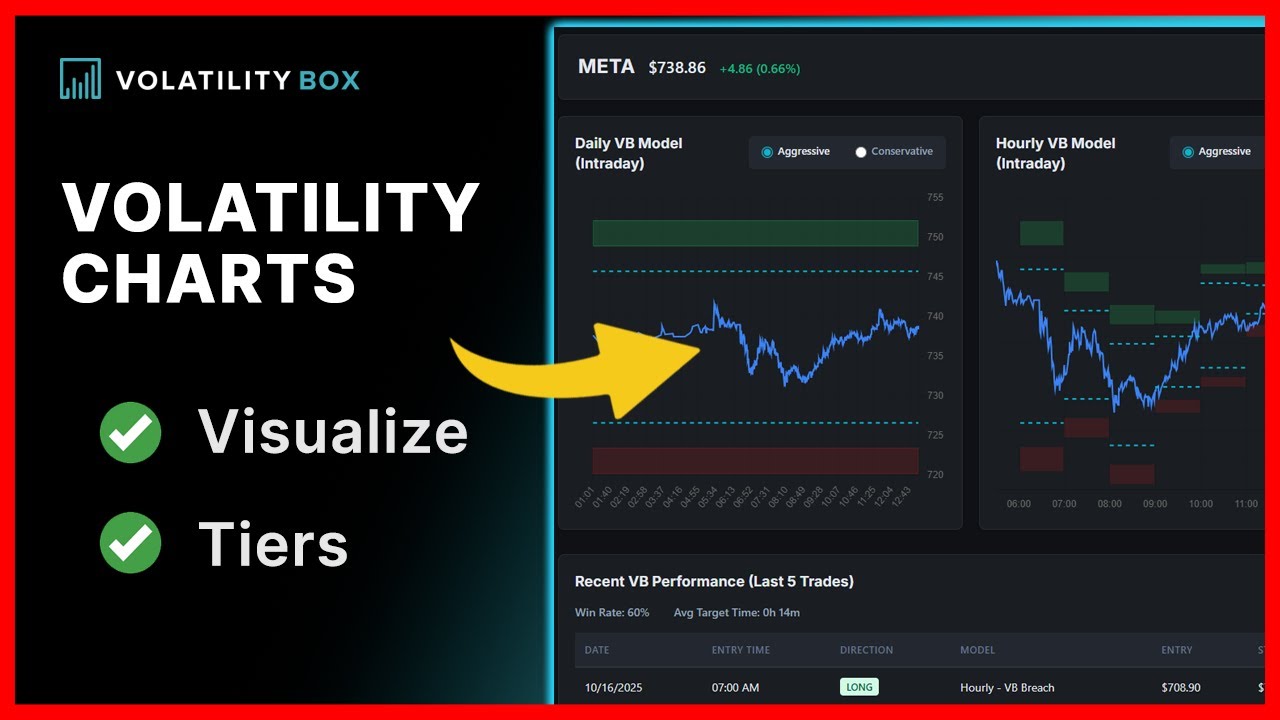
- Daily Models — Calculate expected high/low range for the entire trading day
- Hourly Models — Provide granular intraday levels that update throughout the session
- Volatility Expansion — When ranges widen, expect larger moves and adjust targets
- Volatility Contraction — Tight ranges often precede breakouts (squeeze conditions)
- Mean Reversion — Price tends to return to average levels after extreme moves
Volatility Trading Tutorials
Master volatility analysis with this step-by-step video series covering fundamentals through advanced strategies.
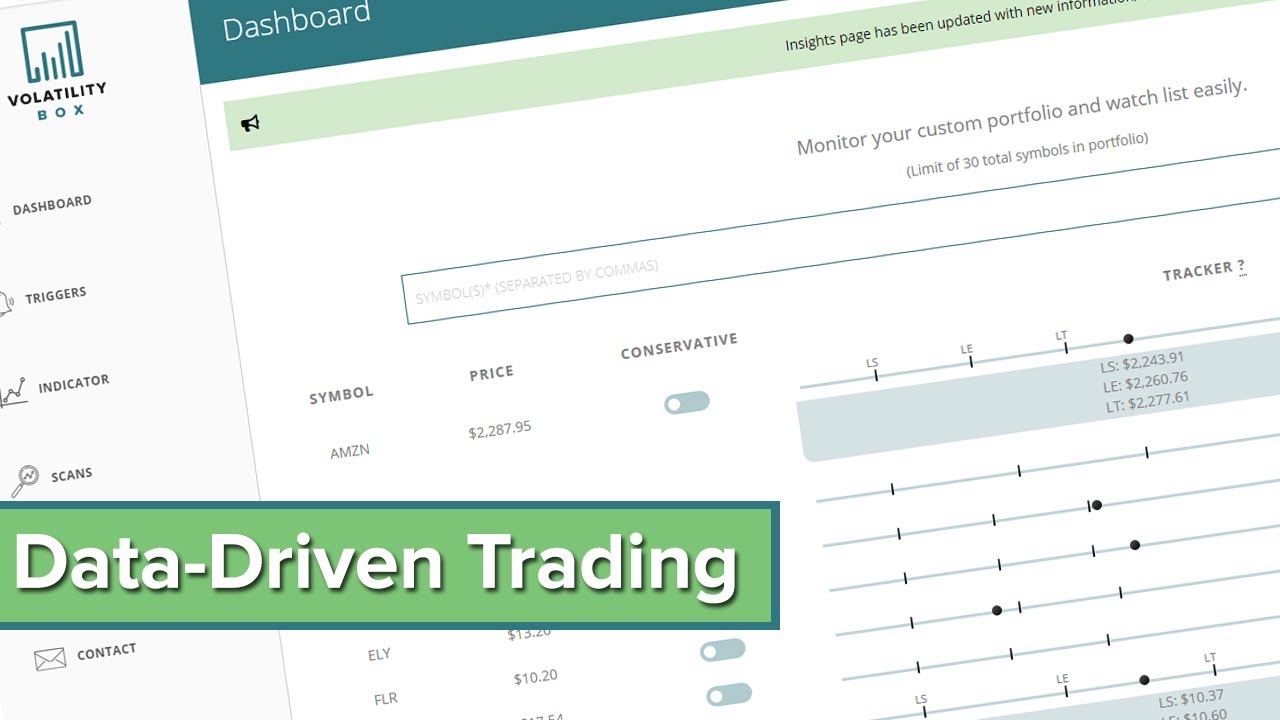
The Volatility Box
Dynamic support and resistance levels based on proprietary volatility analysis of 34,000+ weekly data points.
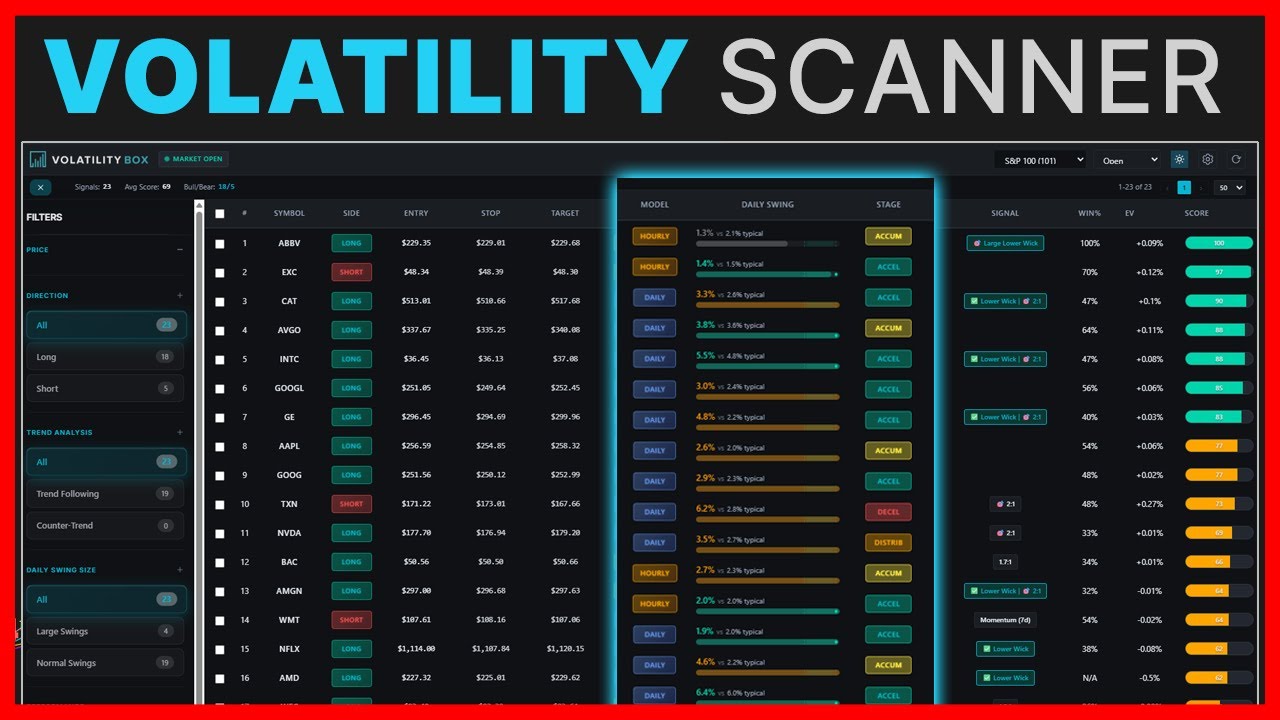
Stock Volatility Box
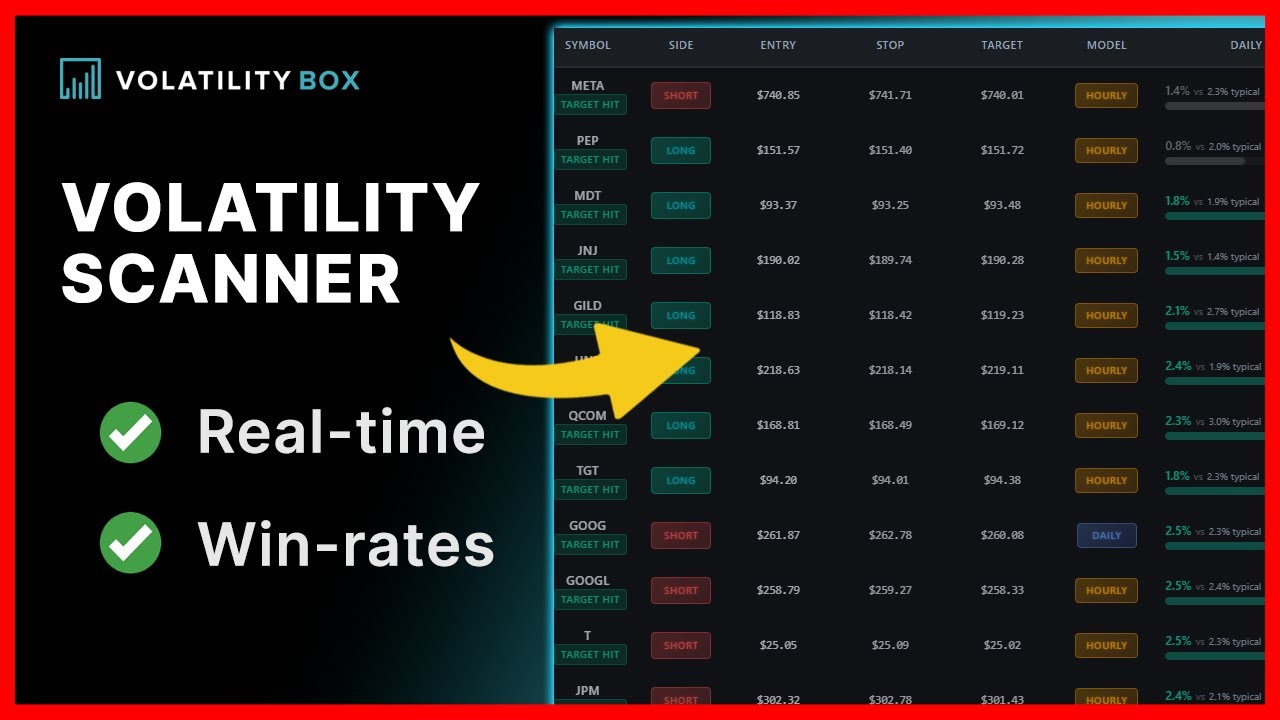
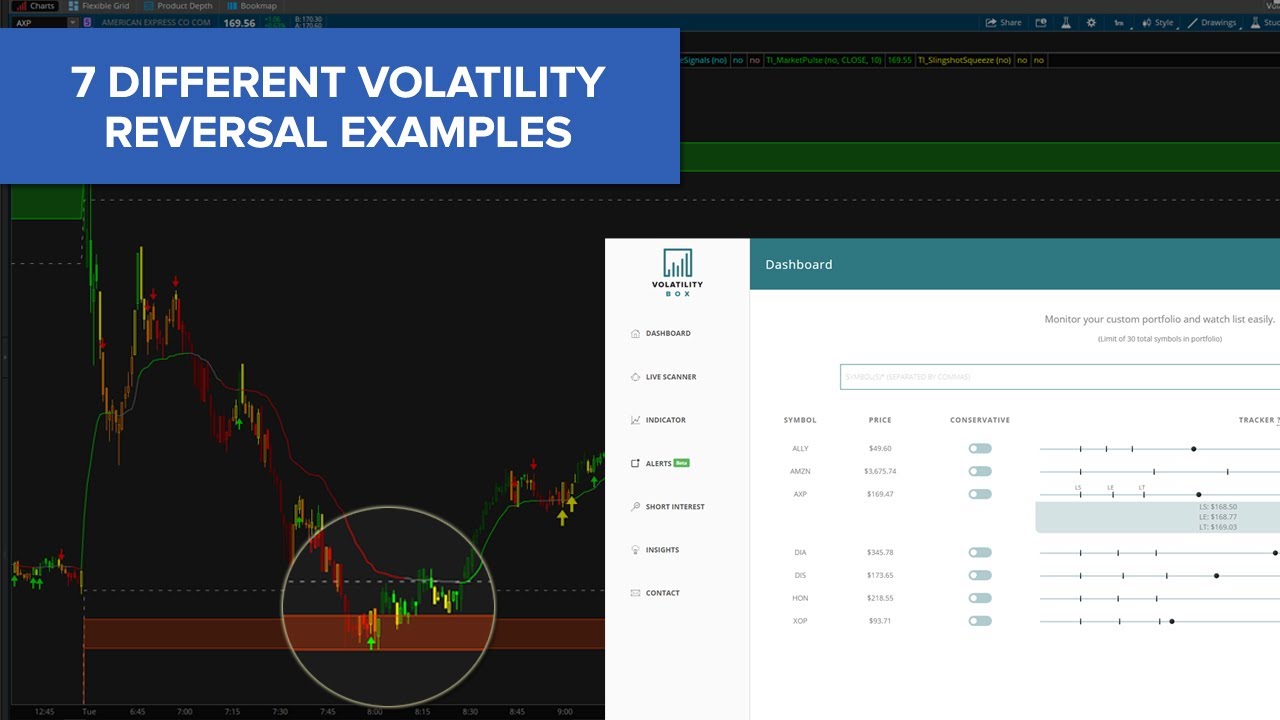
Dynamic support and resistance for 595+ stocks and ETFs, with a live scanner to find the best setups.
- 595+ stocks and ETFs covered
- Daily and hourly volatility models
- Live scanner for real-time setups
- Weekly model updates
- Squeeze Course included (19 modules)
Futures Volatility Box
Precision volatility models for 10 major futures markets including indices, metals, and energies.
- ES, NQ, YM, RTY (indices)
- GC, SI (gold, silver)
- CL, NG (crude oil, natural gas)
- ZB, 6E (bonds, euro)
- Squeeze Course included (19 modules)
Volatility Box Trade Examples


Month-to-month membership. Cancel anytime.
What Traders Are Saying
Real results from Volatility Box members
Had my first ever $1200 day today using the vbox. The trades were in the /NQ. Keep up the good work over there!
Thank you so much for this tool. I used it to short FCX this morning and made enough profits to pay for this subscription for 12 months as well as paid my mortgage for 2 months!
I had 3 trades setup using the VB: AMAT - 20% profits, NVDA - Rinse and repeat 3 times for 10-15% gain each time, RH - This was a big winner.
The VB indicator, along with the other indicators provided by the team, has significantly enhanced my trading experience. The accuracy and user-friendly interfaces have allowed me to make informed decisions.
Love the VB... Making good money! I took a YM trade for $155 with the indicator and paid for my first month's subscription.
I have successfully traded two setups in two days on the VBOX, so I am happy. Only doing 1 contract on the MES/YM/NQ for now in tryout mode.
I spent the last few days evaluating the mechanics of the Volatility Box and I liked it, it has already paid itself for the next month.
I love love love the VB coding tutorials. Your "explain it like I am 5 years old" is awesome! I struggled mightily with coding before, but some of what I learned has come flooding back.
Volatility Trading Strategies
Learn advanced techniques for finding and trading high-probability volatility setups.


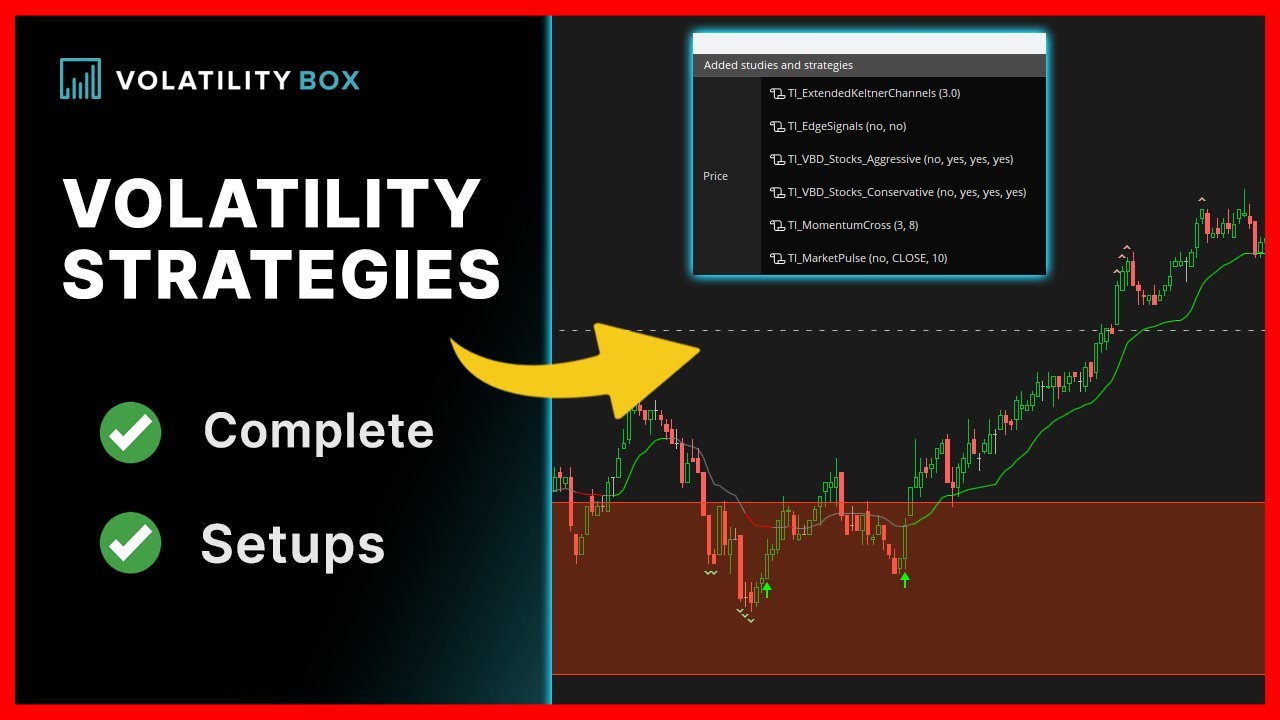
Free Volatility Indicators
Enhance your volatility trading with these free ThinkOrSwim indicators. Combine them with Volatility Box levels for higher-probability setups.
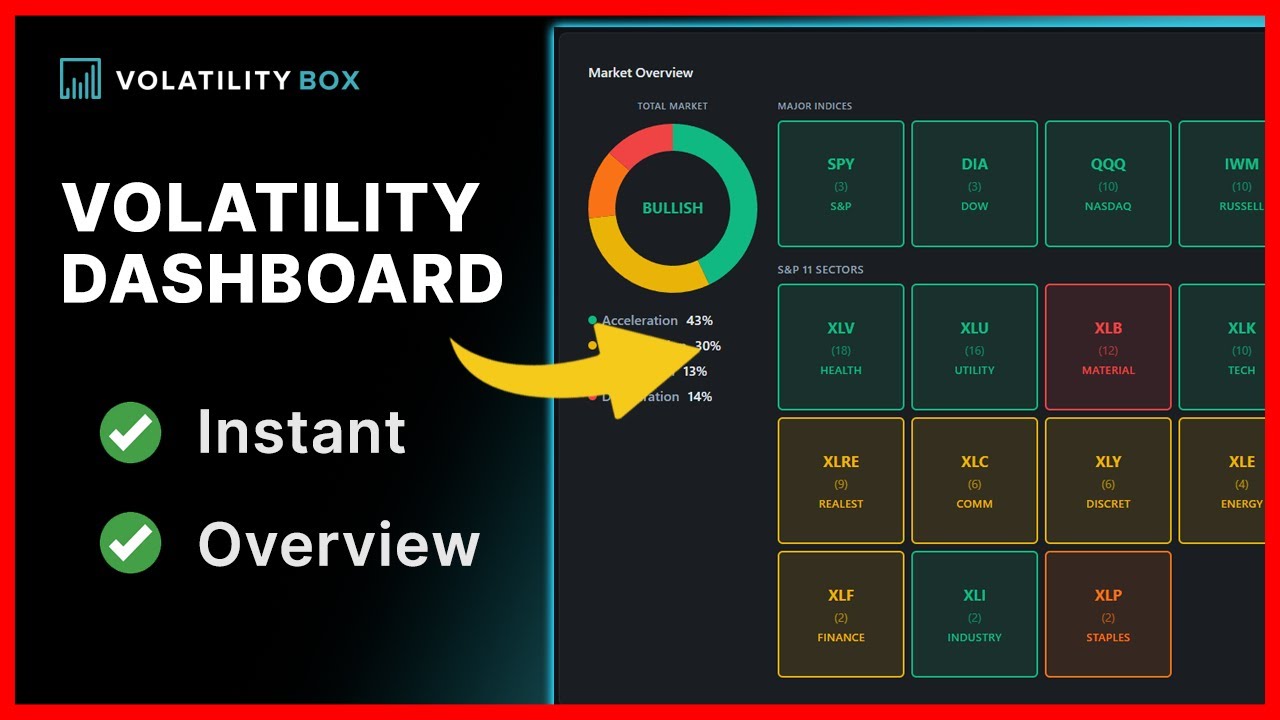
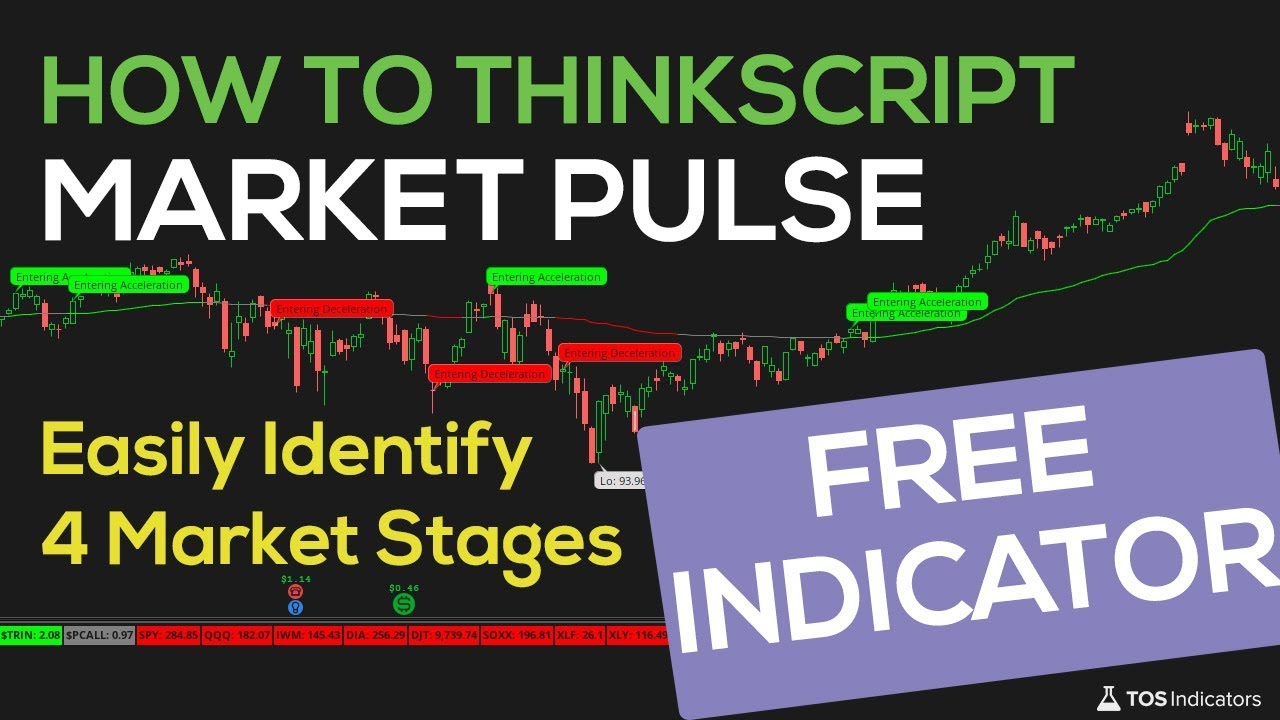
Market Pulse
Identifies four market stages (acceleration, distribution, deceleration, accumulation) using volume-weighted moving averages.
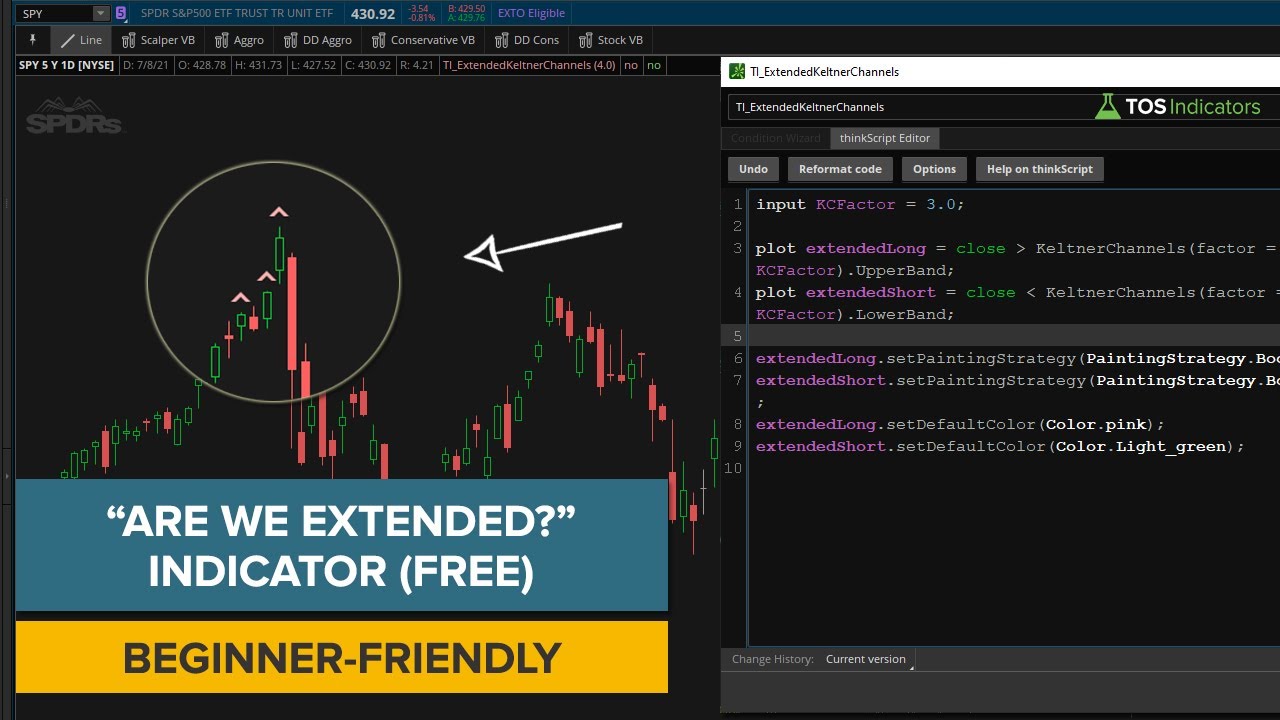
Download Free →Keltner Channel Wedges
Spots mean-reversion opportunities when price extends beyond Keltner Channel bands.
Download Free →Edge Signals
Identifies oversold and overbought conditions for potential reversal entries.
Download Free →Indicator Tutorial Videos


Frequently Asked Questions
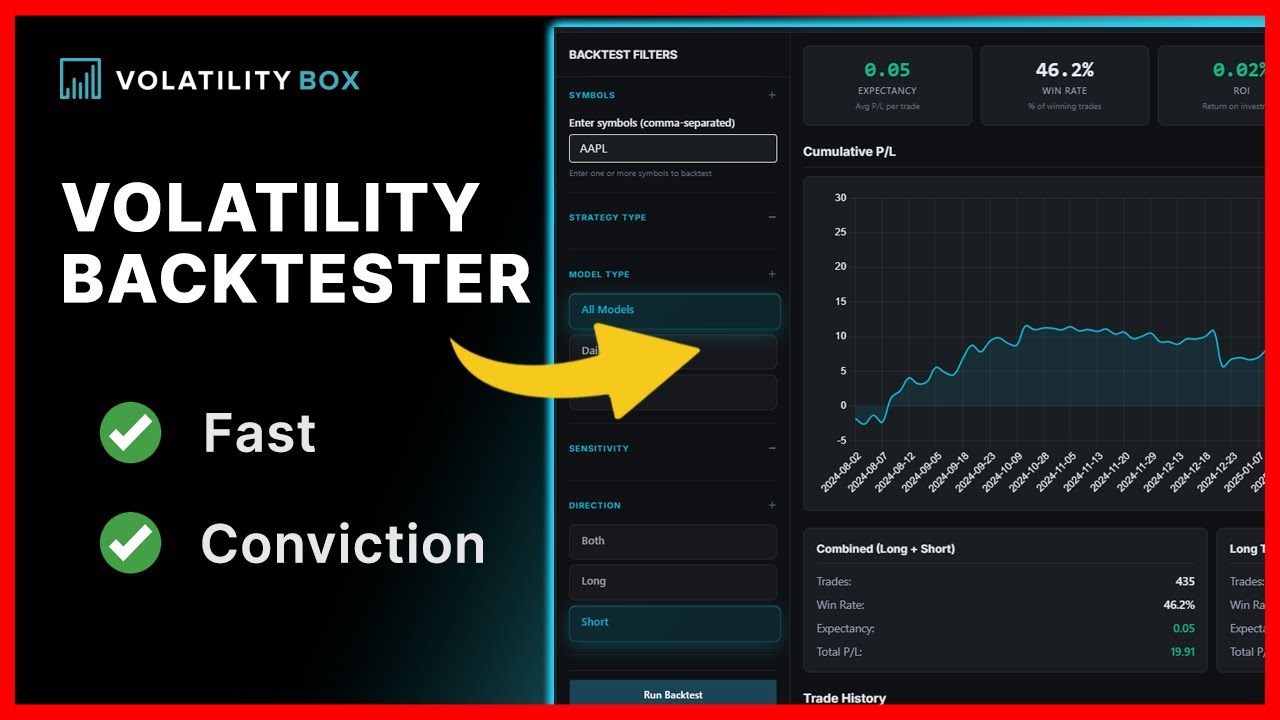
Volatility trading uses statistical measures of price movement to identify support/resistance levels and predict potential price ranges. Instead of guessing where price will go, volatility models show you WHERE price is likely to find support or resistance based on historical volatility patterns.
The Volatility Box is a proprietary volatility framework that generates dynamic support and resistance levels based on 34,000+ weekly data points. It provides daily and hourly volatility models for stocks, ETFs, and futures markets, helping traders identify high-probability entry and exit points.
The Stock Volatility Box covers 595+ stocks and ETFs with a live scanner. The Futures Volatility Box covers 10 major futures markets including ES, NQ, YM, RTY (indices), GC, SI (metals), CL, NG (energy), ZB (bonds), and 6E (currencies).
Daily models calculate expected price ranges for the entire trading day based on historical volatility. Hourly models provide more granular intraday levels that update throughout the session. Both help you identify where price is likely to find support or resistance.
Market Pulse is a free ThinkOrSwim indicator that identifies four market stages: acceleration, distribution, deceleration, and accumulation. It uses volume-weighted moving averages to help you adapt your strategy to current market conditions.
The most effective approach combines Volatility Box levels with momentum indicators like Market Pulse, Edge Signals, or Keltner Channel Wedges. When price reaches a volatility level AND shows a momentum signal, you have a higher-probability setup.
Volatility models work for both. Day traders use hourly models for intraday entries and exits. Swing traders use daily models to identify multi-day support/resistance zones. The Volatility Box provides both timeframes.
Stock Volatility Box covers 595+ equities and ETFs with a live scanner to find setups. Futures Volatility Box covers 10 futures markets with models optimized for each contract's unique volatility characteristics. Many traders use both.
Start Trading Volatility Levels
Get institutional-grade volatility models for stocks, ETFs, and futures.