Table of Contents
Introduction
The TTM Squeeze indicator is a popular tool among traders who started their careers in the 21st century, and ever came across John Carter. The TTM Squeeze indicator combines the Keltner Channels and Bollinger Bands to provide insight into market volatility, showing when it is compressing and when it is about to expand.
Within the TTM Squeeze, there are two main components that traders use:
- Squeeze Dots
- Squeeze Histogram
This tutorial focuses on the TTM Squeeze Histogram, answering a key question:
How effective is the TTM Squeeze Histogram in timing momentum shifts in the market?
The TTM Squeeze Histogram is considered a leading momentum indicator. In this tutorial, we’ll build a backtester to test that theory.
How to Read the TTM Squeeze Histogram?
The TTM Squeeze Histogram is used to gauge momentum, with the histogram bars providing clues about the market’s movements.
Here’s how to read the TTM Squeeze Histogram:
There are four different colors in the histogram bars:
- Cyan
- Blue
- Yellow
- Red
Each color is based on its relationship with the prior bar and the zero line, offering visual cues on whether momentum is increasing or decreasing.
Cyan Squeeze Histogram:
A cyan TTM squeeze histogram appears when:
- The bar is increasing compared to the prior bar,
- And is greater than 0.
Blue Squeeze Histogram:
A blue TTM squeeze histogram appears when:
- The bar is decreasing compared to the prior bar,
- And is greater than 0.
Red Squeeze Histogram:
A red TTM squeeze histogram appears when:
- The bar is decreasing compared to the prior bar,
- And is less than 0.
Yellow Squeeze Histogram:
A yellow TTM squeeze histogram appears when:
- The bar is increasing compared to the prior bar,
- And is less than 0.
Histogram Patterns and Momentum Clues
Understanding these colors helps in identifying momentum patterns:
- Cyan bars increasing in height, in consecutive order = increasing buying momentum
- Red bars increasing in height, in consecutive order = increasing selling momentum
- 7+ consecutive cyan bars, followed by the first blue bar = slowing buying momentum, potential reversal
- 7+ consecutive red bars, followed by the first yellow bar = slowing selling momentum, potential reversal
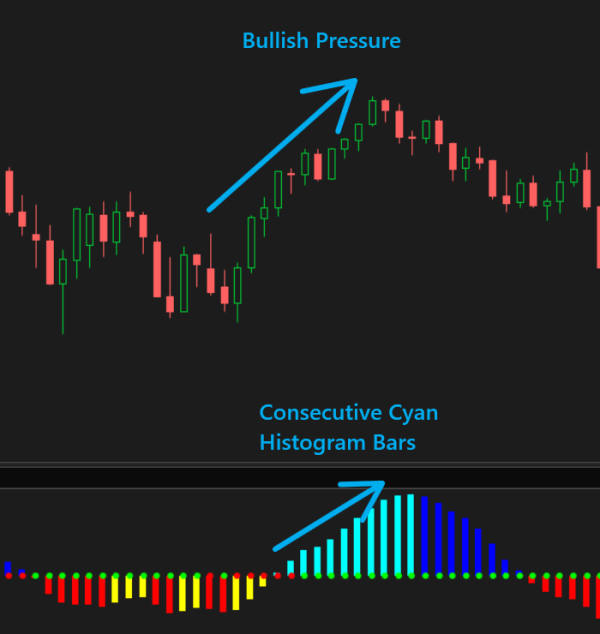
For example, consecutive cyan bars indicate increasing momentum, often leading to upward price action supported by bullish activity.
Conversely, consecutive red bars signal increasing bearish momentum, putting downward pressure on price action.
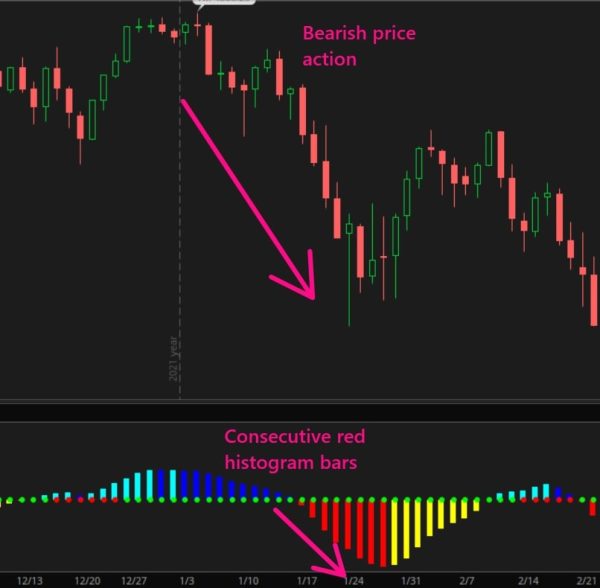
The first bar of a different color after a series of the same color can indicate a momentum shift. For instance, consecutive cyan bars followed by a blue bar suggest slowing upward momentum and possible reversal. Similarly, consecutive red bars followed by a yellow bar indicate slowing downward momentum and potential reversal. Combining this with other indicators can help identify entry points.
Getting Started with thinkScript
To start, open ThinkOrSwim and follow these steps to create a new thinkScript strategy:
- Click the Studies icon at the top right of your chart.
- Go to the Strategies tab.
- Click Create to open the thinkScript editor.
- Name your strategy (e.g., “TTM Squeeze Histogram Backtester”).
Referencing the TTM Squeeze Histogram
First, we need to reference the TTM Squeeze study and extract the histogram data:
def histogram = TTM_Squeeze().Histogram;This line imports the histogram plot from the TTM Squeeze indicator, essential for identifying momentum shifts.
Defining Histogram Bar Colors
Next, categorize the histogram bars into four colors:
    def cyan = histogram > histogram[1] and histogram > 0;

    def blue = histogram  0;

    def red = histogram < histogram[1] and histogram < 0;

    def yellow = histogram > histogram[1] and histogram < 0;
These definitions help distinguish between increasing and decreasing momentum in both positive and negative territories.
Identifying Momentum Shifts
Define conditions for momentum shifts based on consecutive histogram bars of the same color:
    def minCyanBars = Sum(cyan, 7) >= 7;

    def minRedBars = Sum(red, 7) >= 7;

    def momoDown = minCyanBars[1] and blue;

    def momoUp = minRedBars[1] and yellow;
These conditions check for seven consecutive bars of the same color, indicating a significant momentum shift.
Filtering with RSI
Incorporate the RSI indicator to filter out false signals and identify overbought and oversold conditions:
    def rsi = RSI();

    def rsiOverbought = rsi > 60;

    def rsiOversold = rsi < 40;
Adding these filters refines entries and exits based on momentum shifts confirmed by the RSI.
Building the Backtester
Construct the backtester by specifying conditions for entering and exiting trades:
    AddOrder(OrderType.BUY_TO_OPEN, momoUp and rsiOversold, close, 100, Color.GREEN, Color.GREEN);

    AddOrder(OrderType.SELL_TO_CLOSE, histogram < histogram[1], close, 100, Color.RED, Color.RED);

    AddOrder(OrderType.SELL_TO_OPEN, momoDown and rsiOverbought, close, 100, Color.RED, Color.RED);

    AddOrder(OrderType.BUY_TO_CLOSE, histogram > histogram[1], close, 100, Color.GREEN, Color.GREEN);
These lines define the trading strategy for long and short positions, using momentum shifts and RSI filters for decisions.
Testing and Refining
Test the backtester across different time frames and market conditions to identify strengths and weaknesses:
    input length = 14;

    input overBought = 70;

    input overSold = 30;

    def rsi = RSI(length, overBought, overSold);

    AddOrder(OrderType.BUY_TO_OPEN, momoUp and rsi < overSold, close, 100, Color.GREEN, Color.GREEN);

    AddOrder(OrderType.SELL_TO_CLOSE, histogram < histogram[1], close, 100, Color.RED, Color.RED);

    AddOrder(OrderType.SELL_TO_OPEN, momoDown and rsi > overBought, close, 100, Color.RED, Color.RED);

    AddOrder(OrderType.BUY_TO_CLOSE, histogram > histogram[1], close, 100, Color.GREEN, Color.GREEN);
Experiment with different RSI thresholds, consecutive histogram bars, and other parameters to optimize the backtester.
Conclusion
Building a TTM Squeeze Histogram Backtester in ThinkOrSwim allows you to test the TTM Squeeze Histogram's effectiveness in identifying momentum shifts. By incorporating the RSI indicator, you can filter out false signals and improve your trading strategy's accuracy.
Continuously test and refine your backtester to adapt to changing market conditions. The insights gained from this tool can significantly enhance your trading decisions and help you capitalize on market momentum.
Happy trading!