
Table of Contents
Module 1
How to Trade Earnings
A deep-dive on how to trade earnings with options for Pre-Earnings, Post-Earnings, and Day of Earnings strategies.
Earnings season gives traders four, consistent times to expect an increase in volatility every year. You can profit from this volatility, if you know how to trade earnings with options, and which strategies to use when.
In this guide, I’ll share three key strategies for trading earnings, leveraging ThinkOrSwim earnings indicators to identify profitable trades and make informed decisions.
Key Tools for Trading Earnings in ThinkOrSwim
We have built three different ThinkOrSwim earnings indicators, along with one ThinkOrSwim earnings scan, specifically designed to help you trade earnings like a professional.
These tools help you analyze market movements and volatility before, during, and after earnings reports.
Here are the four main tools:
1. Smarter Earnings Indicator
The Smarter Earnings Indicator helps you trade on the actual earnings date by analyzing market volatility once the earnings data is released. This tool provides insights into potential market movements.
2. Pre-Earnings Analysis Indicator
This tool analyzes price and volatility patterns as earnings announcements approach. It helps you prepare strategies up to 14 days before earnings, allowing you to take advantage of trends before the earnings report is released.
3. Post-Earnings Analysis Indicator
Used after earnings reports are released, this tool analyzes price and volatility patterns in the days following earnings. It helps you understand market reactions and plan your trades based on typical post-earnings behavior.
4. Upcoming Earnings Scan
The Upcoming Earnings Scan identifies stocks with upcoming earnings reports, allowing you to find stocks reporting within a specific timeframe. This helps you plan your pre-earnings strategies effectively.
Strategy 1: Pre-Earnings Trading
Pre-earnings trading involves strategizing up to 14 days before an earnings announcement. This approach allows you to position yourself to take advantage of price movements and volatility trends before the earnings report is released.
Analyzing Price and Volatility Trends
Start by analyzing historical data to see how the stock typically behaves as earnings approach. Does the price tend to rise or fall? Does volatility increase or decrease? Understanding these patterns helps inform your trading decisions.
Identifying Patterns
Identify patterns in price and volatility trends. For instance, a stock might consistently rise seven days before earnings. Recognizing these patterns allows you to develop strategies that capitalize on these trends.
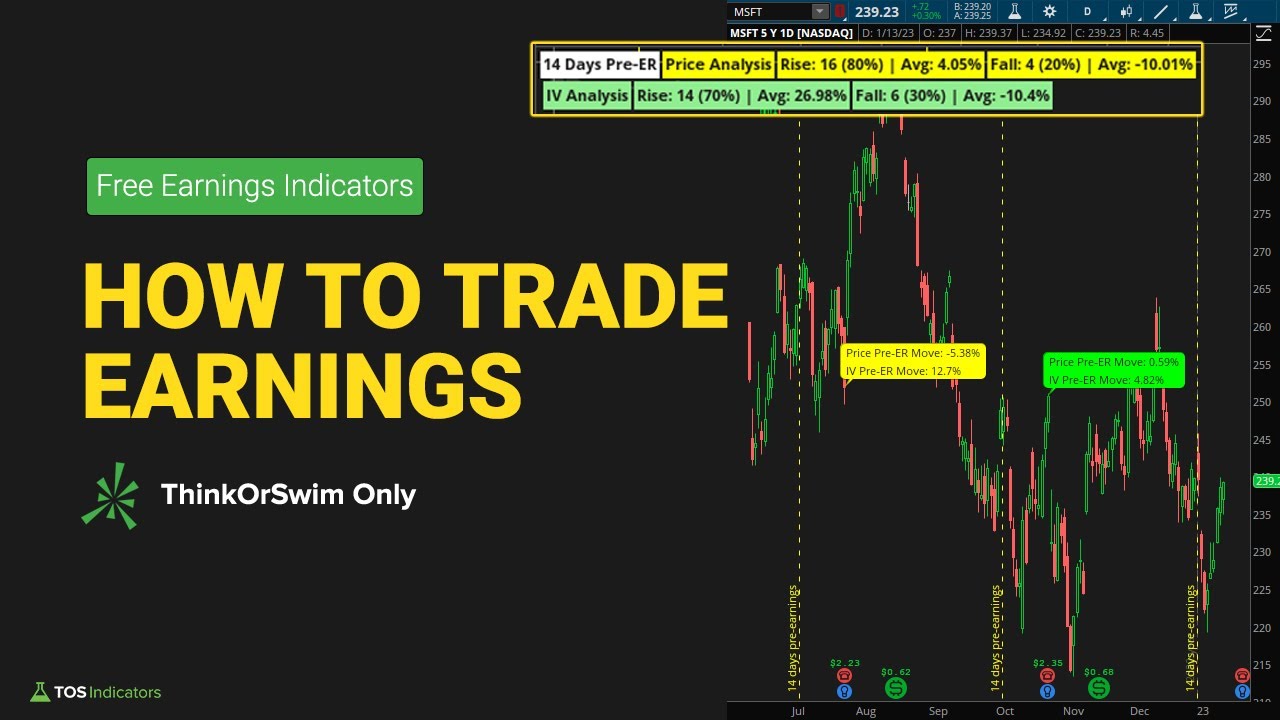
Example: Microsoft
Using the Pre-Earnings Analysis Indicator for Microsoft, we observed that the stock tends to rise 80% of the time as earnings approach, with an average increase of 4%. This suggests a strategy of going long on Microsoft seven days before its earnings announcement.
Detailed Analysis
Breaking down the pre-earnings trading strategy for Microsoft:
- 14 Days Before Earnings: Historical data shows that Microsoft tends to rise 70% of the time, with an average increase of 3%. This indicates a positive trend as the earnings date approaches.
- 7 Days Before Earnings: The stock rises 80% of the time with an average increase of 4%. This increase in probability and average price movement suggests a strong bullish trend as earnings get closer.
By analyzing these trends, you can develop a strategy that takes advantage of the stock’s tendency to rise before earnings.
Strategy 2: Trading the Day of Earnings
Trading on the actual day of earnings involves reacting to the immediate market response to the earnings report. This strategy requires quick decision-making and a good understanding of market reactions.
Gap Fill Strategy
The Gap Fill Strategy involves trading based on the assumption that the initial gap created by the earnings report will fill. For example, if a stock gaps down but had a positive earnings report, you might expect the gap to fill and the price to rise.
Gap and Go Strategy
The Gap and Go Strategy assumes that the stock will continue to move in the direction of the gap. For example, if a stock gaps up after a positive earnings report, you might expect it to continue rising.
Example: Apple
In April 2022, Apple’s earnings report beat expectations, causing the stock to gap up. The Gap and Go Strategy worked well here as the stock continued to rise throughout the day.
Detailed Analysis
To better understand the day-of-earnings strategies, let’s look at a detailed example with Apple:
- Earnings Beat and Gap Up: Apple reported earnings that exceeded expectations, leading to a gap up in the stock price. Historical data shows that Apple tends to continue rising after a positive earnings report, suggesting a Gap and Go Strategy.
- Earnings Beat and Gap Down: In some cases, despite positive earnings, stocks may gap down due to market overreactions or other factors. By analyzing historical data, you can determine whether such gaps typically fill, allowing you to implement a Gap Fill Strategy.
Understanding these patterns and having a strategy in place allows you to react quickly and effectively to market movements on the day of earnings.
Strategy 3: Post-Earnings Trading
Post-earnings trading involves analyzing the stock’s performance in the days following an earnings report. This strategy helps you capitalize on extended market reactions.
Analyzing Price and Volatility Trends
Similar to pre-earnings analysis, post-earnings trading requires an understanding of how the stock typically behaves after earnings are announced. Does the price continue to rise, stabilize, or fall? Does volatility drop or remain high? Understanding these patterns helps you plan your trades effectively.
Example: Disney
Using the Post-Earnings Analysis Indicator for Disney, we found that the stock tends to rise 65% of the time in the seven days following an earnings report, with an average increase of 4%. This suggests a strategy of going long on Disney after its earnings announcement.
Detailed Analysis
Breaking down the post-earnings trading strategy for Disney:
- 3 Days After Earnings: Historical data shows that Disney tends to rise 55% of the time, with an average increase of 4%. This indicates a potential short-term bullish trend.
- 7 Days After Earnings: The stock rises 65% of the time with an average increase of 4%. This consistent trend suggests a strong post-earnings performance.
By analyzing these trends, you can develop a strategy that takes advantage of the stock’s tendency to rise after earnings.
Combining Strategies for Optimal Results
To effectively trade earnings, combining the three strategies discussed can provide a comprehensive approach. By using pre-earnings, day-of-earnings, and post-earnings strategies, you can maximize your opportunities and manage your risks throughout the earnings season.
Comprehensive Approach Example: Microsoft
Combining the strategies for Microsoft:
- Pre-Earnings: Analyze the 14-day and 7-day trends. Microsoft tends to rise 70% of the time 14 days before earnings and 80% of the time 7 days before earnings. This suggests a long position as earnings approach.
- Day of Earnings: Implement the Gap and Go Strategy if Microsoft reports positive earnings and gaps up. Historical data indicates a high probability of continued upward movement.
- Post-Earnings: Analyze the 3-day and 7-day trends. Microsoft continues to rise 65% of the time in the days following earnings, suggesting a long position post-earnings.
By combining these strategies, you can create a comprehensive plan that maximizes your chances of success.
Conclusion
Trading earnings can be a lucrative strategy if approached with the right tools and knowledge. By leveraging ThinkOrSwim’s suite of earnings tools and following the three strategies outlined, you can navigate earnings season confidently and capitalize on market opportunities.
Preparation and analysis are key to successful earnings trading. Use the tools available, analyze historical data, and develop strategies that take advantage of market trends. With practice and experience, you can master how to trade earnings and enhance your trading success.
For more detailed examples and to download the indicators discussed, visit TOS Indicators. Happy trading!
© TOS Indicators 2024. All rights reserved.
This content is for personal use only. Sharing or distributing this content without permission is strictly prohibited.