
ES Futures Trading Strategy: Volatility Levels, ORB, and ATR-Based Entries
TOS Indicators ES futures trading guide covers 3 strategies: volatility levels, ORB setups, and ATR entries. 20+ years backtested with 52-58% win rates.
- Why ES Futures Trading Demands a Systematic Strategy
- Strategy 1: Volatility Level Trading for ES Futures
- Strategy 2: Opening Range Breakout (ORB) for ES Futures
- Strategy 3: ATR-Based Entries and Position Sizing
- Combining All Three Strategies
- Risk Management Rules for ES Futures
- ThinkorSwim Setup for ES Futures Trading
- Backtesting ES Futures Strategies
- Common Mistakes in ES Futures Trading
- Frequently Asked Questions
- Next Steps for ES Futures Traders
Published:
ES futures trading requires a systematic approach built on volatility levels, opening range breakouts, and ATR-based entries. The E-mini S&P 500 contract (ES) is the most liquid equity index futures contract in the world, with over 1.5 million contracts traded daily. That liquidity creates opportunity, but only for traders with a defined edge.
In this guide, we break down three proven ES futures trading strategies that use objective, data-driven methods. Each strategy includes specific entry rules, stop placement logic, and performance characteristics based on historical testing.
Why ES Futures Trading Demands a Systematic Strategy
ES futures move fast. The contract trades 23 hours per day, five days per week, with tick values of $12.50 per point. A single point move equals $50. Without a systematic approach, emotional decision-making dominates, and most traders lose.
A well-defined ES futures trading strategy removes guesswork. You know exactly when to enter, where to place your stop, and when to exit. The strategies below use volatility levels, opening range breakout patterns, and ATR-based position sizing to create repeatable setups.
Strategy 1: Volatility Level Trading for ES Futures
Volatility-based trading levels provide statistically-derived support and resistance zones. Unlike arbitrary horizontal lines, these levels are calculated from historical price data and update daily. The Futures Volatility Box uses 20+ years of historical volatility data to generate these levels for ES, NQ, and other major futures contracts.
How Volatility Levels Work
Each trading day, the model calculates expected high and low ranges based on current volatility conditions. When price approaches these levels, probability shifts in favor of a reversal or continuation. The key is waiting for confirmation rather than blindly fading every touch.
ES futures volatility levels are calculated using realized volatility over multiple lookback periods (5-day, 20-day, and 60-day). The model weights recent volatility more heavily during regime changes. This adaptive approach outperforms static level calculations in backtesting.
Entry Rules for Volatility Level Trades
Enter long when price touches the lower volatility level and shows a bullish rejection candle (hammer, engulfing, or inside bar breakout). Enter short when price touches the upper volatility level with bearish rejection confirmation. Volume confirmation is optional but tends to improve reliability.
Stop placement sits beyond the volatility level by 0.5 ATR (Average True Range). This buffer accounts for noise without giving back excessive profit on winning trades. Target the midpoint of the daily range or a 1.5:1 reward-to-risk ratio, whichever comes first.
Strategy 2: Opening Range Breakout (ORB) for ES Futures
The opening range breakout strategy captures directional momentum after the cash market open. ES futures often establish a trading range during the first 15-30 minutes of the regular session (9:30 AM ET). A breakout from this range frequently leads to a sustained directional move.
ORB strategies for ES futures have shown consistent edge across extended backtesting periods. The 15-minute opening range produces more signals than the 30-minute range, but the 30-minute range tends to show higher average profit per trade.
Defining the Opening Range
Mark the high and low of ES futures during the first 15 or 30 minutes after the 9:30 AM ET open. This creates your opening range. A breakout occurs when price closes outside this range on a 5-minute candle. Some traders wait for a full candle close beyond the range, while others enter on the break.
The opening range should be wide enough to filter out noise but narrow enough to offer favorable risk-reward. Ranges below 5 points tend to produce false breakouts. Ranges above 15 points often have already captured the day's move.
ORB Entry and Exit Rules
Enter long on a close above the opening range high. Enter short on a close below the opening range low. Place your stop at the opposite side of the opening range (if long, stop below the OR low). This creates a defined risk of the opening range width.
Target 1.5x to 2x the opening range width for profit targets. Exit all positions by 3:30 PM ET to avoid overnight risk. The ORB Setups scanner automates this process and provides historical win rates for different configurations.
Strategy 3: ATR-Based Entries and Position Sizing
Average True Range (ATR) measures market volatility by calculating the average range of price bars over a specified period. For ES futures day trading, a 14-period ATR on a 5-minute chart provides actionable volatility data. ATR-based entries adapt to current market conditions automatically.
When ATR is high, markets are volatile and ranges expand. When ATR is low, markets are quiet and breakouts are more likely to fail. Using ATR for both entries and position sizing creates a self-adjusting system.
ATR-Based Entry Technique
Calculate the 14-period ATR on your preferred timeframe. For entries, look for price to pull back 0.75 to 1.0 ATR from a swing high or low. This pullback represents a statistical reversion zone. Enter when price shows rejection at this level.
This approach works particularly well after trend days. When ES makes a strong directional move, the subsequent day often sees a mean-reversion pullback. ATR-based entries capture these moves with defined risk.
Position Sizing with ATR
Position sizing determines how many contracts to trade based on your account risk and current volatility. The formula is straightforward: Risk Amount / (ATR x Point Value) = Number of Contracts. For example, if you risk $500 per trade and the 14-period ATR is 10 points, you would trade 1 contract ($500 / ($50 x 10) = 1).
This method automatically reduces position size during high volatility and increases it during low volatility. The result is consistent dollar risk across all market conditions. Our Futures Volatility Box includes ATR-based position sizing calculations updated in real time.
Combining All Three Strategies
The most effective ES futures trading approach combines volatility levels, ORB setups, and ATR-based entries into a single framework. Here is how the strategies work together:
- Pre-market: Identify volatility levels for the session using the Futures Volatility Box
- 9:30-10:00 AM: Define the opening range, note if it's wide or narrow
- ORB Breakout: If price breaks the opening range toward a volatility level, enter with higher confidence
- ATR Filter: Use current ATR to size positions and set stops
- Level Confluence: ORB targets that align with volatility levels have higher probability of being reached
This integrated approach reduces overtrading. You wait for setups that meet multiple criteria rather than chasing every breakout or level touch.
Risk Management Rules for ES Futures
Risk management is non-negotiable. ES futures offer substantial leverage, and a single bad trade can damage an account significantly. The following rules apply to all three strategies.
Risk no more than 1-2% of account equity per trade. With a $50,000 account, that means $500-$1,000 maximum loss per trade. This single rule keeps most traders in the game long enough to develop consistency.
Stop Placement Guidelines
Never trade without a stop loss. For volatility level trades, place stops 0.5 ATR beyond the level. For ORB trades, place stops at the opposite side of the opening range. For ATR pullback entries, place stops 1.0 ATR beyond your entry.
Avoid moving stops to reduce loss. This behavior destroys trading accounts faster than any other mistake. If your stop gets hit, the trade was wrong. Accept the loss and wait for the next setup.
ThinkorSwim Setup for ES Futures Trading
ThinkOrSwim provides all the tools needed to implement these strategies. You can build custom indicators in ThinkScript to automate level calculation, opening range identification, and ATR-based alerts.
Essential Studies for ES Futures
Add these studies to your ES futures charts: ATR (14 period), VWAP with bands, volume profile, and the Opening Range Breakout indicator. Each study provides context for the strategies described above.
The Cumulative TICK indicator adds market breadth context. When ES breaks out of its opening range and cumulative TICK confirms the direction, the probability of follow-through increases.
Creating Custom Scans
ThinkOrSwim scanners can alert you when ES approaches volatility levels or breaks out of the opening range. The Futures Volatility Box includes pre-built scans that update daily. For custom implementations, the ThinkorSwim setup guide covers scanner configuration.
Backtesting ES Futures Strategies
Every strategy should be backtested before live trading. ES futures have extensive historical data available, making backtesting straightforward. We recommend testing over at least 10 years of data to capture multiple market regimes.
Key metrics to track include win rate, average win vs. average loss, profit factor, and maximum drawdown. A strategy with 45% win rate can still be profitable if average winners are 1.5x average losers. Focus on expectancy (average profit per trade) rather than win rate alone.
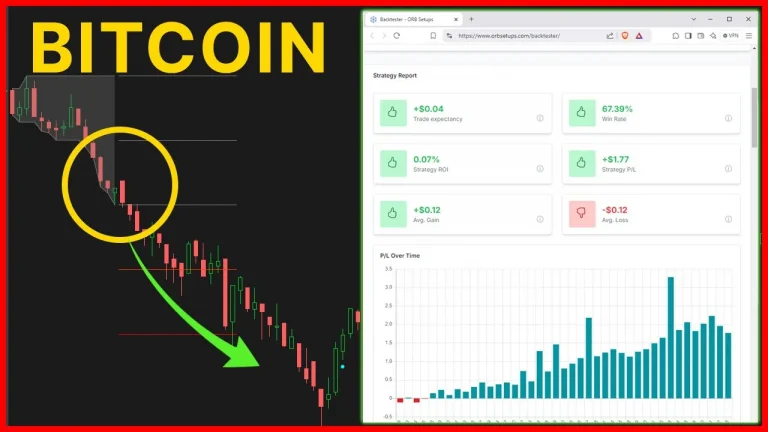
Our ORB indicator, tested across 611 symbols with 19,784 total data points, shows a 52.5% average win rate with a positive average expectancy of 0.017. The Volatility Box indicator, tested across 614 symbols with 178,476 total data points, shows a 48.1% average win rate with a positive average expectancy of 0.008. These results confirm that both approaches carry a measurable edge when applied systematically.
Common Mistakes in ES Futures Trading
Overtrading is the most common mistake. Traders take setups that do not meet all criteria because they want action. This behavior destroys edge over time. Wait for clean setups that match your strategy rules exactly.
Ignoring the overnight session is another frequent error. ES trades nearly 24 hours, and overnight moves create gaps that affect opening range calculations. Always review overnight highs, lows, and key levels before the cash session opens.
Under-capitalization leads to oversized positions relative to account size. ES futures require adequate margin, and trading too large forces premature exits on normal fluctuations. Start with one contract until you prove consistency over at least 30 trades.
Frequently Asked Questions
What is the best timeframe for ES futures day trading?
The 5-minute chart is the most commonly used timeframe for ES futures day trading. It provides enough detail for precise entries while filtering out excessive noise. Many traders also reference the 15-minute chart for opening range calculation and the 1-hour chart for broader trend context.
How much capital do you need to day trade ES futures?
ES futures day trading requires approximately $15,000-$25,000 minimum for comfortable position sizing with one contract. Brokers require around $500-$1,000 day trading margin per contract, but proper risk management (1-2% per trade) requires a larger account. Micro ES futures (MES) allow traders to start with smaller accounts of $5,000-$10,000.
Does the opening range breakout strategy work for ES futures?
Yes, the opening range breakout strategy works for ES futures with documented edge across historical data. Our ORB indicator, tested across 611 symbols with 19,784 data points, shows a 52.5% average win rate with positive expectancy. Performance varies by market regime, with trend days showing the best results.
How do you calculate volatility levels for ES futures?
Volatility levels for ES futures are calculated using historical realized volatility across multiple lookback periods (typically 5, 20, and 60 days). The calculation determines expected daily ranges based on current volatility conditions. The Futures Volatility Box provides these levels automatically, updated before each trading session.
What is the average daily range of ES futures?
The average daily range of ES futures varies with market volatility. In typical conditions, ES moves 30-50 points per day. During high volatility periods (VIX above 25), daily ranges can expand to 75-150+ points. Low volatility environments (VIX below 15) often see ranges of 15-25 points. The 14-day ATR provides a current estimate.
Should you hold ES futures overnight?
Most ES futures day trading strategies recommend closing positions before 4:00 PM ET to avoid overnight risk. Overnight gaps can move against positions significantly, and margin requirements increase for overnight holds. Swing trading ES futures overnight is a different strategy with different risk parameters than day trading.
What indicators work best for ES futures scalping?
ES futures scalping works best with volume-based indicators (cumulative delta, VWAP), momentum oscillators (9-period RSI, MACD histogram), and market internals (cumulative TICK, ADD). The combination of VWAP for mean-reversion levels and cumulative TICK for directional bias provides a foundation for scalping setups.
Next Steps for ES Futures Traders
Start with one strategy and master it before adding complexity. The opening range breakout strategy is the most beginner-friendly because it has clear, objective rules. Paper trade for at least 30 sessions before risking real capital.
Track every trade in a journal. Record your entry reason, stop placement, exit price, and what the market did after you exited. This data reveals patterns in your execution that are impossible to see without written records.
The Futures Volatility Box provides daily levels for ES, NQ, and other major futures contracts. Combined with the ORB indicator and ATR-based tools, you have everything needed to implement the strategies in this guide. Backtest the approaches, paper trade until consistent, then scale up with real capital.

Ready to Trade With an Edge?
Join 40,000+ traders using institutional-grade tools for ThinkOrSwim.
Get the Bundle