Table of Contents
Introduction
In this tutorial, you’ll learn how to build a monthly watchlist in a few seconds, by running the same scan every single month.

Seasonality is one of the great hidden opportunities in the stock market – and easily available to scan by the retail trader. Stocks tend to rise and fall at predictable times year after year (or so the hypothesis is!). And this scan looks to take advantage of this!
By combining seasonal patterns with current market trends, we can uncover some of the highest probability trades out there.
In this tutorial, we’ll walk through building a ThinkOrSwim scan to find these seasonal trading opportunities each month. We’ll track down stocks poised for outsized moves based on historical performance and momentum.
Here’s what we’ll cover in this step-by-step seasonal scan tutorial:
- How to build a monthly watchlist easily
- Scanning for the best seasonality patterns
- Incorporating trend for multiple time frames
- Exporting monthly watchlists
- Digging deeper with max history in charts
- Ideas for further analyzing scan results
Let’s get started!
Volatility Box Invite
We are TOS Indicators.com, home of the Volatility Box.
The Volatility Box is our secret tool, to help us consistently profit from the market place. We’re a small team, and we spend hours every day, after the market close, doing nothing but studying thousands of data points to keep improving and perfecting the Volatility Box price ranges.
We have two different Volatility Boxes – a Futures Volatility Box and a Stock Volatility Box.
Futures Volatility Box – Trade Major Markets With an Edge
Designed For: Futures, Micro-Futures and Index Market Traders
Supported Models: Hourly Volatility Box models
Supported Markets: 10 Major Futures Markets
The Futures Volatility Box comes with:
- 5 Volatility Models for each market
- Support for 10 Futures Markets (/ES, /NQ, /YM, /RTY, /CL, /GC, /SI, /ZB, /HG, /NG)
- Video Setup Guide
- Trade Plan
- Access to all members-only resources, including Squeeze Course
Why Seasonal Scanning Works
Seasonality persists across decades for two key reasons:
- Structural Cycles – Events like earnings, holidays, and even weather create an annual cycle in many stocks. Retail stocks for example often peak twice a year around back-to-school and holiday shopping periods.
- Self-Fulfilling Prophecies – When enough market participants expect something to happen, it usually does. Active traders will bid up stocks in historically strong months, creating rising demand and volatility.
Studies show equity returns often concentrate in just a few peak months. Stocks already poised to outperform can see massive price expansion from surging seasonal and momentum demand.
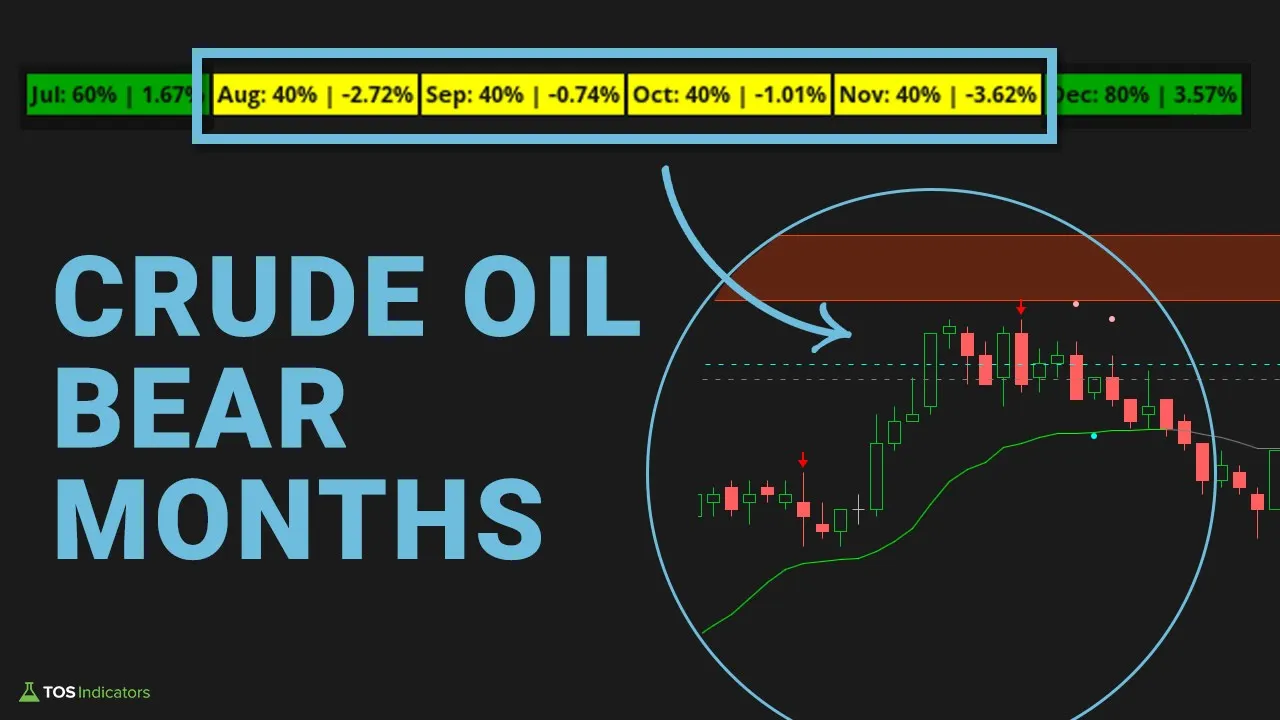
That makes combining seasonality with current technical strength a very powerful pairing. We want to be buying into established uptrends ahead of historically bullish periods.
ThinkOrSwim Scan Setup
ThinkOrSwim has incredibly robust built-in scanning capabilities through its Scan tab, which is what we will use to speed up the process.
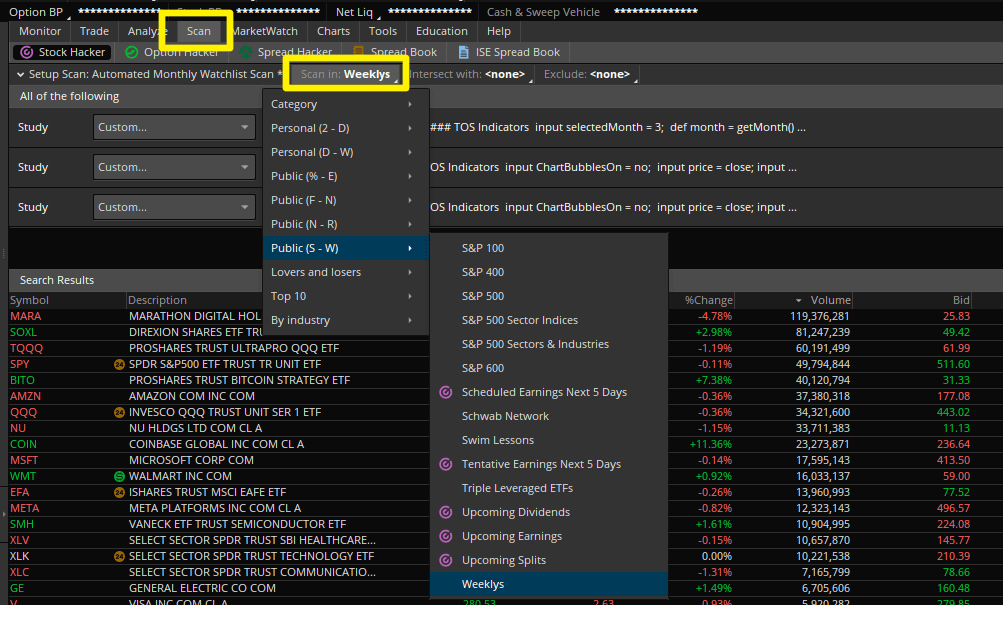
Here are the key settings that I like to use:
- Scan In – Choose an underlying universe of stocks, ETFs, options, etc. We’ll use the “Weeklys” preset watchlist to focus on liquid names.
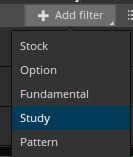
- Add Filter – Adds custom criteria based on studies, fundamentals, options, and more. We’ll leverage this to insert our seasonal and momentum metrics.
- Timeframe – Sets the timeframe used for technical analysis – ie, daily, weekly, monthly. Choose appropriately based on your trading duration.
This scan workflow lets you filter thousands of ticker symbols down to a focused watchlist in seconds. It’s far faster than tedious chart-by-chart analysis.
Now let’s look at how to add seasonal and momentum metrics.
Seasonal Analysis Custom Study Filter
The Seasonal Analysis indicator from TOSIndicators.com contains detailed historical performance data for each month across 20+ years. We can tap into this directly in our scan filter.
Here are the steps:
- Open Seasonal Analysis study code
- Copy all March calculation logic
- Paste into Scan Filter thinkScript editor
- Set filter conditions:
- March positive >80% years
- March average gain > 0%
This ensures March tends to close higher than its open with positive average returns.
Do this for whichever month you want to scan.
Market Pulse Custom Study Filter
While seasonality gives us probabilities rooted in long-term patterns, current momentum shows whether demand is also heating up right now.
The Market Pulse indicator signals trend strength using a Variable Moving Average crossover system. We can scan for stocks with Market Pulse bullish signals on both daily and weekly charts.
This means finding tickers with:
- Daily Market Pulse: Bullish = True AND Close >= VMA
- Weekly Market Pulse: Bullish = True AND Close >= VMA
Requiring momentum alignment across timeframe perspectives gives us added confidence we’re buying into surging upward trajectory.
Building the Watchlist
After adding our seasonal and momentum metrics as filters, we’ll typically reduce an initial universe of 600+ tickers down to a focused subset of around ~50 stocks poised to trend higher.
We can save these scan results as a custom ThinkOrSwim watchlist for easy reference each month.
Make sure to append with the month/year so you can track how well these seasonal selections actually performed.
Now the final step is diving into the detailed single stock analysis. Scan limitations mean some of the historical seasonal data only extends 3 years back.
So take a few minutes to examine max history charts of your scanned selections:
- Verify seasonal performance consistency
- Incorporate other indicators like the Edge Signals and Squeeze Indicators
- Identify ideal entry, exit and stop loss levels
- Size positions according to risk management plan
Annotating each chart with key levels and manually evaluating historical March performance (with 20+ yrs of data) creates a blueprint for executing on these high probability seasonal patterns each month.
In less than a few seconds, you can leverage ThinkOrSwim to build a monthly watchlist, customized specifically for you. Combining seasonal tendencies with trend strength filters out the unlikely occurrences from the consistent outperformers.
This scan is equally useful for both day traders and swing traders, and can be customized further based on specific needs.
Monthly Watchlist Scan.ts
# Monthly Watchlist Scan for ThinkOrSwim

# Generated by TOS Indicators

# Full tutorial: tosindicators.com/indicators/monthly-watchlist-scan

# User Inputs

input length = 14;


// ... 23 more lines ...Import the Monthly Watchlist Scan indicator through Studies > Edit Studies > Import. Once loaded, the indicator automatically analyzes price action and generates signals. Key settings include period length, signal sensitivity, and display options. Most traders find the default settings work well, but you can customize based on your timeframe and trading style.
The optimal Monthly Watchlist Scan settings depend on your trading timeframe. Start with default settings and adjust based on backtesting results. Key parameters to optimize include lookback period, signal threshold, and confirmation requirements.
The Monthly Watchlist Scan indicator is designed to not repaint once a candle closes. All calculations are based on confirmed price data, ensuring signals remain consistent for backtesting and live trading. However, always verify this behavior in OnDemand mode before using real capital.
Yes, the Monthly Watchlist Scan works well for day trading when properly configured. Use it on 5-15 minute charts with tighter settings for more responsive signals. Combine with volume analysis and support/resistance levels for higher probability setups. Always use stop losses as intraday moves can be volatile.
Use ThinkOrSwim's OnDemand feature to backtest the Monthly Watchlist Scan indicator. Load historical data, apply the indicator, and manually track signals and outcomes. For automated backtesting, combine with ThinkOrSwim's strategy functions. Document win rates, average gains/losses, and optimal market conditions for best results.
Here are some resources that you may find useful: