Table of Contents
Introduction
Welcome to another thinkScript tutorial!
We’re going to take our Anchored Volume Weighted Average Price (Anchored VWAP) Indicator and turn that into a scan.
If you don’t already have the Anchored VWAP indicator, you can download it here. You’ll need it to follow along, and it’s completely free.
Here is a chart to give you an idea of what we’re trying to find with this scan.
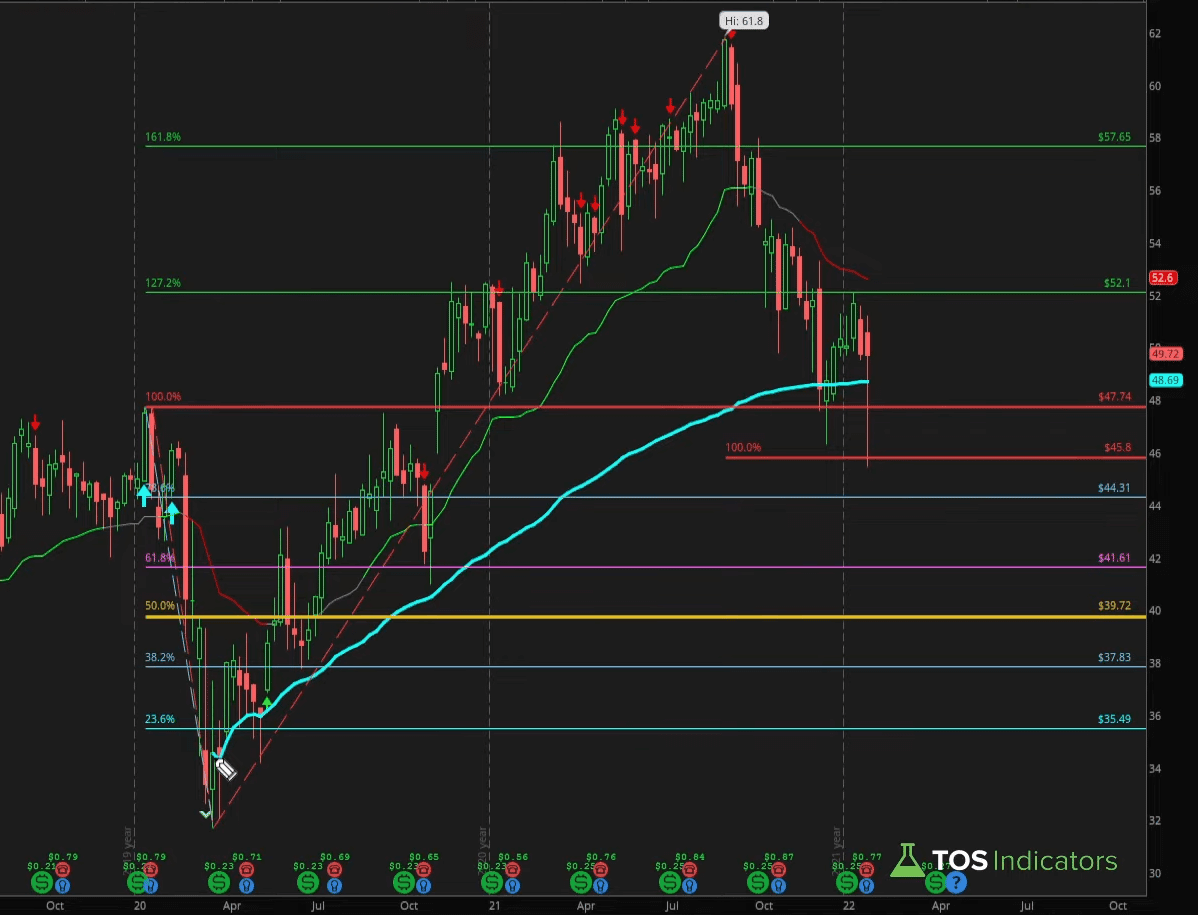
SBUX example chart:
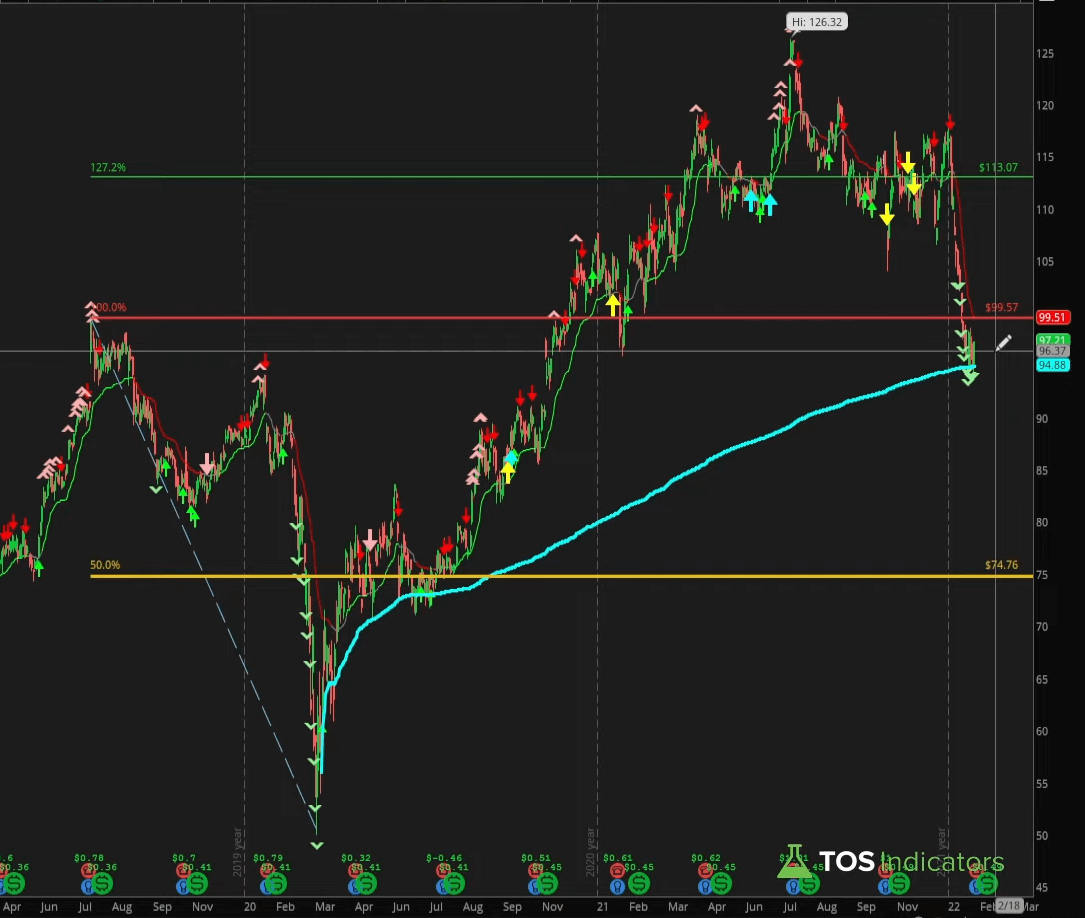
We have anchored the VWAP to the March lows. You can see the first candle going up after the March lows, on a weekly time frame chart.
Notice the different pullbacks to the Anchored VWAP line, and how the VWAP acts as a support for a shorter term bounce.
I’ve noticed this type of idea works a little better on stocks that most people are looking at. There’s more liquidity, think the largest blue-chip stocks you can think of…, your S&P-100 stocks.
Of course, the scan works on every type of market, but we’ll focus on the best of the best for this exercise.
Building the Scan

Click the scan tab, and we’ll start with two basic filters:
- Volume filter – looking for stocks that have an average trade volume of x per day
- Price filter – looking for stocks that are greater than $x
Click add filter, go to the drop-down where it says ADXCrossover and choose custom. This is where we can add our Anchored VWAP code.

Note: Custom study filters only work on live money. If you’re in paper trading, you will not be able to follow along with this.
Click the tab that says “thinkScript Editor” and paste the Anchored VWAP code.
We need to make 3 changes in the code in order to scan what we’re looking for
- Change the Aggregation Period – ThinkOrSwim will make the time period daily by default, and we need to adjust that to weekly. The weekly time frame allows us access to more historical data, which may be necessary for a date further back than 1 year.
- Change the Anchor Date – Pick a new anchor dateClean Code – Remove all the formatting code, as we won’t need it for the scan.
- Update Plot Variables – change the plot variables to def variables so that we can create our own custom, scan condition
After making the changes, this is what the Anchored VWAP scan code looks like:
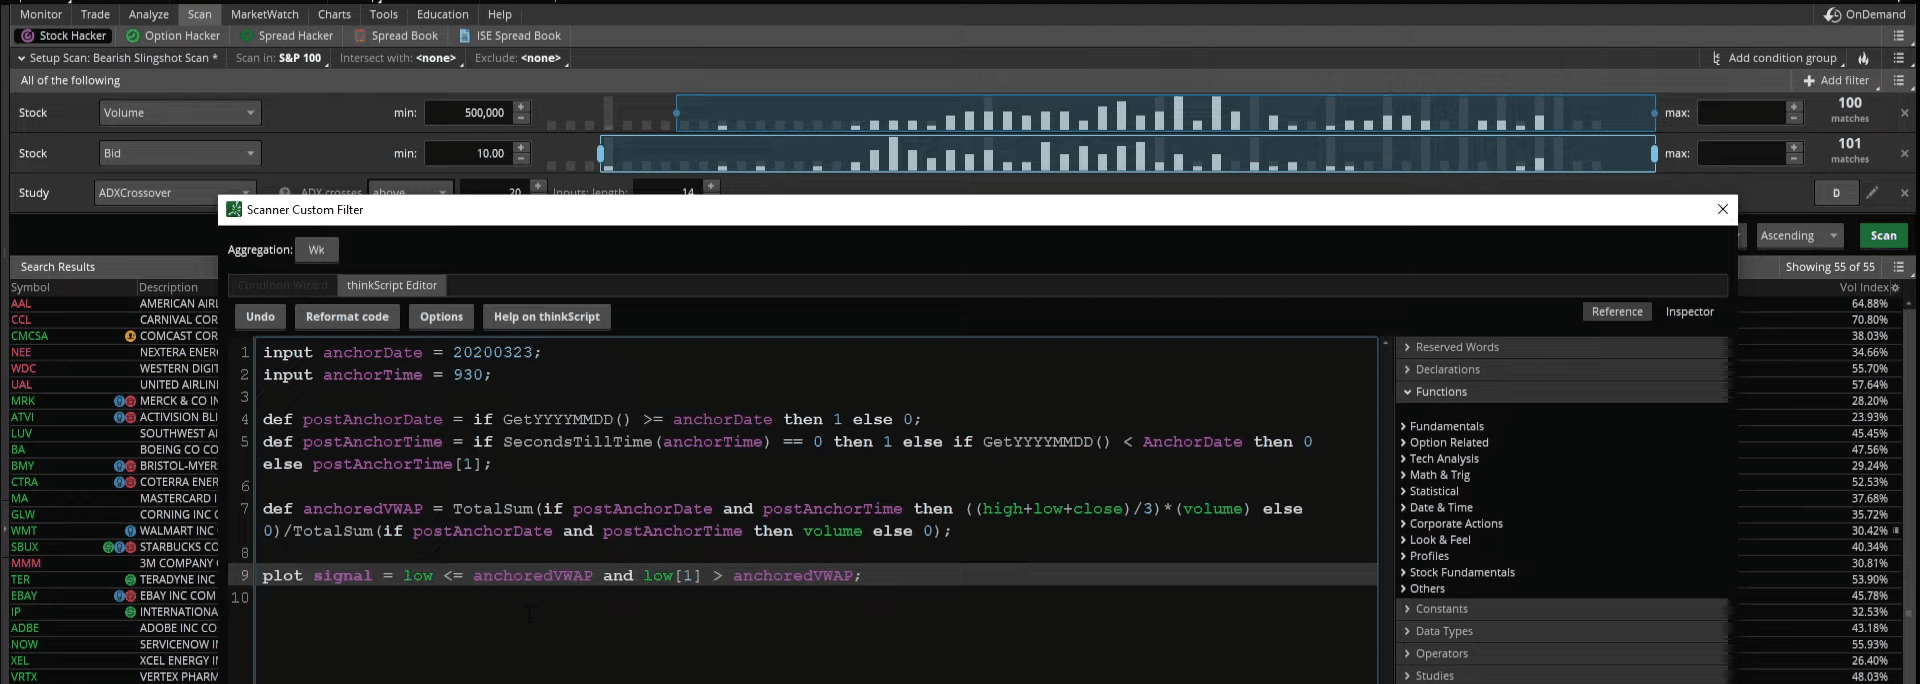
And this is our plot variable (aka scan condition):
plot signal = low <= anchoredVWAP and low[1] > anchoredVWAP;
Run the scan and see if the results line up with what you would expect. In the video tutorial, we’ll test this on Starbucks, which we know is currently an example of our “picture perfect” setup.
Examples
COMCAST (CMCSA)
Let’s look at Comcast to see if it fits the criteria that we already have. So, change the chart tab to CMCSA.
We see that Comcast is pulling back towards the Anchored VWAP line, and on our previous week, we were above the VWAP. As for this week, our low was below the VWAP, and we also closed above the VWAP price.
So the scan worked!
CMCSA does have an active pullback to the VWAP anchored to March lows, and we were able to find it easily. Let’s try another example.
Walmart (WMT)
In Walmart, we see something similar, a little bit less drastic in terms of that March to Feb decline, but still meeting our conditions:
Boeing (BA)

Unlike Walmart or Starbucks, Boeing has never really made much of a move, so it looks a little bit unattractive on the decline, but it is still on the same line of the VWAP extrapolated from those lows.
All of these meet the same scan criteria that we are looking for.
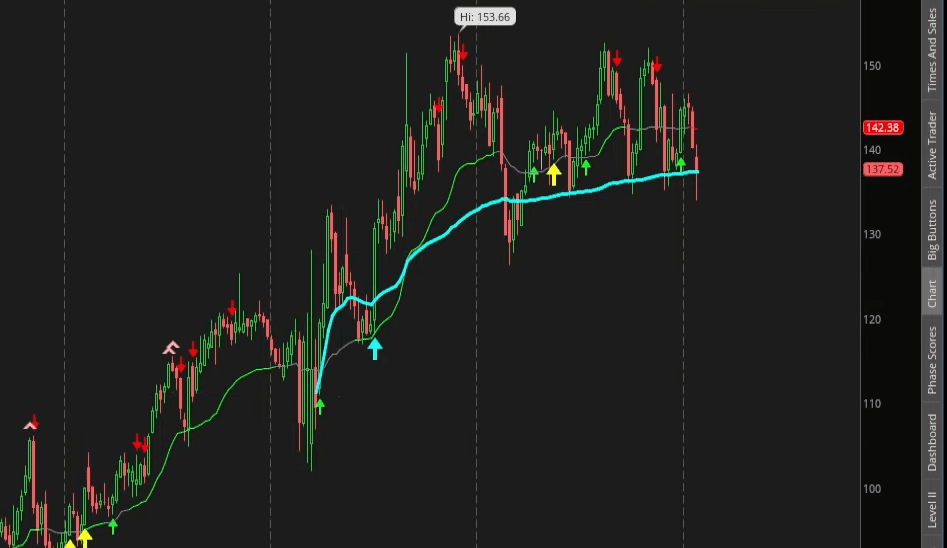
Pro Tip: For Volatility Box members, try using the Edge Signals indicator to confirm bounces away from the Anchored VWAP line.
You can also narrow down your timeframe to zoom in and see overbought/oversold confirmations on a more granular basis.
Conclusion
To summarize, we started with a weekly time frame scan to scan for markets currently pulling back to the Anchored Volume Weighted Average Price. If you’d like to see more granular data, try narrowing down the time frame to smaller values like daily, or hour basis, whatever fits your bill. Use that to see confirmation of moves away from VWAP level that we’re looking at.
A couple indicators that indicates that the trend is changing
- Edge Signal indicator – our overbought/oversold confirmation.
- Market Pulse (Free) – our trend indicator
I hope this video was helpful to the Anchored VWAP traders, or even investors looking to build a list of stocks that you think might be long overdue for a shorter term bounce.
It can also help to find a list of stocks fairly quickly that has basis using previous lows.
You can download and import these scans into your ThinkOrSwim platform for your trading.
Take care everyone, and good luck trading.
Anchored VWAP Scans .ts
# Anchored VWAP Scans for ThinkOrSwim

# Generated by TOS Indicators

# Full tutorial: tosindicators.com/indicators/anchored-vwap-scans

# User Inputs

input length = 14;


// ... 23 more lines ...Import the Anchored VWAP Scans indicator through Studies > Edit Studies > Import. Once loaded, the indicator automatically analyzes price action and generates signals. Key settings include period length, signal sensitivity, and display options. Most traders find the default settings work well, but you can customize based on your timeframe and trading style.
The optimal Anchored VWAP Scans settings depend on your trading timeframe. Start with default settings and adjust based on backtesting results. Key parameters to optimize include lookback period, signal threshold, and confirmation requirements.
The Anchored VWAP Scans indicator is designed to not repaint once a candle closes. All calculations are based on confirmed price data, ensuring signals remain consistent for backtesting and live trading. However, always verify this behavior in OnDemand mode before using real capital.
Yes, the Anchored VWAP Scans works well for day trading when properly configured. Use it on 5-15 minute charts with tighter settings for more responsive signals. Combine with volume analysis and support/resistance levels for higher probability setups. Always use stop losses as intraday moves can be volatile.
Use ThinkOrSwim's OnDemand feature to backtest the Anchored VWAP Scans indicator. Load historical data, apply the indicator, and manually track signals and outcomes. For automated backtesting, combine with ThinkOrSwim's strategy functions. Document win rates, average gains/losses, and optimal market conditions for best results.
Here are some resources that you may find useful: