
 Fair Value Gap
 False Breakout Scanner
 Heiken Ashi Trend
 Stock Volatility Box
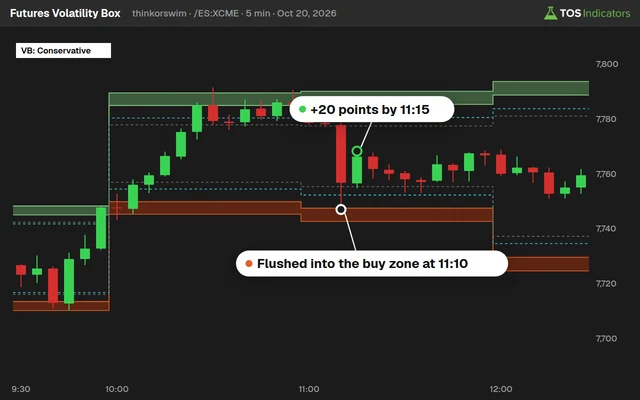 Futures Volatility Box
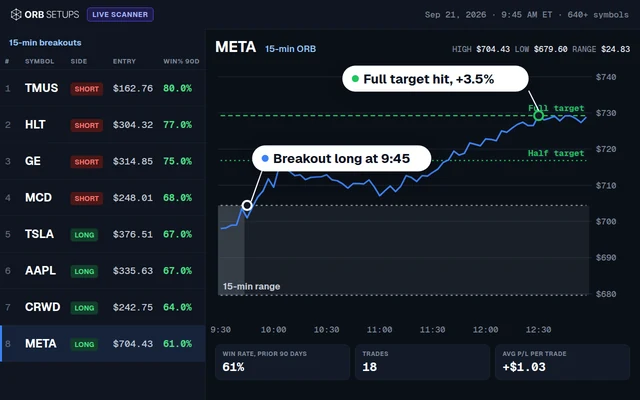 ORB Setups
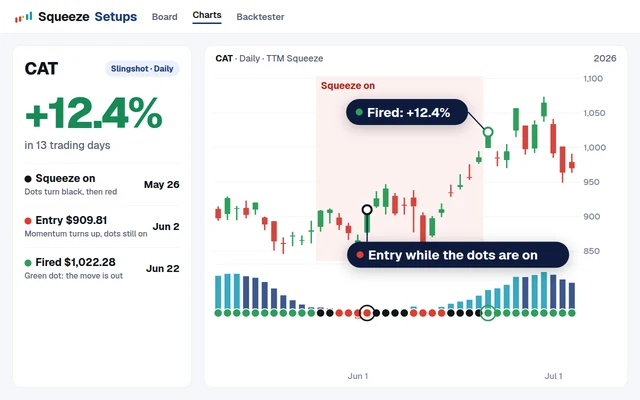 Squeeze Setups
A constant theme in our 2020 videos has been the idea of Gold being a leading indicator.
It helps us confirm our signals on the indices, and gives us clues as to what's likely to come. Today was no different.
Some previous research on patterns in Gold:
- Why Gold Has Been the Better Market to Trade (from -$800 to +$180)
- 5 Observations From Recent Market Volatility
In this video, we'll walk you through (during live-market hours), what we're seeing and how we're evaluating whether or not to take a trade.
We had a setup in the NQ futures - an opportunity to go short, which was near our Volatility Box edge. We used the relative volatility of GC to give us clues, as to whether or not we were likely to see any kind of follow-through.
For scalpers, you may see the same chart in a completely different light. For example, the NQ futures levels did offer you several nice bounces into the 9600 support zone.
However, for us - we were looking for a minimum follow through of at least ~17 NQ points ($240).
The Volatility Box is really what makes deciphering relative volatility so easy to do, at a glance of the charts.
Start trading with an edge, at the edge, and sign up for the Volatility Box today
 Is Apple Stock a Buy Right Now?
 Three Key Levels to Trade in NVDA for 2025
 Pay Attention to These Levels in NVDA Stock
 Instantly Reduce Risk and Increase Reward
 Nvidia Earnings Patterns After a “Beat”
 The Power of Multi-Time Frame Trends