Wilder's Momentum Concept
Explore the multi-decade old momentum concept created by Wilder, using a few, simple lines of code

Introduction
In today’s tutorial, we will translate a 40-year-old trading concept into a trading indicator for ThinkOrSwim.
This concept measures momentum by looking at the change in price over time. This momentum factor is the secret sauce, allowing you to spot changes in direction.
Here’s what we'll discuss in this tutorial:
- Understand Wilder’s Momentum Concept
- Write thinkScript Code or Thinkorswim Indicator
- Translate the Indicator into a Scan
Let's get started!
Volatility Box Invite
We are TOS Indicators.com, home of the Volatility Box.
The Volatility Box is our secret tool, to help us consistently profit from the market place. We’re a small team, and we spend hours every day, after the market close, doing nothing but studying thousands of data points to keep improving and perfecting the Volatility Box price ranges.
We have two different Volatility Boxes - a Futures Volatility Box and a Stock Volatility Box.
Futures Volatility Box - Trade Major Markets With an Edge
Designed For: Futures, Micro-Futures and Index Market Traders
Supported Models: Hourly Volatility Box models
Supported Markets: 10 Major Futures Markets
The Futures Volatility Box comes with:
- 5 Volatility Models for each market
- Support for 10 Futures Markets (/ES, /NQ, /YM, /RTY, /CL, /GC, /SI, /ZB, /HG, /NG)
- Video Setup Guide
- Trade Plan
- Access to all members-only resources, including Squeeze Course
Learn More About the Futures Volatility Box
Trade futures and micro futures with a consistent volatility edge
Stock Volatility Box - Powerful Web Based Volatility Platform
Designed For: Stock and Options Traders
Supported Models: Hourly and Daily Volatility Box models
Supported Markets: 10,000+ Stocks and ETFs (new markets added frequently)
A Stock Volatility Box membership includes access to:
- Live Scanner - A powerful scanner we've built from scratch, to scan 10,000 symbols every 2 seconds for new volatility breaches
- Dashboard - A quick and easy way to view daily volatility model levels online
- Short Interest Scanner - Short interest, Squeeze, and EMA data to find short squeezes
- Squeeze Course - All of our proprietary squeeze tools, including robust backtesters
- All Members Only Indicators - We don't nickel and dime you. Everything really is included.
- And much more!
Learn More About the Stock Volatility Box
Trade stocks and options with a consistent volatility edge
What is the Momentum Concept and Factor?
Wilder's Momentum Concept is a way to measure the change in price over time. It uses a momentum factor, which is a number that shows if the price is going up or down.
The main benefits of using Wilder's Momentum Concept are:
- It helps you understand the direction of the market.
- It can help you make better trading decisions.
- It can improve your risk management.
This simple concept can help almost all traders make smarter trading decisions.
It uses something called a momentum factor, which is a number that makes it easy to tell if the price is going up or down.
Think of the momentum factor as a way for you to measure the speed at which the price of an asset is changing.
The main benefits of the momentum factor are:
- Identify when there are shifts in momentum
- Ride the ebb and flow of a stock's price
- Easy to calculate
The momentum factor relies calculating the closing price to two days ago, and using that for a long / short entry combination. A long entry is triggered when the momentum factor (not the closing price) is higher than the previous two day's momentum factor.
Similarly, a short entry is triggered when the momentum factor is lower than the previous two day's momentum factor.
According to the momentum ocncept, whenever either the long or short entry is triggered, a trader has an edge.
How to Calculate the Momentum Factor
Calculating the momentum factor involves simple arithmetic. It's what the information tells us is where the secret sauce lies.
To calculate the momentum factor:
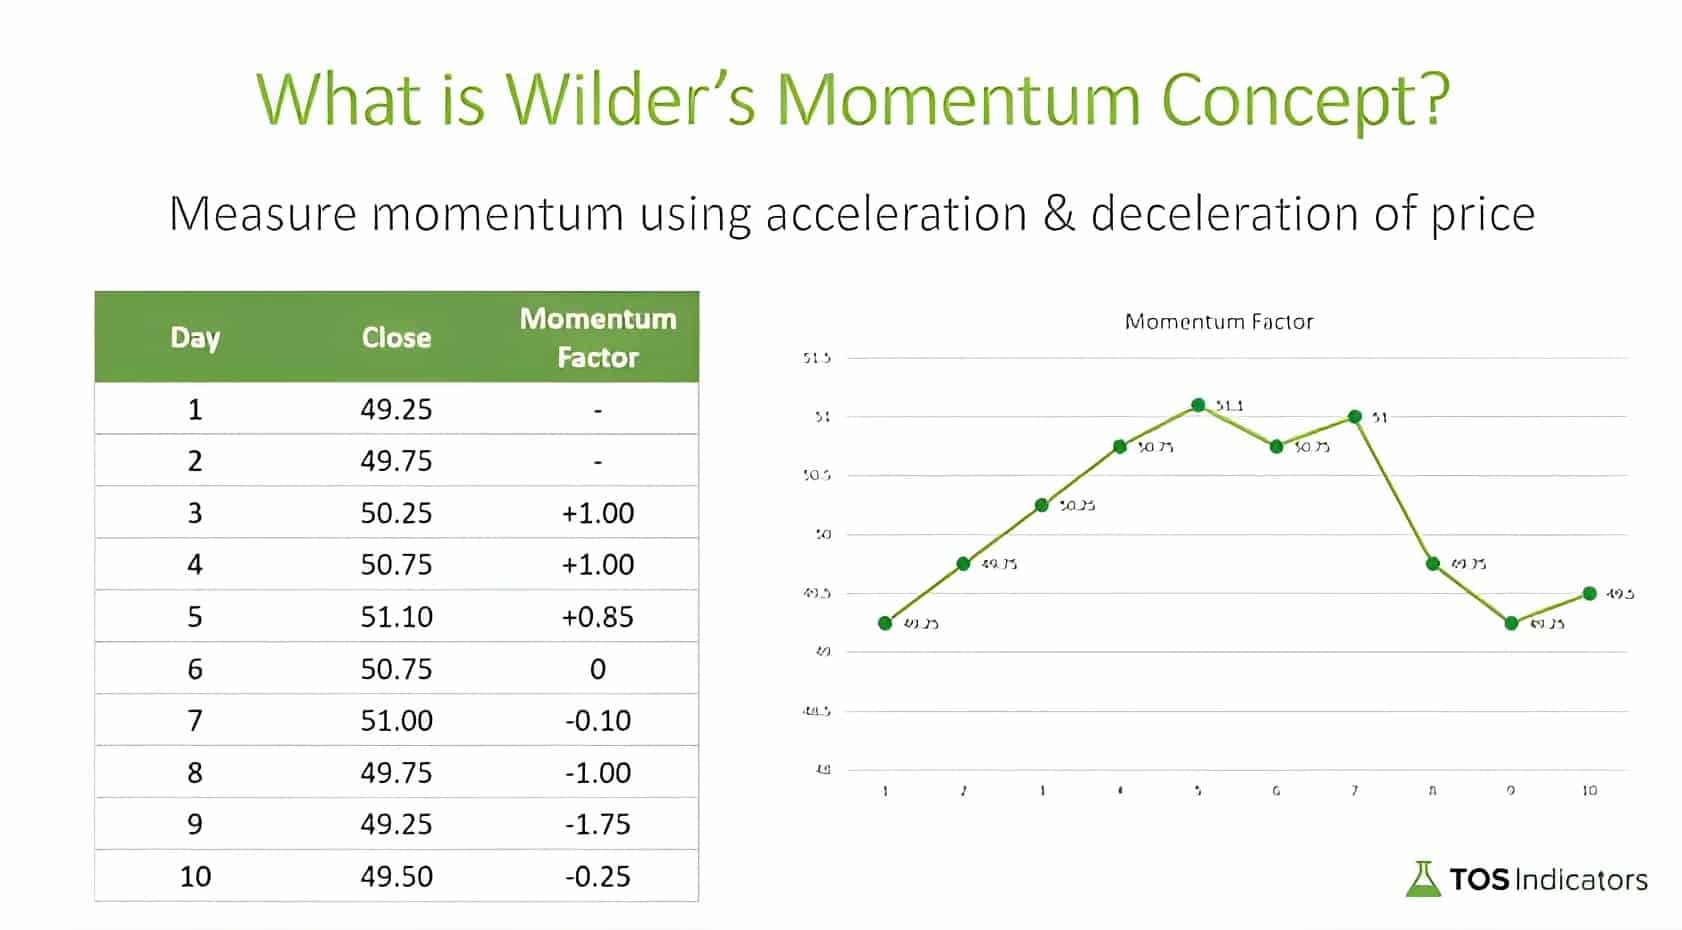
- Gather the closing prices of a stock for your selected time frame. In our example, the first two bars are our starting data points, with a closing price of $49.25 on Day 1 and $49.75 on Day 2.
- Calculate the momentum factor by taking the closing price of the current day and subtracting the closing price from 2 days ago. For example, on day 3, the momentum factor would be calculated as 50.25 (closing price on Day 3) - 49.25 (closing price from 2 days ago) = +1.
- Repeat this process for each day, recording the momentum factor.
- To determine when to go long or short, Wilder suggests looking at the momentum factor and comparing it to the previous two days.
- If the current momentum factor is higher than either of the previous two days, it's a signal to go long.
- If the current momentum factor is lower than both of the previous two days, it's a signal to go short.
Using our example, on Day 5, the momentum factor is 0.85, which is lower than both of the previous two days (+1 and +1). This would be a signal to go short.
On Day 10, the momentum factor is -0.25, which is greater than the previous two days (-0.5 and -0.15). This would be a signal to go long.
Building a Thinkorswim Indicator
To build the Wilder's Momentum Concept in ThinkOrSwim, follow these steps:
- Click the studies Icon.
- Create a new script by giving it a name.
- Define the momentum factor by using the closing price and comparing it to the closing price two days prior:
def momentumFactor = close - close [2];
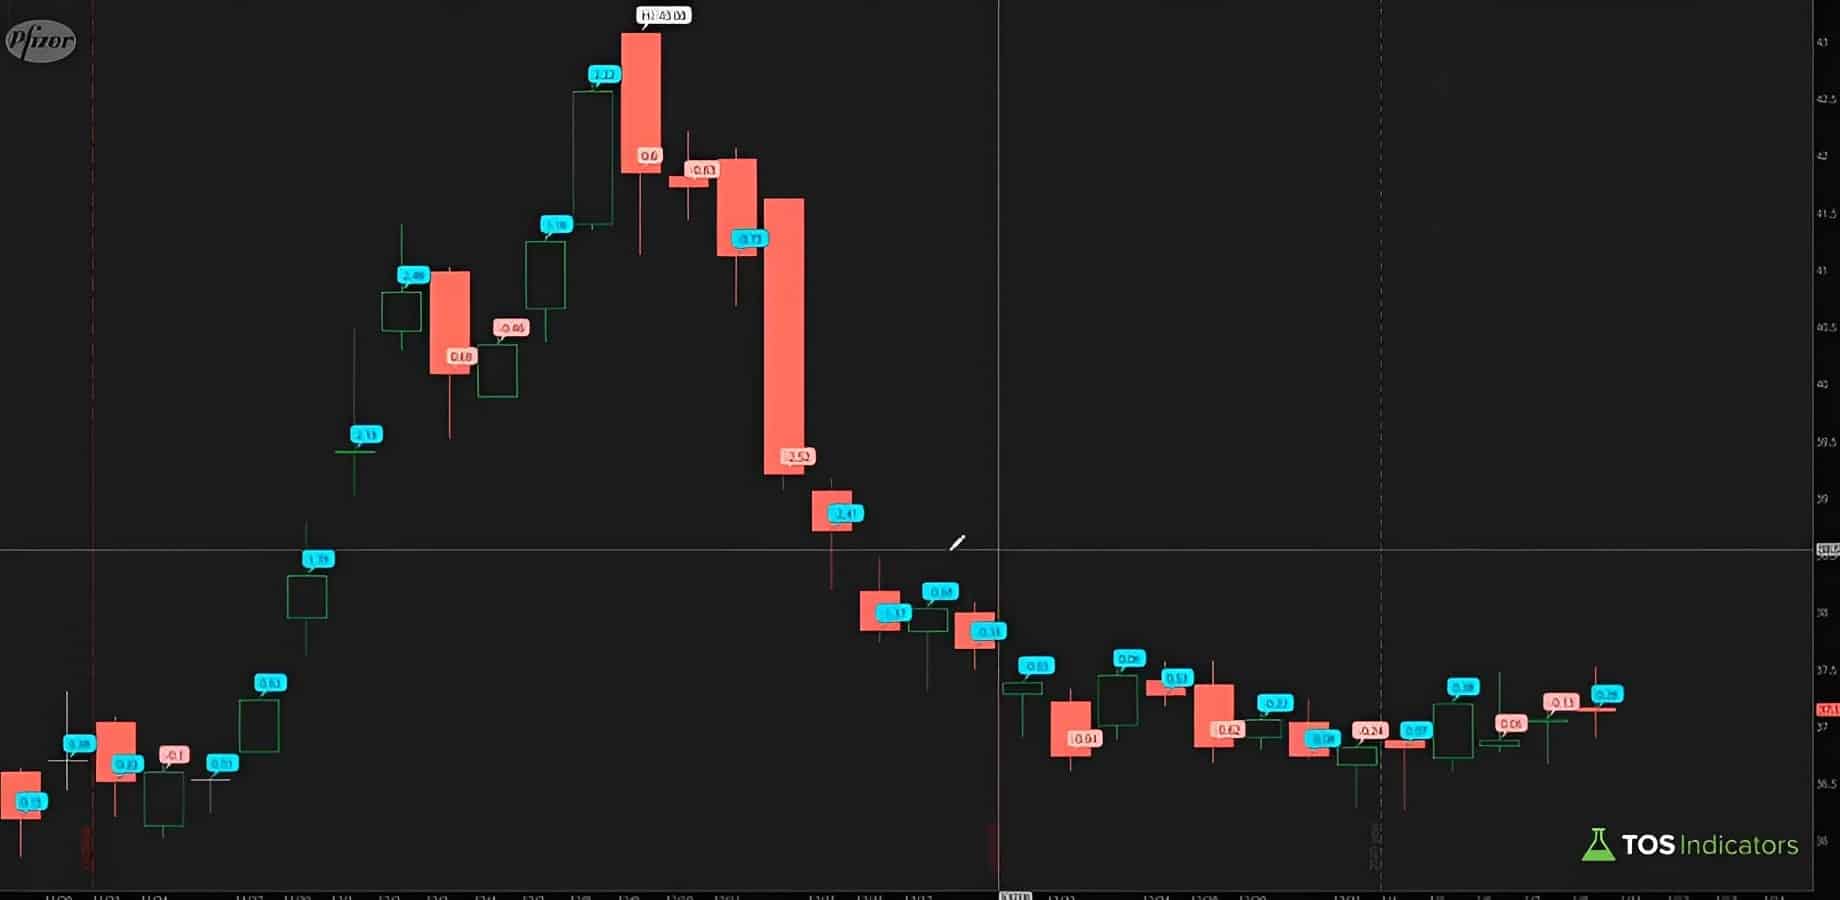
- Add a chart bubble to visualize the momentum factor:
AddChartBubble(yes, close, momentumFactor, color.yellow);
- Define the long entry:
def longMomentumFactorEntry = if momentumFactor > momentumFactor[1] or momentumFactor > momentumFactor[2] then 1 else 0;
- Define the short entry:
def shortMomentumFactorEntry = if momentumFactor < momentumFactor[1] and momentumFactor < momentumFactor[2] then 1 else 0;
- Use points to plot the entries on the chart:
longMomentumFactorEntry.setPaintingStrategy(PaintingStrategy.Points);
shortMomentumFactorEntry.setPaintingStrategy(PaintingStrategy.Points);
- Add an alert for the long and short entries:
longMomentumFactorEntry.addAlert(alert.priceCrossAbove, alert.bar, sound.bell);
shortMomentumFactorEntry.addAlert(alert.priceCrossBelow, alert.bar, sound.bell);
- Click "OK" to save the script.
The Wilder's Momentum Concept indicator is now built and ready to use in ThinkOrSwim.
When applied, it should look like this:
The next step is build a scan, to find long or short setups where the momentum factor is triggering an entry.
In the next section, I will show you how to translate the indicator’s code into a scan (and work with TOS limitations).
Want to Reverse Engineer the Momentum Factor?
Try using the Trend Balance Point System, which reverse engineers the momentum factor. This system calculates what the closing price needs to be for a momentum entry to trigger.
Translating the Momentum Concept into a Scan
To translate the indicator code into a scan for ThinkOrSwim, follow these steps:
- Copy the code for the Wilder's Momentum Concept indicator from earlier in the tutorial.
- Go to the "Scan" tab in ThinkOrSwim
- Add a filter by clicking on the "Add Filter" button, and selecting "Study" from the dropdown menu. Choose "Custom" from the next dropdown menu.
- In the thinkScript tab, paste the indicator code as our starting point.
- Remove all unnecessary code for the momentum factor calculation, and turn plot variables into def variables.
- The remaining code should look like this:
def momentumFactor = close - close [2];
def longMomentumFactorEntry = if (momentumFactor > momentumFactor[1] or momentumFactor > momentumFactor[2]) then 1 else 0;
def shortMomentumFactorEntry = (if momentumFactor < momentumFactor[1] and momentumFactor < momentumFactor[2]) then 1 else 0;
- Create a signal condition for bullish and bearish conditions
plot bullSignal = longMomentumFactoryEntry and longMomentumFactoryEntry [1];
#plot bearSignal = shortMomentumFactoryEntry and shortMomentumFactoryEntry [1];
- Run the scan
If you'd like to see examples of the scan's output, review the video tutorial in which we cycle through charts.
Conclusion
In this tutorial, we did a deep dive into Wilder's Momentum Concept and turned it into a ThinkOrSwim indicator.
The momentum factor is the key output, which helps us understand if the price of a stock is going up or down. It can help us make better trading decisions and improve our risk management.
Some of the main benefits of using the momentum factor are:
- It helps traders identify when there are shifts in momentum
- It makes it easier to ride the ebb and flow of a stock's price
- It is easy to calculate
You can learn more about Wilder's Momentum Concept, in J. Weller's book: New Concept in Technical Trading Systems (1978).
This is a great example of taking decade-old trading concepts, and transforming them into powerful code.
You can download the indicator and scan by clicking the green Download in the sidebar.
Good luck and happy trading!


