
How to Draw Price Channels in ThinkOrSwim
Learn two easy-to-use methods to draw price channels quickly and accurately inside of ThinkOrswim

Drawing Price Channels in ThinkOrSwim
In today's video, we're going to be discussing how to draw price channels in ThinkorSwim.
Specifically, we'll be looking at how to draw price channels using two different tools:
- Trendline tool
- Regression channel tool
We'll also be comparing and contrasting the two methods, to help you decide which one is best for your needs.
Let's begin by looking at how to draw a price channel using the trendline tool.
The Trendline Approach
When drawing a price channel using the trendline tool, the first step is to identify the two points that will define the channel.
- For bullish channels, these points are ideally the two higher low’s, which you can use to define the bullish trend.
- For bearish channels, these points are ideally the two lower high’s, which you can use to define the bearish trend.
Once you have these two points identified, you can then use the trendline tool to draw the channel.

To do this, simply click and drag from the first point to the second point.
You'll then see the trendline appears on the chart.
To turn this trendline into a channel, right click on the trendline, and select “Redraw as channel” to create a channel of two parallel lines.

Price Channel Settings in ThinkOrSwim
There are a few things you can do to customize your price channel in ThinkorSwim.
To access these settings, right click on your channel and select “Edit Channel”.
This will bring up the “Edit Channel” dialogue box.
Here you can change the name of the channel, as well as the color and thickness of the lines.
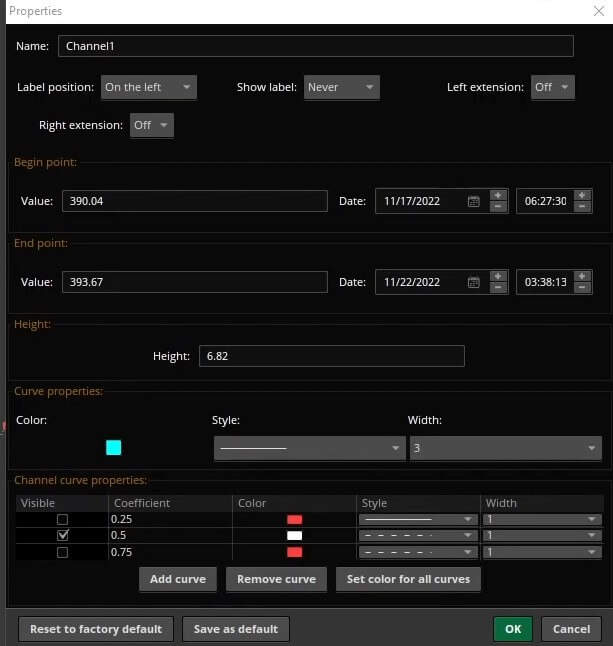
You can also select to always have the lines extend beyond the price action, which can be helpful in identifying potential supply and demand zones.
If you’d like to see a midline always plot on your channel, make sure to turn on the 0.5 coefficient ratio, which will plot a parallel line straight down the middle.
Once you have your final settings saved, go ahead and click “Save as default”, which tells ThinkOrSwim to always draw channels using these custom settings.
The Linear Regression Channel Tool
The linear regression channel tool is a quicker and easier way to draw a price channel in ThinkorSwim. And, it’s mostly automated!
To use this tool, simply click on the drawing tools icon in the top toolbar, and select “Regression Channel”.
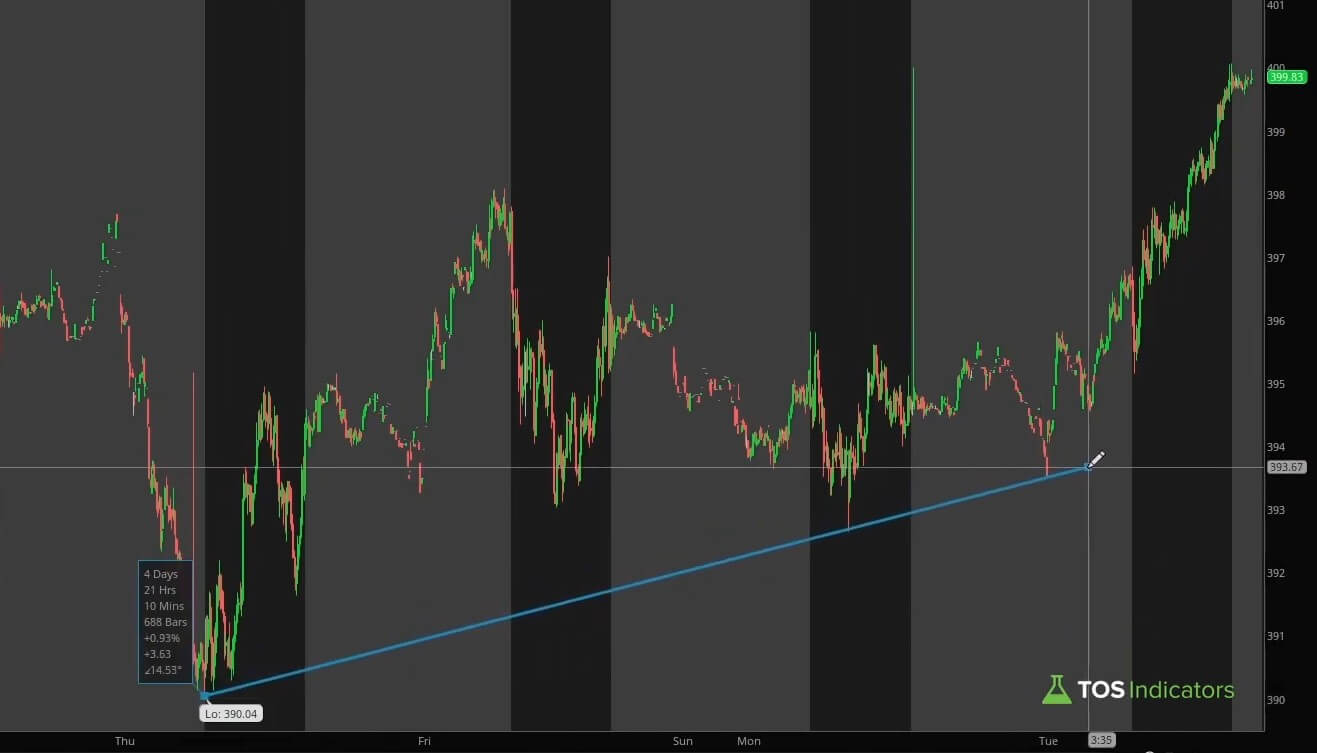
This will bring up the “Regression Channel” drawing tool, which takes two points as its input.
Here you can specify the starting point and the ending point of your channel.
For example, you could start the channel from the most recent swing low, and end it at the most recent swing high on the 5-min chart, which gives us the following regression channel:
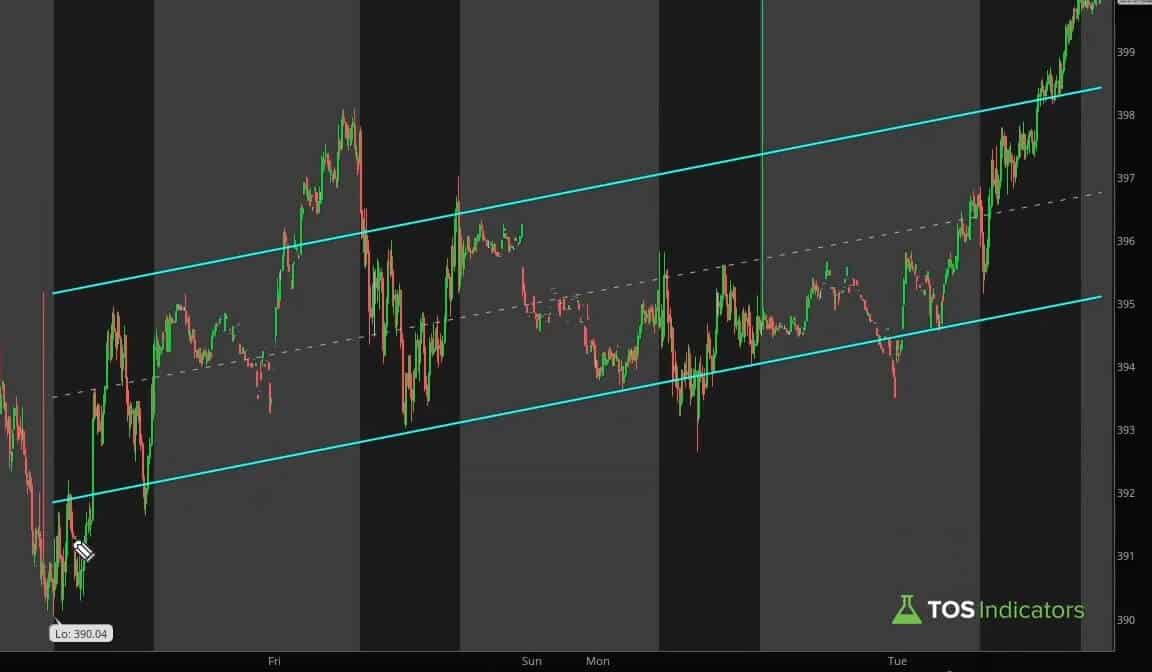
As we increase our time frame, the regression channel becomes more accurate.
Here’s an example of the regression tool on the 1-hour time frame chart of SPY. Compared to the manual, trendline approach, this is pretty dang close!

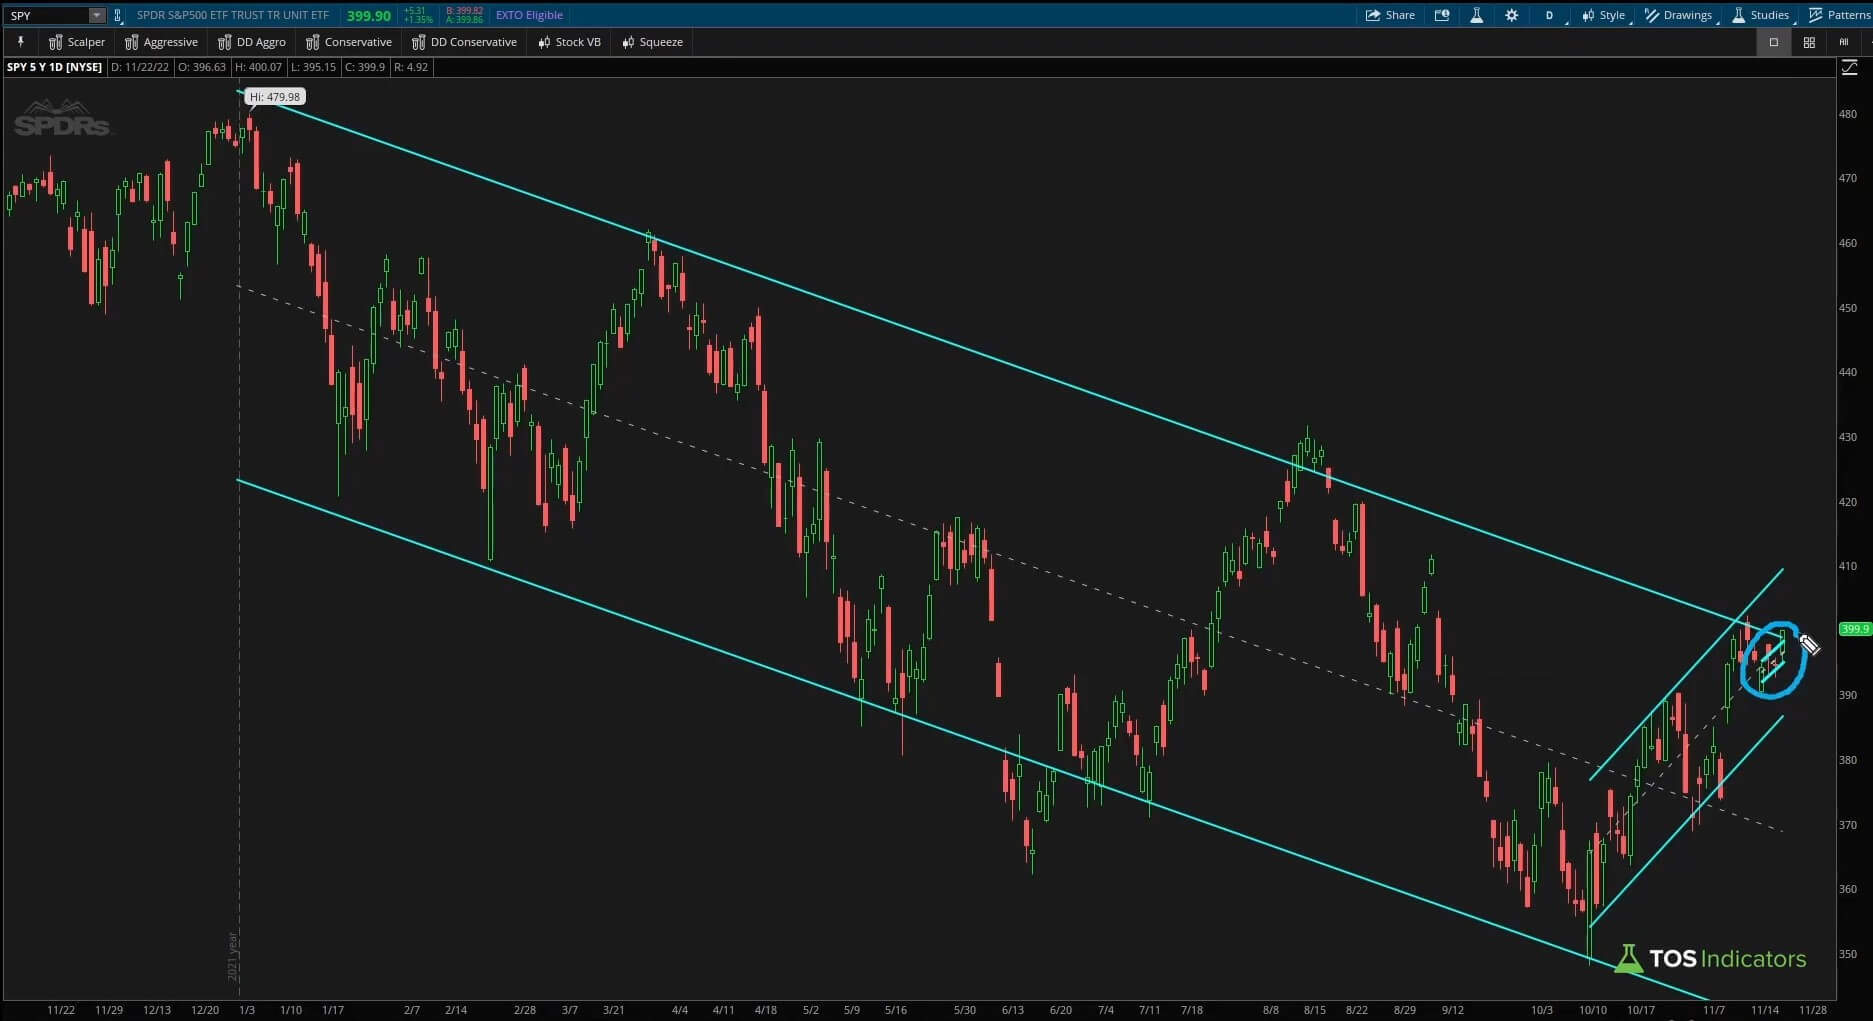
Let’s take a look at the daily time frame chart as well:

The regression channel tool is a great way to quickly get a feel for the direction and strength of the current trend, in one easy go.
Comparing the Two Methods
To help you decide which method is best for you, let’s compare and contrast the two methods of drawing price channels in ThinkorSwim.
First, let’s compare the accuracy. When drawing a price channel using the trendline tool, you have the benefit of precision in your placement of the points.
This isn’t always easy, especially on longer time frame charts where price action can be very choppy. There is a certain level of discretion that is involved.
However, the linear regression channel tool removes this discretion by automatically drawing the channel for you. All you need to do is identify the starting and ending points.
The downside is you give up some of the accuracy; the channel is an approximation of where trend is likely to hover between.
Next, let’s compare the ease of use.
The trendline approach definitely takes more time and effort to draw a channel.
You need to be able to identify the two points that will serve as the foundation for your channel.
With the linear regression channel tool, this is much easier as all you need to do is specify the starting and ending points. The tool does the rest for you.
So, which method is best for you?
It really depends on your needs.
- If you need accuracy, go with the trendline tool.
- If you need ease of use, go with the linear regression channel tool.
Or, you could always use both!
Conclusion
In today's video, we looked at how to draw price channels in ThinkOrSwim.
We looked at two different methods:
- The trendline approach
- The linear regression channel tool
We also compared and contrasted the two methods, to help you decide which one is best for your needs.
Hopefully this video has been helpful. If you have any questions, feel free to leave a comment below.
Happy trading!