
 Fair Value Gap
 False Breakout Scanner
 Heiken Ashi Trend

 Stock Volatility Box
 Futures Volatility Box
 ORB Setups
 Squeeze Setups
On this page
Overview
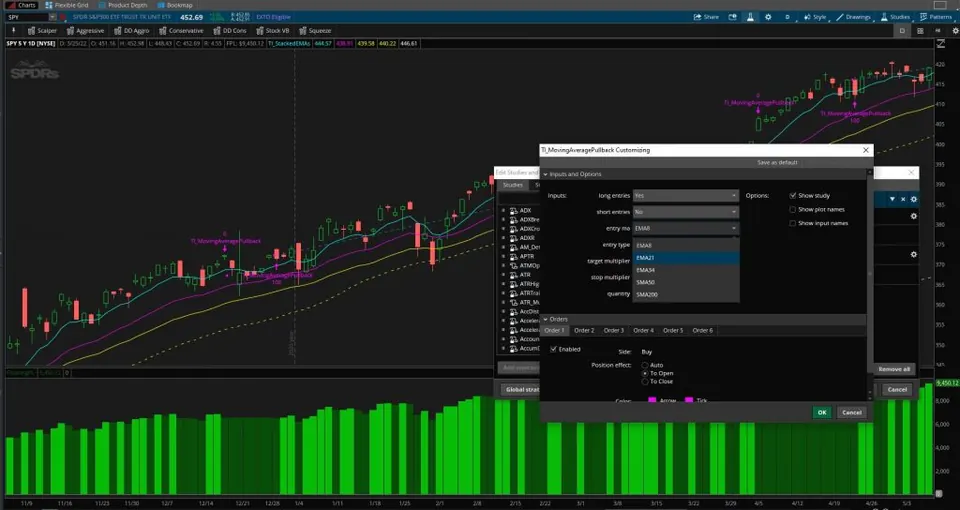
In this tutorial I build a moving average pullback backtester for ThinkOrSwim from scratch. It buys pullbacks into one of 5 moving averages while all 5 are stacked in an uptrend, or shorts rallies into them in a downtrend, and it exits at a target or a stop measured in ATR. The Floating P/L study under the chart shows how each version has done.
The backtester answers three questions: do moving average pullbacks work on a given market, which moving average works best there, and should you wait for a confirmation candle or buy the pullback blindly? The tutorial is beginner-friendly, and every choice is an input, so you can run a new test from the settings window without touching the code.
Key Takeaways
- The moving average pullback backtester is a free ThinkOrSwim strategy that enters on pullbacks to the 8, 21 or 34 EMA or the 50 or 200 SMA, and only while all 5 averages are stacked in order.
- It has 2 entry types. Pullback only buys at the moving average as soon as the low touches it. Confirmation waits for a touch on the current or prior bar and a close above the previous bar's high.
- Exits are a target and a stop set as multiples of the 14-period ATR on the entry bar. The defaults are a 2x ATR target, a 1x ATR stop and 100 shares, with long entries on and short entries off.
- In the video's comparison on SPY (5 years of daily bars, longs only, 3x ATR target, 2x ATR stop), the 8 EMA showed $1,732.10 of P/L buying pullbacks blindly and $6,023.84 with confirmation. The video gives no trade counts.
- In the same SPY test, the 21 EMA, 34 EMA and 50 SMA did better without confirmation. The 34 EMA showed $5,934.91 blind and $4,556.75 confirmed.
What Is a Moving Average Pullback?
A moving average pullback is a dip back to a moving average inside a trend, which traders use as a place to join that trend. In an uptrend, price pulls back down to an average such as the 21 EMA and then moves higher. In a downtrend, price rallies up to the average and turns lower.
The moving average pullback backtester puts that idea to the test with fixed rules. I built it to answer three questions:
- Does buying and selling pullbacks into moving averages work, and does it work better on some markets and timeframes than others?
- If it does, which moving average is the most effective for the market you trade, such as the S&P 500?
- Should you wait for a confirmation pattern, or enter blindly on the first pullback?
The Rules Behind the Backtester
The moving average pullback backtester is built on 5 requirements I set before writing any code, so the result is a repeatable process:
- A trend structure. It only takes pullbacks while the 8, 21 and 34 EMAs and the 50 and 200 SMAs are stacked in order. That filters out a lot of the chop.
- Any market. Stocks, ETFs, futures and forex, anything ThinkOrSwim supports.
- Any timeframe, daily or intraday.
- Longs and shorts, each with its own input, so you test one side at a time and their P/L stays separate.
- Clear entries and exits, with little room for discretion.
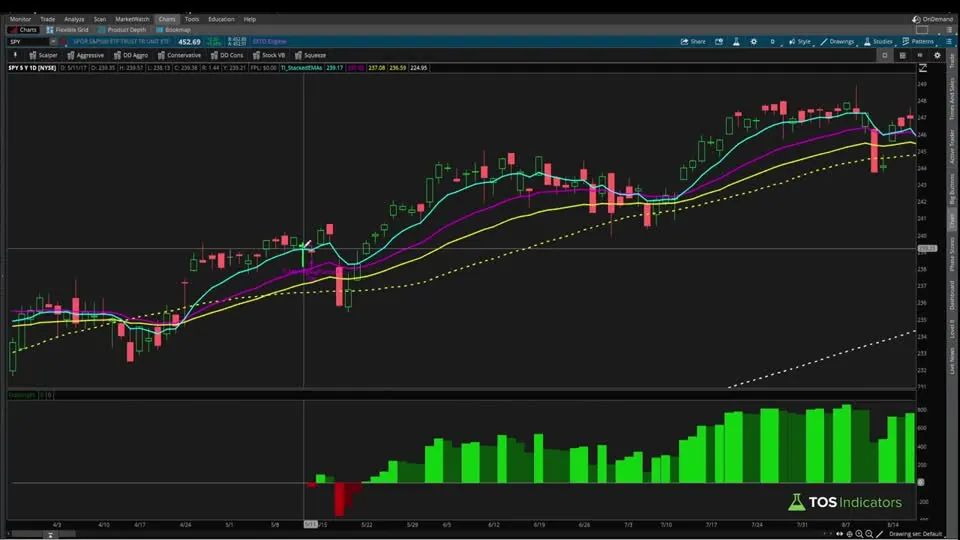
Our free Stacked Moving Averages indicator plots the same 5 averages if you want to see the structure on your chart.
Pullback Only vs Confirmation Entries
The moving average pullback backtester has 2 entry types, picked from the entryType input. Both need the stack in place. They differ in what price has to do at the average and in the price the backtest pays.
| Rule | Pullback only | Confirmation |
|---|---|---|
| Long entry | Bullish stack and the bar's low at or below the chosen average | Bullish stack, the lowest low of the last 2 bars at or below the average, and a close above the previous bar's high |
| Short entry | Bearish stack and the bar's high at or above the average | Bearish stack, the highest high of the last 2 bars at or above the average, and a close below the previous bar's low |
| Entry price | The moving average's value | The close of the signal bar |
Confirmation waits for price to show that buyers have taken control by closing above the previous candle's high. It checks 2 bars because the low that tags the average often comes one bar before the close that confirms it.
Results From the Video: Which Moving Average Pullback Is Best on SPY?
The moving average pullback comparison at the start of the video ran on SPY, the S&P 500 ETF, over 5 years of daily bars. It tested long trades only, with a target of 3 times the ATR from the entry price and a stop of 2 times the ATR.
These are historical results from the video. It shows P/L only: no trade counts, no win rates, and no order size for this test. The strategy's default is 100 shares per order.
| Moving average (SPY, daily, 5 years, longs only, 3x ATR target, 2x ATR stop) | P/L, pullback only | P/L, with confirmation | Trades |
|---|---|---|---|
| 8 EMA | $1,732.10 | $6,023.84 | Not shown |
| 21 EMA | $4,291.46 | $1,551.53 | Not shown |
| 34 EMA | $5,934.91 | $4,556.75 | Not shown |
| 50 SMA | $5,046.69 | $3,034.42 | Not shown |
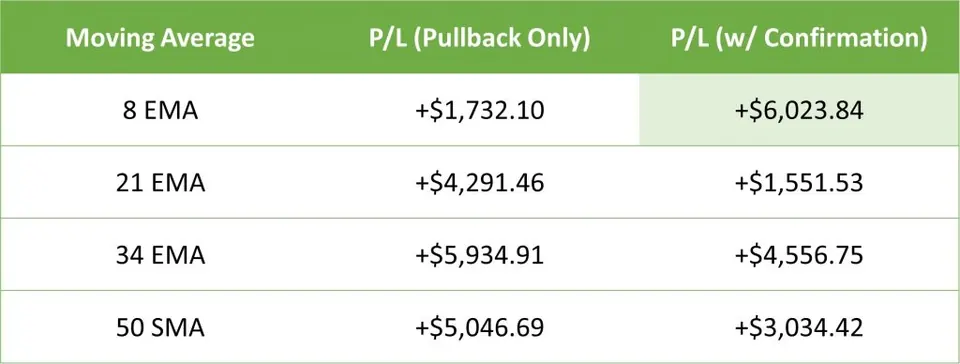
- Confirmation turned the 8 EMA around. Waiting took it from $1,732.10 to $6,023.84, the highest figure in the table. In the video I put that down to the confirmation turning many aggressive, losing entries into winners.
- Deeper pullbacks favored blind entries. On the 21 EMA, 34 EMA and 50 SMA, buying the pullback blindly showed more P/L than waiting.
- The 50 SMA was more efficient. It reached about the same P/L as the 34 EMA with drastically fewer trades, though the video gives neither count. Its confirmed version fell to $3,034.42, most likely because waiting missed a few trades.
How to Create the Backtester in ThinkOrSwim
The moving average pullback backtester is a ThinkOrSwim strategy, so you create it on the Strategies tab, which is what gives you P/L reporting.
- Click the Studies icon on your chart and switch to the Strategies tab.
- Click Global Strategy Settings and check Display Floating P/L study with strategies. That adds a sub panel with the P/L chart.
- Click Create and name the strategy. I called mine moving average pullbacks.
- Replace the starter code with the code from the Code tab on this page, then click OK and Apply.
- Double-click the strategy to pick the moving average, the entry type and the multipliers.
To import the downloaded file instead of pasting, follow our guide on how to import a thinkScript file into ThinkOrSwim.
The Inputs
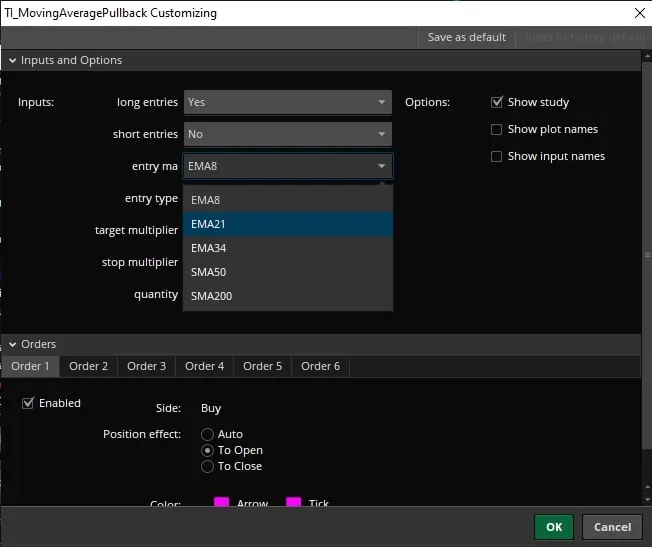
The moving average pullback backtester has 7 inputs in its settings window. The SPY comparison used a 3x target and a 2x stop, so change the two multipliers to repeat it.
| Input | Default | What it controls |
|---|---|---|
longEntries | yes | Buys pullbacks in a bullish stack |
shortEntries | no | Shorts pullbacks in a bearish stack |
entryMA | EMA8 | The average for the pullback: EMA8, EMA21, EMA34, SMA50 or SMA200 |
entryType | pullbackOnly | Enter blindly at the average, or wait for Confirmation |
targetMultiplier | 2 | Target distance from the entry price, in ATRs |
stopMultiplier | 1 | Stop distance from the entry price, in ATRs |
quantity | 100 | Shares per order |
How the Code Works
The moving average pullback backtester code has 6 parts: the inputs, the stack, two switches, the stored ATR and the orders. The snippets come from the downloaded file.
Step 1: Text Choices for the Inputs
This step’s code is free with an account. Create one or sign in.
Curly brackets turn an input into a dropdown of text choices. I could have used a number, but picking EMA21 from a list is more intuitive.
Step 2: The Stack
Five def lines build the averages with ExpAverage(close, 8), 21 and 34, and SimpleMovingAvg(close, 50) and 200. Then the bullish stack needs each one above the next slower one:
This step’s code is free with an account. Create one or sign in.
The bearish stack is the same line with every sign flipped to less than.
Step 3: Connect the Dropdown With a Switch
This step’s code is free with an account. Create one or sign in.
Each text choice becomes a case that sets entryPullbackMA, the one variable the rest of the code uses.
The strategy wouldn't compile at this point, so in the video I added a temporary AddOrder line to check the dropdown, then replaced it later. I also note that SMA200 triggers very few times: by the time price pulls back that far, it has usually broken the stack.
Step 4: Entry Signals and Entry Prices
A second switch sets 4 variables for each entry type: a true or false entry signal for each side, and the entry price the P/L is measured from.
This step’s code is free with an account. Create one or sign in.
Pullback only buys the average itself, at its value.
This step’s code is free with an account. Create one or sign in.
Confirmation enters at the close of the bar that confirms the move.
Step 5: Store the ATR on the Entry Bar
Average true range (ATR) measures how far a market typically moves in one bar, averaged over a set number of bars. The backtester sizes its target and stop with it.
This step’s code is free with an account. Create one or sign in.
Put ATR() straight into the exits and the target and stop would move with every candle. This line saves the 14-period ATR on the first bar of a new signal and carries it forward until the next new signal.
Step 6: The Long Orders
The code passes AddOrder 4 parameters: the order type, the condition that has to be true, the price, and the quantity. ThinkOrSwim offers 6 order types: BUY_AUTO, BUY_TO_CLOSE, BUY_TO_OPEN, SELL_AUTO, SELL_TO_CLOSE and SELL_TO_OPEN.
This step’s code is free with an account. Create one or sign in.
The first order buys when longEntries is yes and the bullish signal is true. EntryPrice() returns the price of the open position, so the target and stop exits fill a fixed number of ATRs above and below it.
Step 7: The Short Side
This step’s code is free with an account. Create one or sign in.
Every piece is reversed: the target below the entry, the stop above.
More Tests From the Video
After building the moving average pullback backtester, I changed one setting at a time on SPY, Verizon (VZ) and Home Depot (HD). These are historical results from the video, which never shows a trade count. At the end I describe the tests as going back 5 years, but the chart isn't restated for each run.
| Symbol and side | Average and entry type | Target / stop | P/L shown | Trades | Chart and period |
|---|---|---|---|---|---|
| SPY, longs | 8 EMA, pullback only | 2x / 1x ATR | $3,646 | Not shown | Same SPY chart, not restated |
| SPY, longs | 8 EMA, pullback only | 5x / 3x ATR | $6,579 | Not shown | Same SPY chart, not restated |
| SPY, longs | 34 EMA, pullback only | 5x / 3x ATR | $6,104 | Not shown | Same SPY chart, not restated |
| SPY, shorts | 34 EMA, confirmation, then pullback only | 5x / 3x ATR | Confirmation: no trades met all the criteria. Pullback only: poor, no figure read out. | Confirmation: none. Pullback only: not shown. | Same SPY chart, not restated |
| VZ, longs | 8 EMA, both entry types | 3x / 2x, then 2x / 1x and 2x / 2x ATR | Poor. Confirmation and smaller multipliers didn't help. No figures read out. | Not shown | Not restated |
| HD, longs | 8 EMA, confirmation | 2x / 2x ATR | $919 | Not shown | Not restated |
| HD, longs | 8 EMA, pullback only | 2x / 2x ATR | $5,214 | Not shown | Not restated |
| HD, longs | 21 EMA | 2x / 2x ATR | Much lower than $5,214. No figure read out. | Not shown | Not restated |
Widening SPY's 8 EMA target and stop from 2x and 1x to 5x and 3x raised the P/L from $3,646 to $6,579. The P/L chart also showed much less red at the start, which suggests the wider stop kept trades open longer.
Verizon is the counterexample: the pullbacks that tested well on SPY didn't work there. On Home Depot, the confirmation that helped SPY's 8 EMA cut the P/L from $5,214 to $919. The best pullback depends on the market, which is why you test each one.
How I Use the Moving Average Pullback Backtester
The moving average pullback backtester answers questions before any capital goes in. I prefer testing longs only: I find the data better, and most traders are long-focused.
- Does the pullback work here at all? Start with the 8 EMA and pullback only, and note the P/L as your baseline.
- Which average, blind or confirmed? Change
entryMAandentryTypeone at a time. On SPY the answer changed with the depth of the pullback. - How much room does the trade need? Change the multipliers to see whether it pays to let trades run or take profits sooner.
- Does it hold elsewhere? Load 10 years of data, or a 5-minute chart, and run the same settings.
A result here shows how a pullback rule behaved on one chart in the past. Decide your stop before the trade, which the stop multiplier gives you, and size the position so a stop-out costs a small, fixed share of your account.
Common Problems and How to Fix Them
The moving average pullback backtester has a few behaviors that trip people up.
- The entry tag is one bar late. The pink entry always plots on the candle after the signal. That's how ThinkOrSwim draws it, and the strategy's Show Report lists the right price.
- No P/L panel. Turn on the Floating P/L study in Global Strategy Settings.
- No trades. Check that
longEntriesorshortEntriesis yes, and that the stack is in place. In the video, SPY shorts on the 34 EMA with confirmation took no trades. - Gap fills in pullback only mode. The code checks only that the low reached the average, then uses the average's value as the entry price. If a bar gaps down and trades entirely below the average, that is a price the bar never traded. Confirmation entries use the close, so they don't have this issue.
- The target or stop moved during a trade. The stored ATR updates on every new entry signal, even one that appears while a trade is open. In pullback only mode, a second touch of the average mid-trade resets the ATR, and the exits move with it.
Ways to Extend the Backtester
The moving average pullback backtester is a starting point. At the end of the video I suggest adding your own moving averages as extra entryMA choices, adding labels (see our AddLabel tutorial), and plotting the ATR value, so you know the exact target and stop prices when a trade sets up.
To test crossovers instead of pullbacks, use our moving average crossover backtester. To find stocks that are already stacked, run our stacked moving average scans.
Our research asks which moving average pullback is best for trend days and which is best on a 5-minute QQQ chart. More strategies are on our ThinkOrSwim backtesters page.
The backtester on real data
Drawn from real daily bars with the code on this page, through Oct 20, 2026. Longs only, 100 shares, one position at a time. The entry fills at the price the code names: the moving average itself for pullback only, the close for confirmation. The target and stop are multiples of the 14-period ATR on the signal bar. I check exits from the bar after the entry, and when one bar touches both the target and the stop I count the stop.
SPY, 21 EMA, the default settings
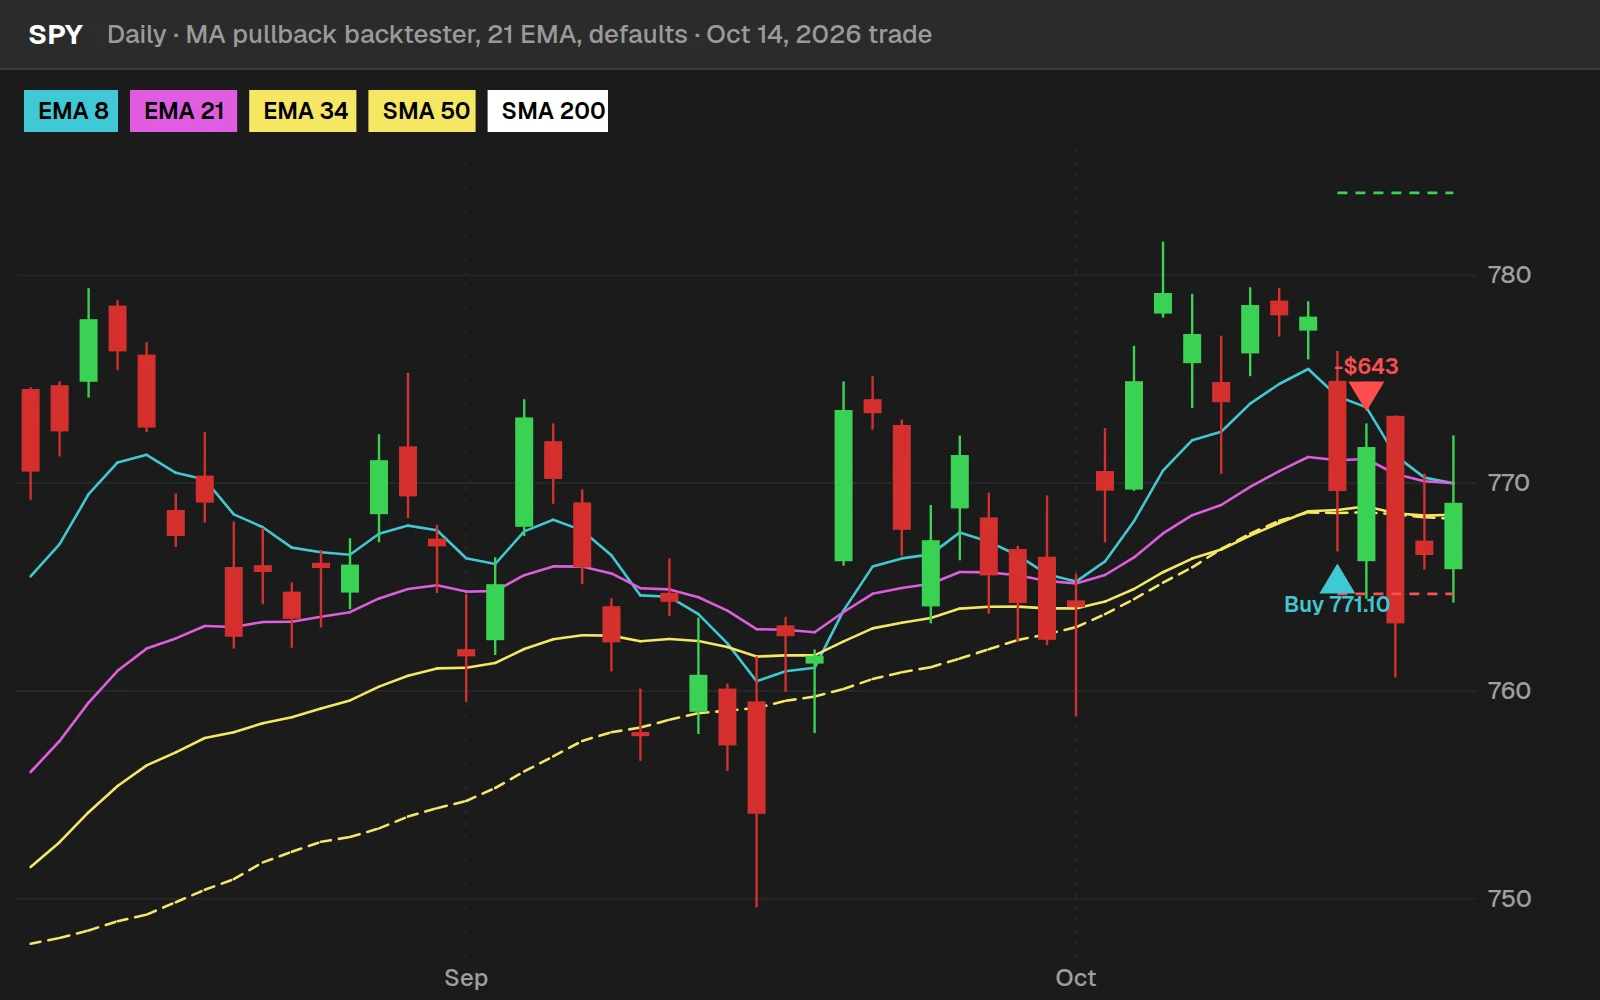
That trade hit its stop on Oct 15, 2026, 1 trading day later: -$643 on 100 shares. Since 2016 the default 21 EMA settings took 101 SPY trades, won 38% of them and made $30 in total.
The video's test, on the last five years
The video compared four moving averages on 5 years of daily SPY bars, longs only, with a 3x ATR target and a 2x ATR stop. Here is the same test on Oct 20, 2021 to Oct 20, 2026.
| SPY, 3x ATR target, 2x ATR stop | Pullback only | Confirmation |
|---|---|---|
| EMA 8 | $6,27238 trades, 47% won | $81233 trades, 45% won |
| EMA 21 | $1,66925 trades, 44% won | -$2,87520 trades, 40% won |
| EMA 34 | $8,02621 trades, 52% won | -$5,97716 trades, 31% won |
| SMA 50 | $1,42210 trades, 40% won | -$4,5196 trades, 17% won |
100 shares a trade, closed trades only. Buying 100 shares and holding them over the same five years made $31,664; the best cell here, EMA 34 with pullback only, made $8,026 while spending most days out of the market. The video's window ended in 2022, so its numbers differ from these.
Full thinkScript code
Create a free account or sign in to copy all 68 lines and download the file.
Download
Download the Moving Average Pullback Backtester for ThinkOrSwim. The download is a .zip with one strategy file, TI_MovingAveragePullbacksSTRATEGY.ts, the same code as the Code tab on this page. Import it as a strategy, then double-click it to choose the moving average, the entry type, the target and stop multipliers, the direction and the quantity. If you haven't imported a file before, here's how to import into your ThinkOrSwim platform.
Video: Moving Average Pullback Backtester, built line by line
36 minutes on YouTube.
 Watch on YouTube
Questions
What is a moving average pullback?
A moving average pullback is a dip back to a moving average inside a trend, such as a pullback to the 21 EMA in an uptrend before price moves higher. The backtester only counts pullbacks while the 8, 21 and 34 EMAs and the 50 and 200 SMAs are stacked in order, so the market is already trending.
How do I backtest moving average pullbacks in ThinkOrSwim?
Create the backtester as a strategy. Click the Studies icon, switch to the Strategies tab, turn on the Floating P/L study in Global Strategy Settings, then click Create and paste in the code. Double-click the strategy to pick the moving average, the entry type and the target and stop multipliers.
Which moving average pullback did best on SPY in the video?
On SPY over 5 years of daily bars, longs only, with a 3x ATR target and 2x ATR stop, the 8 EMA with confirmation showed the highest P/L, $6,023.84. Buying the 34 EMA pullback blindly came next at $5,934.91. These are historical results from the video, which gives no trade counts.
Is it better to wait for confirmation or buy a moving average pullback blindly?
In the video it depended on the average. On SPY, confirmation raised the 8 EMA from $1,732.10 to $6,023.84, but blind entries did better on the 21 EMA, 34 EMA and 50 SMA. On Home Depot, confirmation cut the 8 EMA from $5,214 to $919. Test both entry types on the market you trade.
How does the backtester set its target and stop?
It stores the 14-period ATR on the bar where a new entry signal appears and keeps that value until the next new signal. The target is the entry price plus the target multiplier times that ATR, and the stop is the entry price minus the stop multiplier times it. The defaults are 2 and 1, and the SPY comparison used 3 and 2.
Why does the entry arrow show up one bar after the signal?
ThinkOrSwim plots strategy orders on the candle after the signal bar. The price is still correct: in the video I checked the Show Report, and the entry price matched the close of the signal bar for a confirmation entry. Read the report for exact prices instead of the position of the tag.
Why does the 200 SMA pullback rarely take a trade?
The backtester only trades when all 5 averages are stacked, with the 200 SMA at the bottom in an uptrend. By the time price pulls back as far as the 200 SMA, it has usually broken that stacked structure, so all the entry conditions are rarely true at the same time.
Can I use the moving average pullback backtester on any market or timeframe?
Yes. It was built to run on stocks, ETFs, futures and forex, on any timeframe, for longs and shorts. In the video I tested SPY, Verizon and Home Depot, and mentioned 10 years of data or a 5-minute chart as other options. Results changed a lot from one market to the next.
Related tools
 Stacked Moving Averages
 Moving Average Clouds
 Multiple Time Frame Moving Averages
 Reversion to 50-Day Moving Average
 Moving Average Crossover Backtester
 SPY Meltdown Backtester
Get each new indicator by email
One email on Sundays with the week's new tool and its code. A free account also unlocks every .txt download.
No credit card. Unsubscribe anytime.