
Latest Research
Explore data-driven trade patterns, research, setups, and tools
cATEGORIES
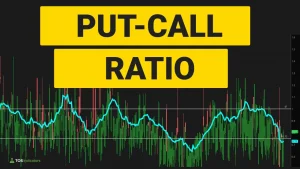
The Put/Call Ratio Explained: A Contrarian Trading Signal
The Put-Call Ratio ($PCALL) dipped below a key threshold, giving us our first warning signal. Let’s study what has happened in the past 10 years, when the $PCALL ratio has fallen below this key level.
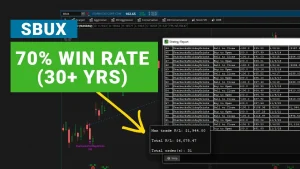
The Hidden Starbucks Holiday Setup
This setup has been a 70% winner over the past 30 years inside of Starbucks, and triggers only during the holiday period.
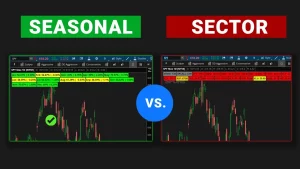
Will S&P 500’s November Seasonality Kick In?
Combine seasonal and sector analysis to create a game plan around how to trade the S&P 500 into the end of the year.
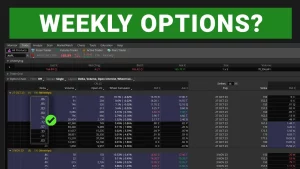
Are Shorter Dated Options Better for Day Trading?
A data-driven comparison between 6 different options, to study pricing and understand how pricing fluctuates between different deltas and expiration cycles.
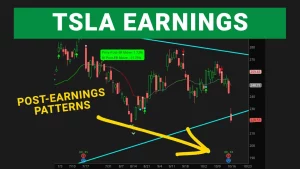
Will TSLA Follow its 7-Day Post-Earnings Pattern?
Let’s break down TSLA’s unique post-earnings patterns 7, 14, and 30 days after reporting earnings.
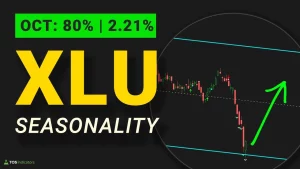
Why You Should Pay Attention to XLU in October
October has consistently been a strong month for the Utilities sector (XLU). In today’s video, we’ll study the seasonal patterns in XLU going back 20 years, and how to take advantage of them this October.
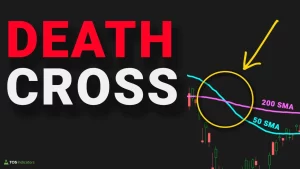
Death Cross vs. Golden Cross Entry
Does the Death Cross actually outperform the Golden Cross for long entries in the S&P 500? Let’s backtest and find out!
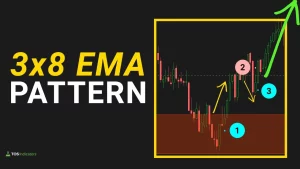
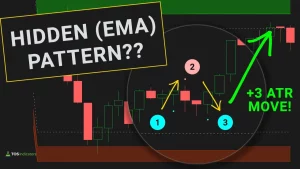
3×8 EMA Pattern to Catch Reversals (With Examples)
Two examples of an easy-to-follow EMA pattern using, to pinpoint momentum entries on any time frame.
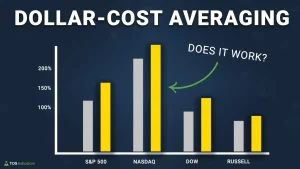
Is There a Better Way to Dollar-Cost Average?
Does adding a simple twist to the classic Dollar-Cost Average strategy help improve your returns? That’s the question we’ll answer in this video, by comparing and contrasting different DCA strategies and each one’s returns.
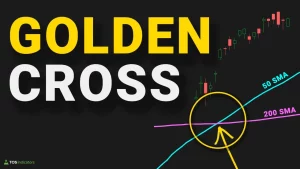
Golden Cross Trading Strategy: 20-Year Backtest on the S&P 500
Analyze and review the Golden Cross trading strategy’s performance over the past 20 years. We’ll look at both the Golden Cross and Death Cross signals on the S&P 500, going back to 2003.
One-Two Punch Momentum Pattern
An easy-to-follow pattern using two exponential moving averages (EMAs), to pinpoint momentum entries on any time frame.
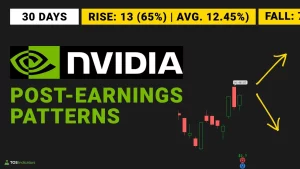
Will Nvidia Follow Its Post-Earnings Pattern This Time?
Nvidia (NVDA) reported strong earnings after the close, and price is currently trading near the $500 psychological level. What do we expect to happen to NVDA stock’s price in the next 7 days, 14 days, 30 days and 60 days?
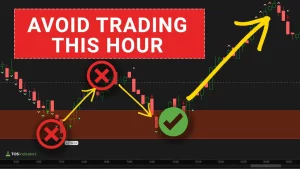
Why I Avoid Day Trading During This Hour
There’s one hour I avoid day trading every day — it usually leads to choppy price action, with stop-runs and fake-outs. In today’s video, I’ll walk you through how to use this hour to instead prepare and find new trade setups that you can take leverage.
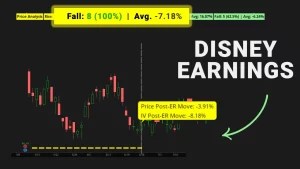
DIS Post-Earnings Performance
We’ll explore a post-earnings pattern in DIS that has been working for the previous 8 earnings cycles. Will it work for a 9th in a row?
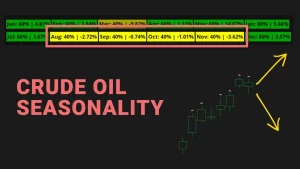
Seasonal Crude Oil Pattern
Explore the seasonal pattern of Crude Oil, and the unique 4 month stretch when Crude Oil tends to exhibit signs of weakness. We’ll use this weakness to craft a trade setup that aligns with our longer term bias.