Add Label Function
Learn how to create your own labels inside of ThinkOrSwim, using a few lines of code.

Introduction
In today's video, I'm going to show you how you can very easily create your own set of labels inside of ThinkOrSwim.
Here's an example of some of the labels we will create in today's tutorial:
The structure I've established for this lesson is divided into two parts: the easy set of labels, which I've dubbed the static labels, and then we'll go on to the dynamic ones.
The goal of this tutorial is to teach you how to code in thinkScript by writing some actual code, instead of keeping it theoretical. I've included six diverse examples that get progressively more difficult as we go through this lesson, but if you keep up, I think you'll have a firm handle on labels and have a solid working knowledge to then make your own set of labels for anything you're viewing.
For our static labels, we'll create three sets of three distinct examples in about five minutes. This is the easier, more straightforward portion of today's tutorial.
Now when I say static, static really implies that we're plotting just indicator values. We're not performing any calculations ourselves inside of the code. All we're doing is trying to output a value that we already have; just as a label instead of as an indicator.
The 3 different examples that we'll build here are:
- 8 period Exponential Moving Average
- Volume
- Chaikin Money Flow
The main goal of this section is to teach you how to combine and compare different signs so that you may plot their values. It should take no longer than five minutes, maybe even less. It's quite simple.
The second part of the tutorial is where things begin to get more exciting, which are building dynamic labels. Inside of the dynamic labels, you can plot results of boolean variables, calculations, statistics, etc. that are created inside of the code.
We're now going to want to extract those values so the first step is to actually perform the calculations and then attach that data to the label.
The 3 different examples that we'll build here are:
- Stacked Moving Averages (Bullish & Bearish)
- Counter Variables Outputted as Labels
- Connecting User Input to Label Output
We've already created the Stacked Moving Average label before, but hopefully this provides you with a clear example on how to do it. We'll utilize the 8, 21 and 34 Exponential Moving Averages (EMAs), for example, in an attempt to determine whether they are stacked or not.
This is similar to the labels we created in our Moving Average Crossover backtester tutorial, along with our Squeeze Course indicators. This should be straightforward and even familiar to those of you who have been watching these lessons for a while.
Let's get started by writing some labels. The simplest ones to start with are the static labels, and then we'll go on to the dynamic ones.
Volatility Box Invite
We are TOS Indicators.com, home of the Volatility Box.
The Volatility Box is our secret tool, to help us consistently profit from the market place. We’re a small team, and we spend hours every day, after the market close, doing nothing but studying thousands of data points to keep improving and perfecting the Volatility Box price ranges.
We have two different Volatility Boxes - a Futures Volatility Box and a Stock Volatility Box.
Futures Volatility Box - Trade Major Markets With an Edge
Designed For: Futures, Micro-Futures and Index Market Traders
Supported Models: Hourly Volatility Box models
Supported Markets: 10 Major Futures Markets
The Futures Volatility Box comes with:
- 5 Volatility Models for each market
- Support for 10 Futures Markets (/ES, /NQ, /YM, /RTY, /CL, /GC, /SI, /ZB, /HG, /NG)
- Video Setup Guide
- Trade Plan
- Access to all members-only resources, including Squeeze Course
Learn More About the Futures Volatility Box
Trade futures and micro futures with a consistent volatility edge
Stock Volatility Box - Powerful Web Based Volatility Platform
Designed For: Stock and Options Traders
Supported Models: Hourly and Daily Volatility Box models
Supported Markets: 10,000+ Stocks and ETFs (new markets added frequently)
A Stock Volatility Box membership includes access to:
- Live Scanner - A powerful scanner we've built from scratch, to scan 10,000 symbols every 2 seconds for new volatility breaches
- Dashboard - A quick and easy way to view daily volatility model levels online
- Short Interest Scanner - Short interest, Squeeze, and EMA data to find short squeezes
- Squeeze Course - All of our proprietary squeeze tools, including robust backtesters
- All Members Only Indicators - We don't nickel and dime you. Everything really is included.
- And much more!
Learn More About the Stock Volatility Box
Trade stocks and options with a consistent volatility edge
ThinkOrSwim Labels Part 1: Static Labels
Let's get started by opening our thinkScript editor in ThinkOrSwim, and start writing some code.
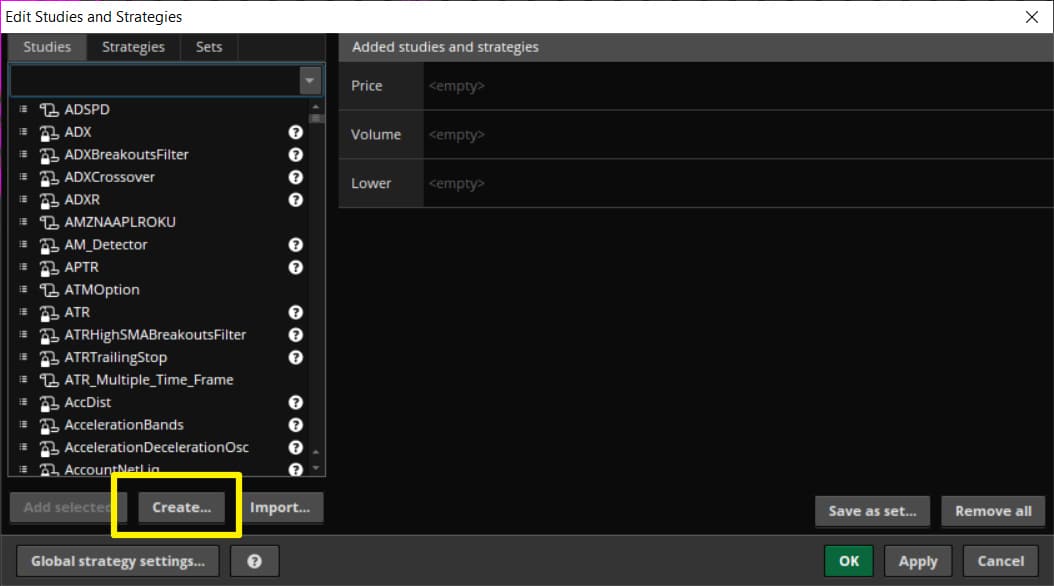
To create your first study, you can click the studies icon, and then click "Create" to open up a blank slate.
Let's take a look at the AddLabel function before we write any code. If you don't see it yet, open the reference window in the top right corner. Open up the functions tab and then, inside of the functions tab, look for Look and Feel.
The AddLabel function takes three different parameters:
- The first parameter is a boolean variable that determines when you want this label to plot
- The second parameter is the text you'd like to plot inside of the label - this can be text, integers, EMAs, or even a dynamic condition
- The third parameter is the background color that you'd like for your label
One key thing to note is that all 3 of these parameters can be either a static value (ie. always yellow, as an example), or can be smarter, with if/else statements, allowing you to incorporate logic into your labels.
You'll see how this comes into play in the dynamic label section of this tutorial.
Example 1: Plotting the 8-Period Exponential Moving Average inside of a label
Let's can start by defining the 8-EMA:
def EMA8 = ExpAverage(close, 8);
This is a typical method of creating an ema, and you'll now notice the first error that ThinkOrSwim gives you: at least one plot should be specified.
Note: An AddLabel is considered to be a "plot" variable, and will eliminate this error.
Now we can bring together our EMA8 variable inside of the AddLabel code, in order to create a label that outputs the value of the 8-period exponential moving average.
AddLabel(yes, EMA8, color.yellow);
If we compare the label's output with the normal EMA line, you'll see that the two line up, as we would expect.
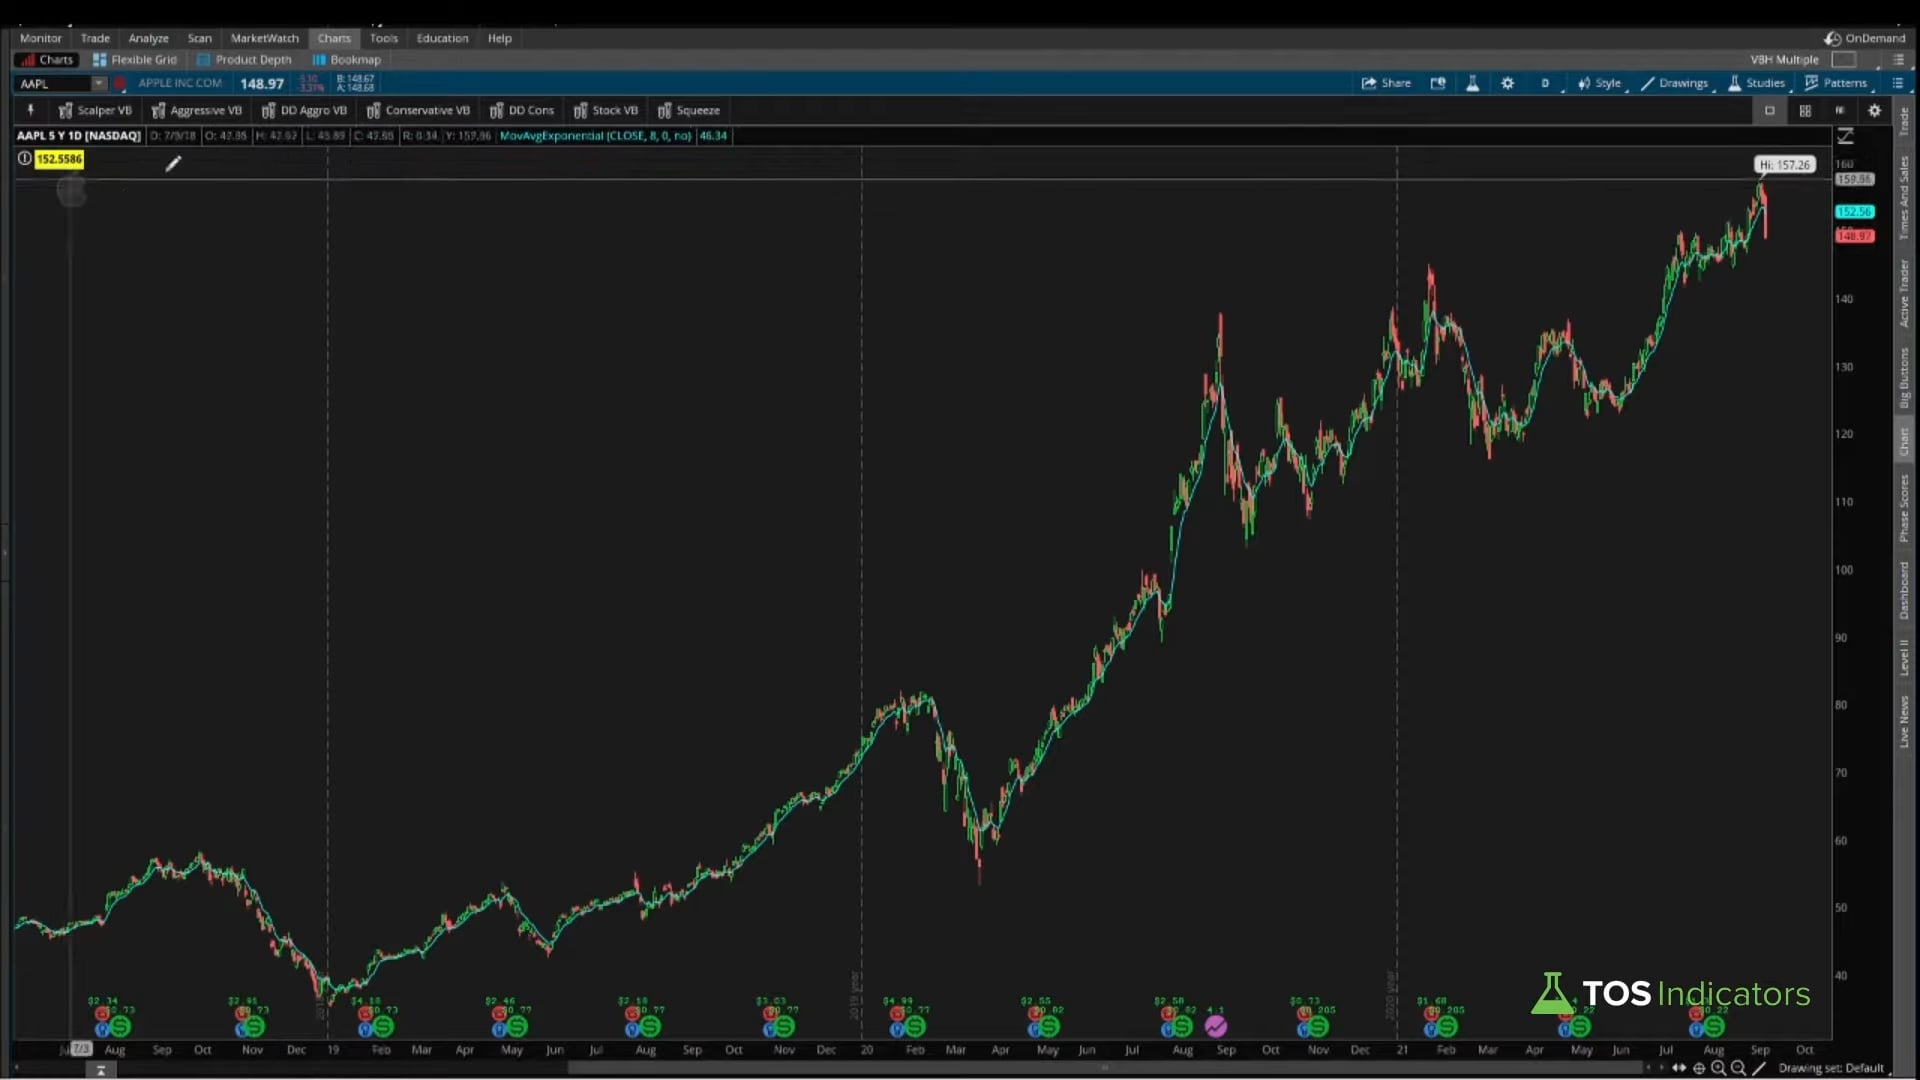
And just like that, we have written our very first label.
Now let's move to our second example.
Example 2: Plotting the Volume inside of a label
The second label we will create is around volume, so picture how you might go about doing this. You would simply change the EMA to volume instead of defining it as a separate function.
AddLabel(yes, volume, color.yellow);
By default, anything that references volume will be placed in the volume channel, which you can manually shift up in your studies pane, to plot the label on your charts.
Example 3: Plotting the Chaikin Money Flow inside of a label
Before creating the Chaikin Money Flow label, it's helpful to review the indicator, along with the built-in plots that ThinkOrSwim provides.
There are 2 plots inside of the Chaikin Money Flow indicator, and the "CMF" value is the one we (and most folks care about). Using that plot variable, we can output the label, referencing the CMF as the number we'd like to see in our label:
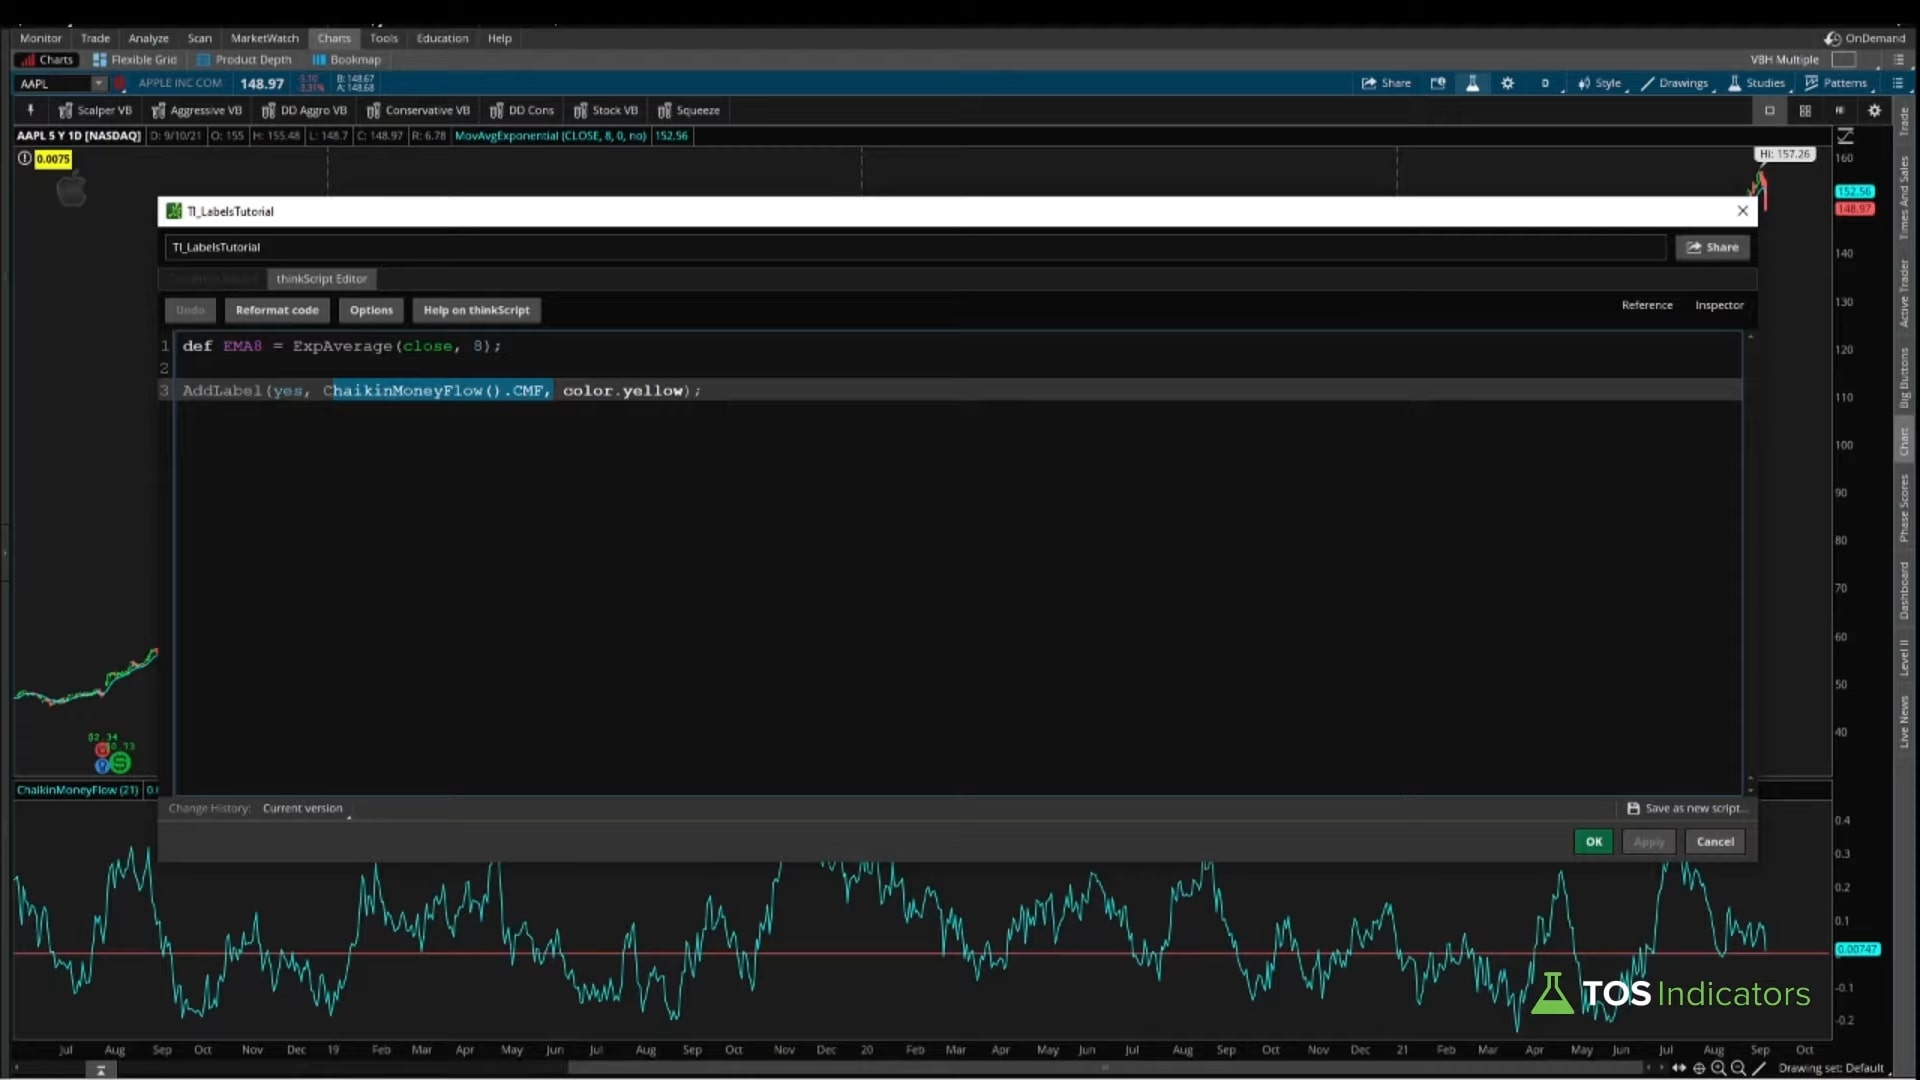
AddLabel(yes, ChaikinMoneyFlow().CMF, color.yellow);
Now as soon as we do that and I click apply, the label changes. The label is now 0.007, and if we compare it to the Chaikin Money Flow indicator's value, you'll see the two values line up.
To summarize, the AddLabel function has three distinct inputs. The first parameter is when you want this variable plotted; the second is what you want plotted; and the third is what color would you want the background to be.
Now let's move on to a bit more of the challenging the more interesting type of labels which are the dynamic ones.
ThinkOrSwim Labels Part 2: Dynamic Labels
Example 1: Plotting Stacked Moving Averages inside of a label
Let's start with the clean slate here.
The first thing we'll want to do is establish a dynamic label for our stacked moving averages, and to do so, we need to define the EMAs that we wish to measure, along with checking if they're stacked bullishly or bearishly (or neither).
Let's start with defining our exponential moving averages:
def EMA8 = ExpAverage(close,8);
def EMA21 = ExpAverage(close,21);
def EMA34 = ExpAverage(close,34);
We now need our next set of variables, which will tell us if they're stacked bullishly or bearishly.
def bullishStacked = EMA8 > EMA21 and EMA21 > EMA34;
def bearishStacked = EMA8 < EMA21 and EMA21 < EMA34;
We now need to set up our plot variable, which will be the AddLabel, so let's get started.
When do we want this label to appear?
Since we'd always want to check if it's true or not, I'll keep using yes as the default, but you can change that, if you're looking to have a conditional label in ThinkOrSwim.
This next parameter will be a little different (read: more sophisticated) from what we have done before.
- If the EMAs are stacked bullishly, we want the text "Bullish" to appear on our label
- If the EMAs are stacked bearishly, we want the text "Bearish" to appear on our label
We could start with something simple like having the label always be yellow, but I believe it would be a lot more interesting if the color changed depending on whether we were bullish or bearish for our third parameter.
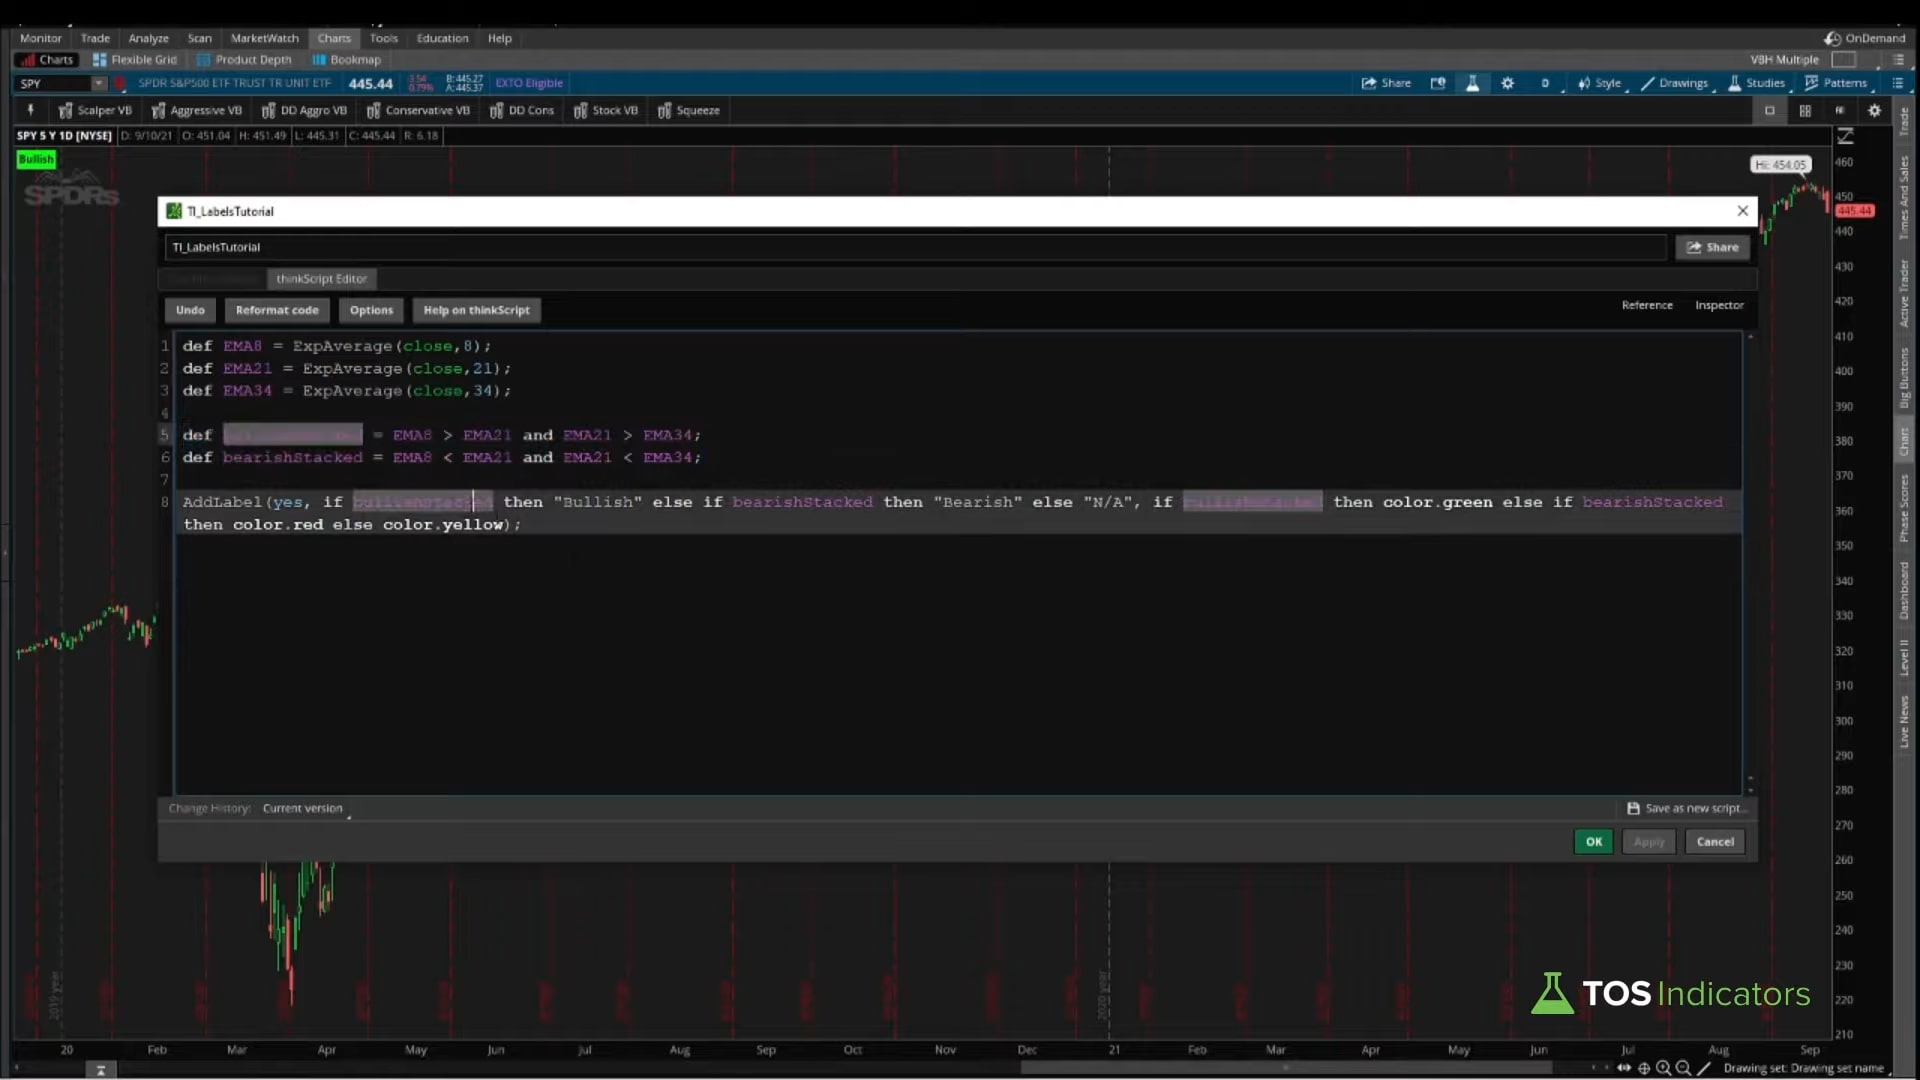
AddLabel(yes, if bullishStacked then "Bullish" else if bearishStacked then "Bearish" else "N/A", if bullishStacked then color.green else if bearishStacked then color.red else color.yellow);
Now as soon as I do that and click apply, we get a label like this, on a bullish chart (AAPL):
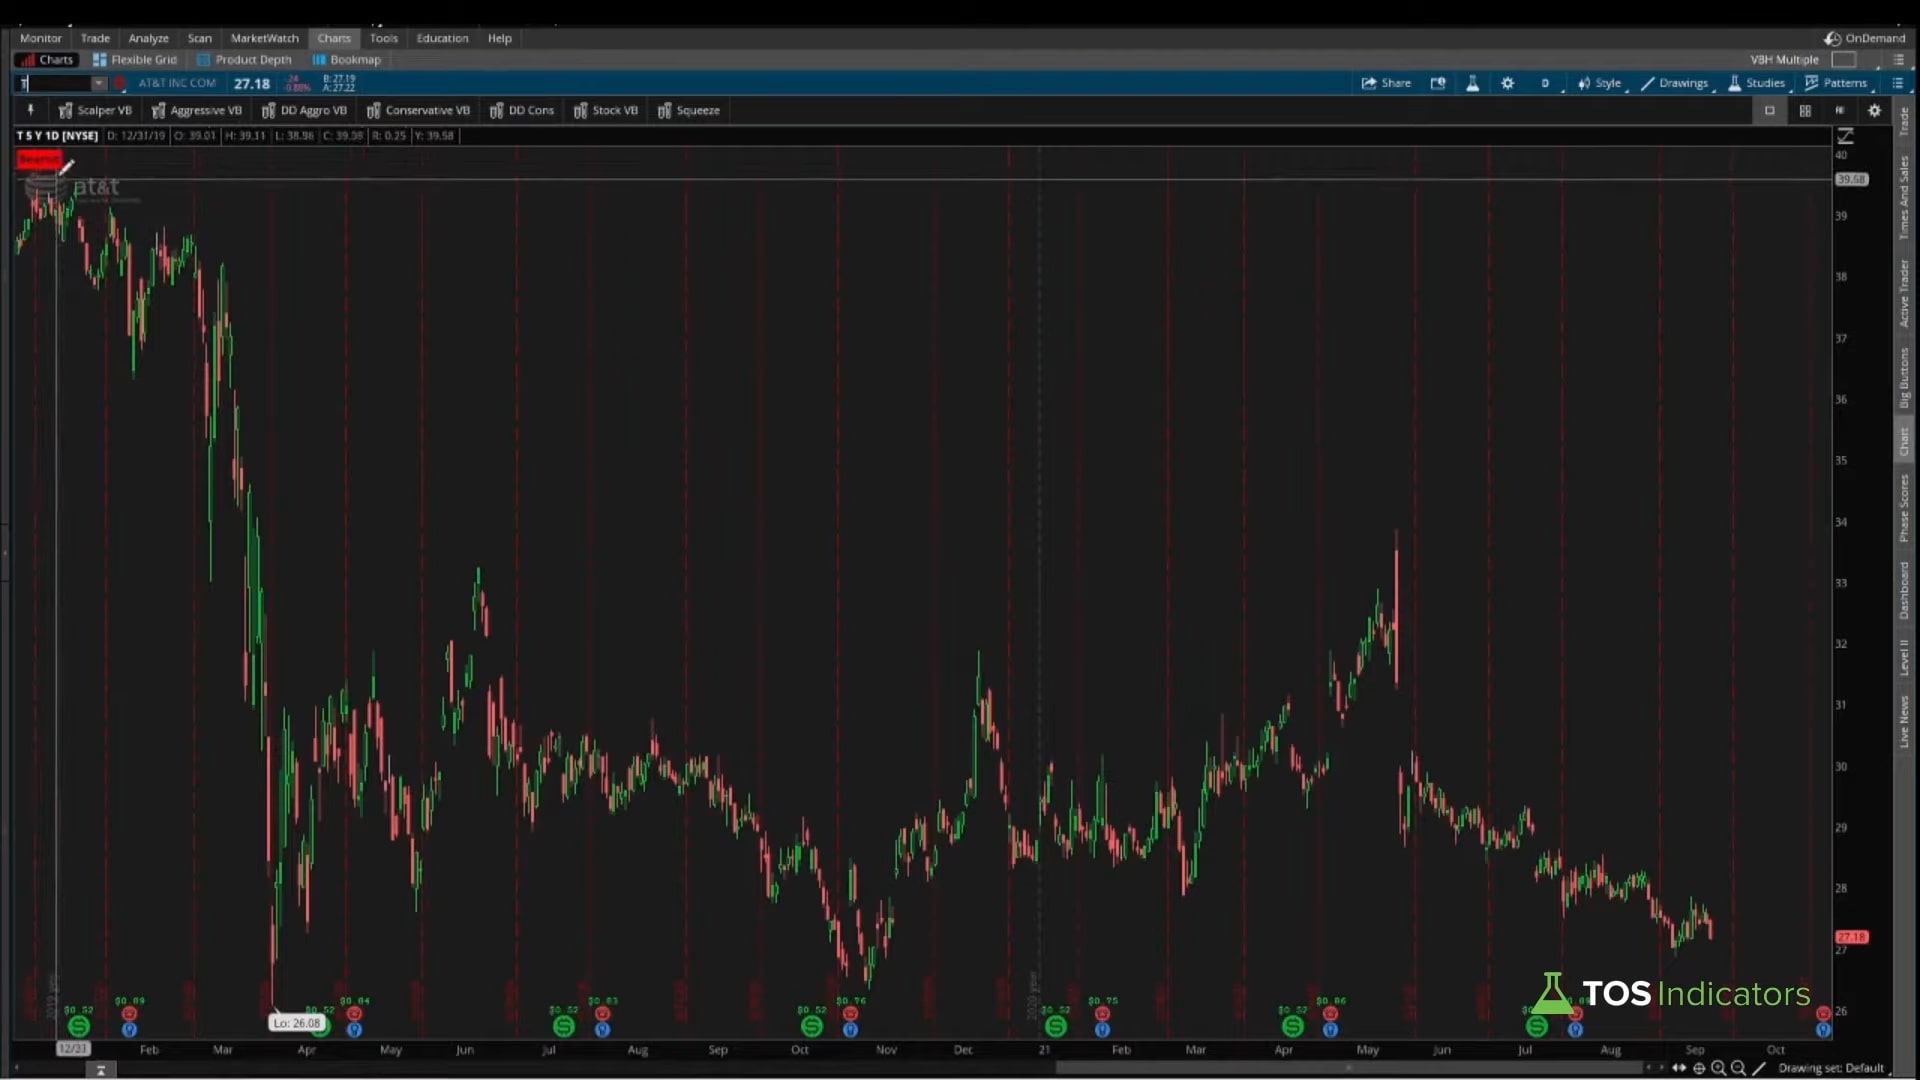
And something like this, on a bearish chart (AT&T):
Example 2: Plotting the Total Count of Bullish and Bearish Signals Inside of a label
The next label we'll create is around a counter variable.
For this portion, we are going to use the Simple Breakout Tool indicator as our starting point. This is a free indicator that we built in our "How to thinkScript" tutorial series, which is available here for download.
We need to establish a brand-new variable that will keep track of how many times bullish and bearish have occurred on this chart, just as we did previously with the previous variables.
To create the counter, we're going to use the TotalSum() function, which goes all the way back to the beginning of the chart and data available, to start tallying the count (ie. in this case, a 5 year, daily time frame chart).
def sumOfBullish = TotalSum(bullish);
def sumOfBearish = TotalSum(bearish);
And once we have both of those variables defined, we can now plug them into our AddLabel() code, so ThinkOrSwim can output the counter values.
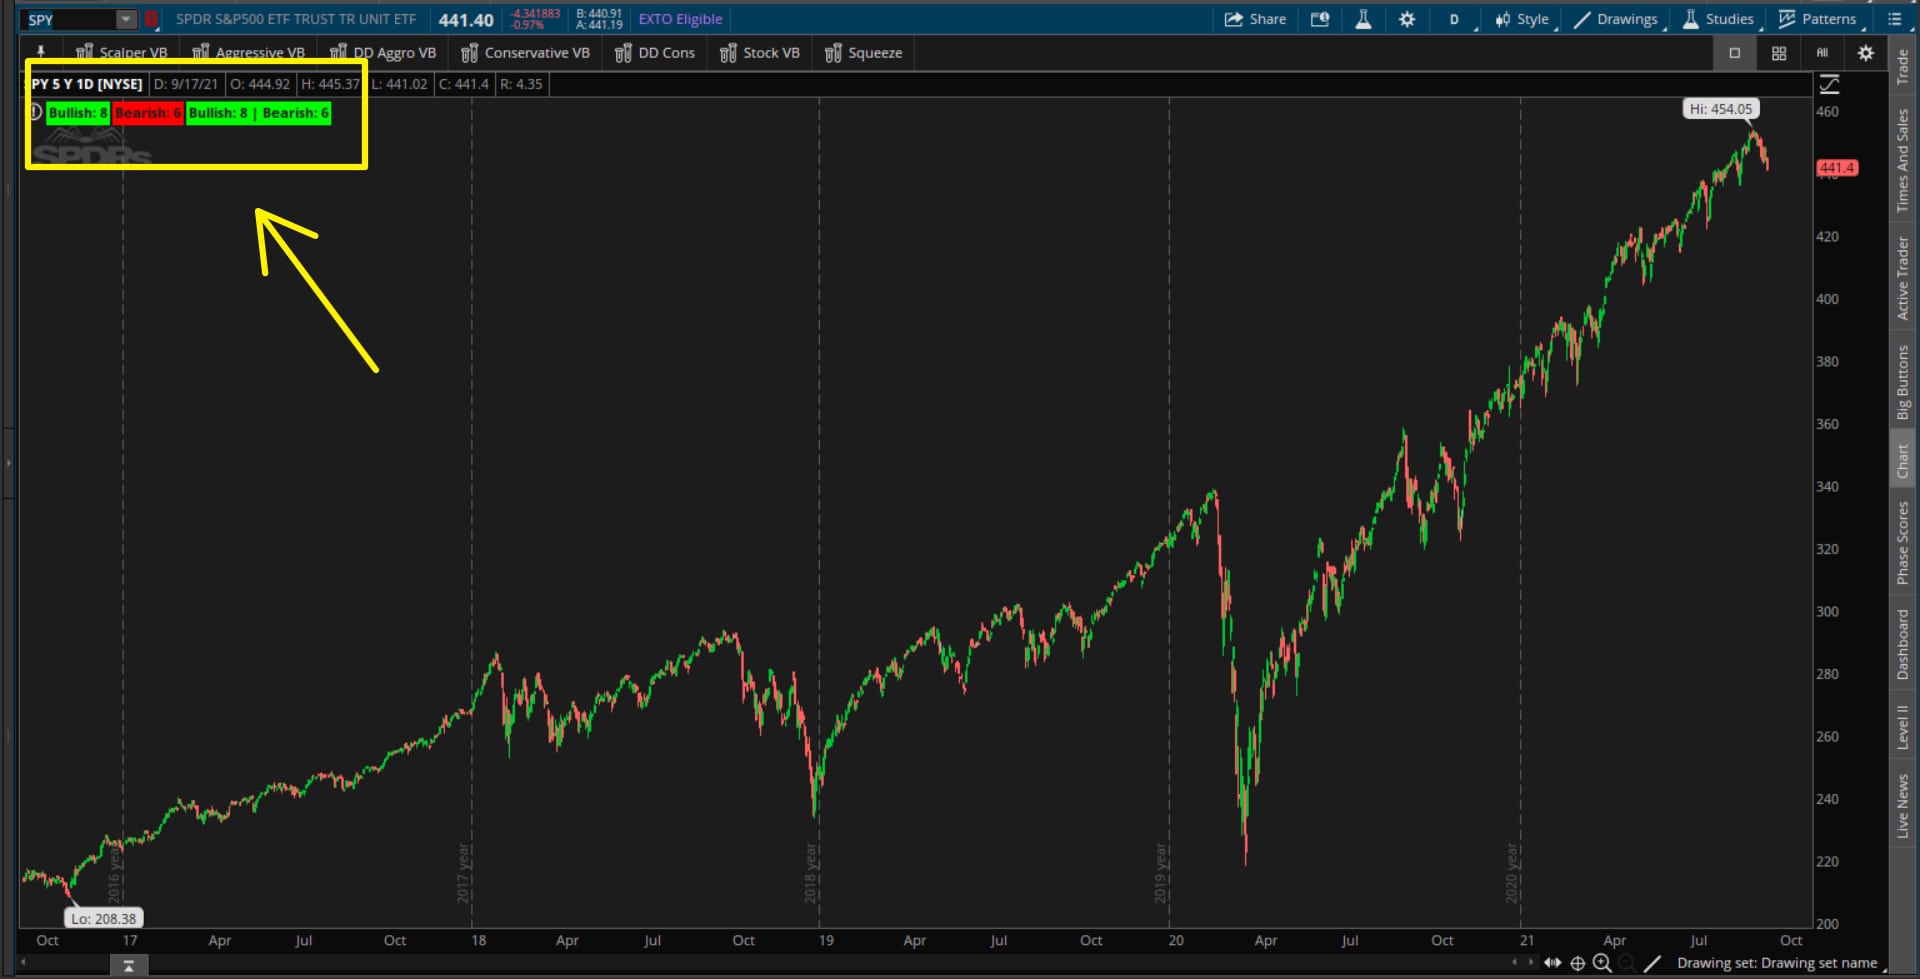
AddLabel(sumOfBullish >= 1, "Bullish: " + sumOfBullish, color.green);
AddLabel(sumOfBearish >= 1, "Bearish: " + sumOfBearish, color.red);
And a third example of incorporating the same data, but using more conditional statements for a "smarter" ThinkOrswim label.
AddLabel(yes, "Bullish: " + sumOfBullish + " | Bearish: " + sumOfBearish, if SumOfBullish > sumOfBearish then color.green else color.red);
Here's what the final output looks like, counting the bullish and bearish Simple Breakout Tool signals on a chart of the S&P 500:
This second dynamic label example should give you a starting point for how to begin collecting data from the indicators we've created, such as the Fisher Transformer indicator and scans, and expedite your research and analysis process.
Example 3: Connect User Input to Label Output
For our third and final label, we're going to keep it interesting by connecting a user's input on the studies menu, with the output shown in the label.
We'll use the EMA length as an example, but you can extrapolate this for a multitude of use-cases, including things such as displaying the number of days until earnings, backtester stats, etc.
Let's say we wanted to plot what the fast simple moving average (SMA) length is that's currently being used in the calculation for the Simple Breakout Tool.
We can simple paste in the user input variable for Fast SMA length into the second parameter of the AddLabel function. This allows for us to (very) easily connect the two, and cycle through charts, watchlists, etc. with easy statistics:
AddLabel(yes, "Fast SMA: " + fastSMALength, color.yellow);
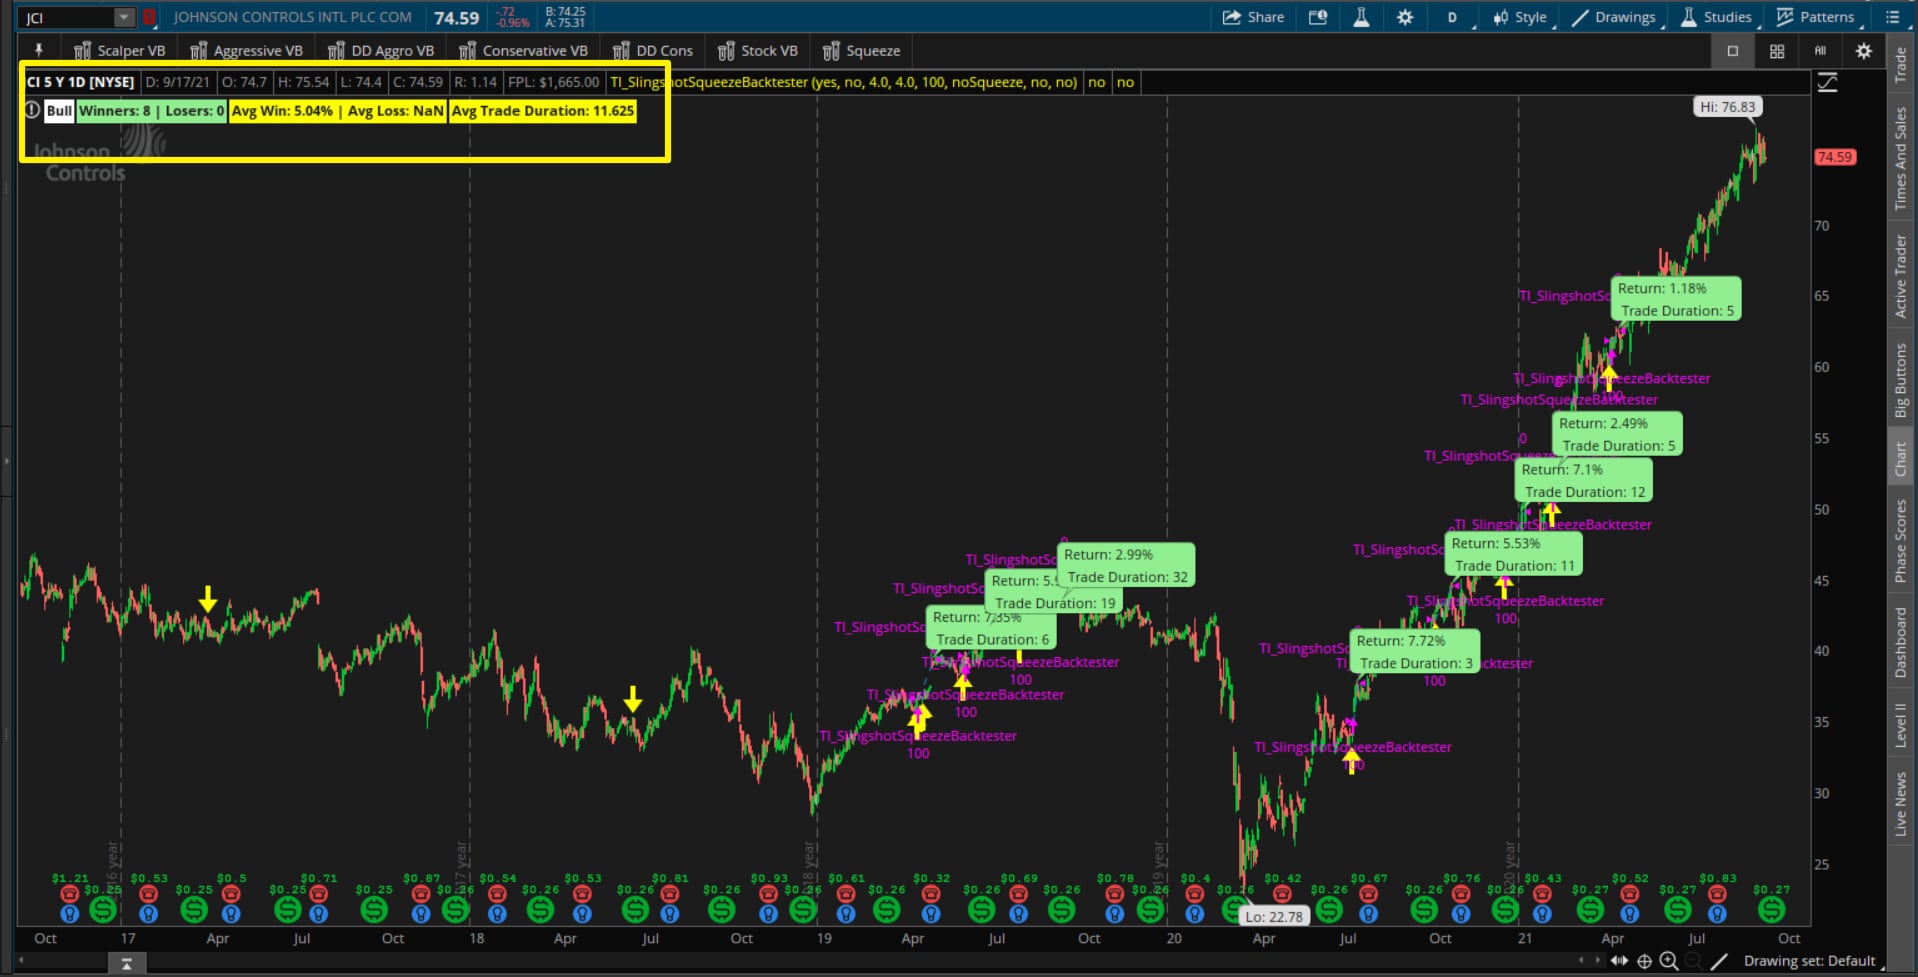
They're also excellent for testing out ideas and finding out how they perform during back-testing. We've proved this with the Slingshot Squeeze Back Tester, which tests slingshot squeezes, as well as the Squeeze Signals Back Tester.
Here's an example of labels expediting the research process in the stock JCI:
Conclusion:
In a tiny nutshell, the labels are what I believe make the most of these statistics. They're beginning to employ them to really gather data and improve the speed of testing your training plan.
I hope this tutorial around how to create a label was useful. We went through six different examples, some were a bit shorter, some were a bit lengthier in terms of the explanations, but hopefully all around here you have a good starting point to take the add label function and use the three different parameters and start to test it in your own indicators.
Feel free to email us at co*****@***********rs.com, if you have any questions.
Alright, take care everyone. Good luck trading and we'll see you in the next update.
