In today’s video, we’re going to continue along the theme from our previous video of our put call ratio signaling for us to be cautious. This week, XLF earnings could be the catalyst that causes the market to pullback.
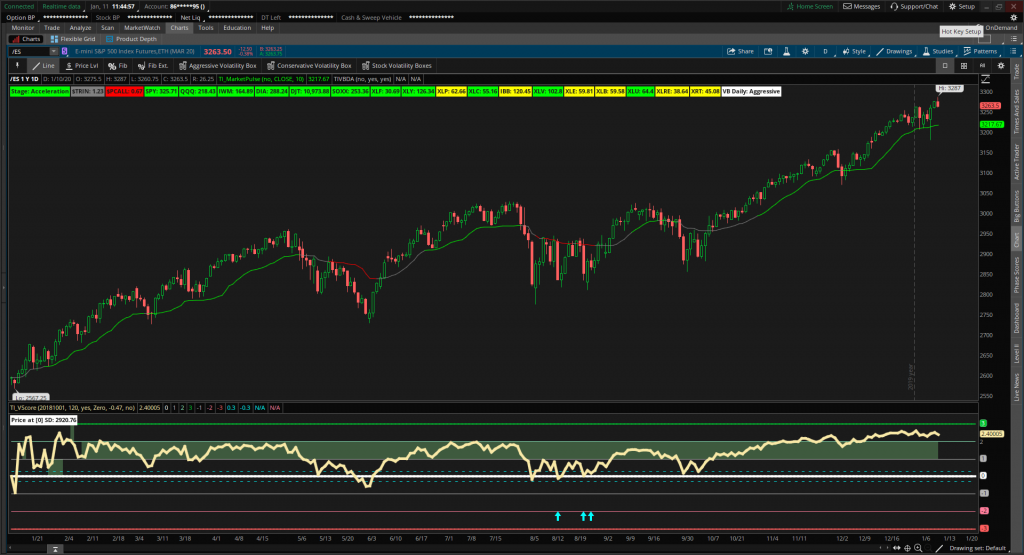
Last week, our put call ratio ThinkorSwim indicator (found in our Utility Labels) turned red, giving us a reason to be cautious heading into next week. We talked about some of the ETF markets that would need to roll over for the markets to revert to the mean.
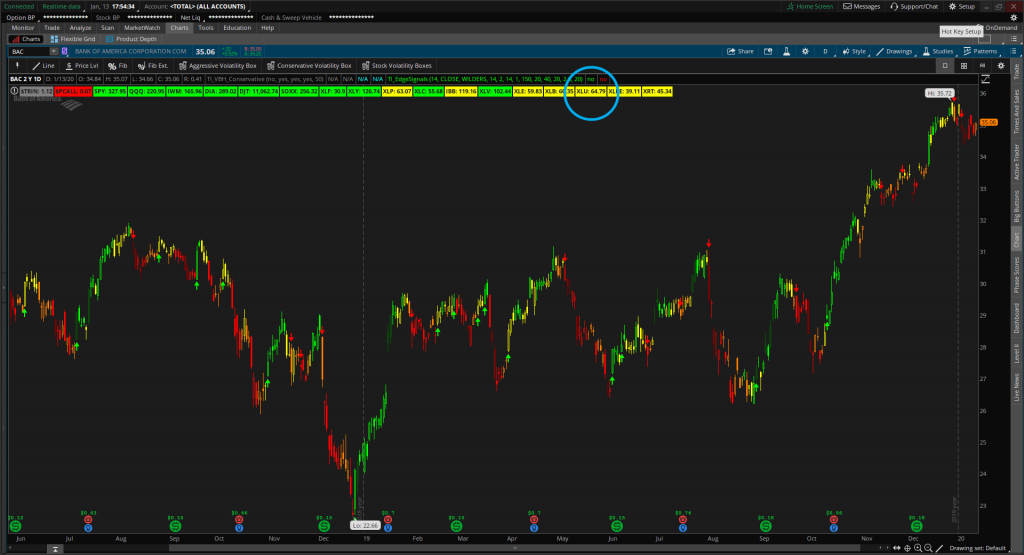
Since our last Daily Trade Report, XLU has rolled over from Bullish to Neutral, giving us one more ETF market that has taken a pause.
We look at XLF being the next market that could turn yellow on our Utility Labels, giving us a clue that the market is in accumulation phase. The XLF earnings this week could be the catalyst to that volatility.
List of Free Indicators Used in Video:
Below are a list of the free ThinkOrSwim indicators used in our big-picture market update video for this week:
- Market Pulse – Understand which of the four market stages we are currently in
- Utility Labels – Big picture overview for all major markets and internals
- Smarter Earnings – Prepare and plan for earnings with Gap Fills and Gap n Go’s
XLF Earnings and the Put Call Ratio
Let’s start by bringing in a screenshot from our weekend update video:

Now let’s take a look at our Utility Labels in today’s video:

One thing has changed. XLU has gone from a stage of acceleration to a stage of accumulation. That is information for us.
Next, we want to see XLF go through a similar transition, to support the bearish hypothesis derived from the Put Call ThinkOrSwim ratios.
With XLF earnings this week, that just may be our catalyst that could give us the rollover we are looking for. A few overall XLF earnings’ misses from some big names could be the catalyst to send XLF lower.
Some noteworthy names reporting this week include:
- JP Morgan (JPM)
- Citigroup (C)
- Bank of America (BAC)
- Goldman Sachs (GS)
- US Bankcorp (USB)
EarningsWhisper.com is a good resource for those looking to build watchlists around earnings tickers.
We are using two tools to help us plan our earnings trades:
- Smarter Earnings Tool to find earnings patterns
- Stock Volatility Box to find concrete entries, stops and targets to trade against
Likely Trending List – Jan 14, 2020
Using our new Stock Volatility Box Tool, we have a few different symbols that are on our “Trend Trending” list for Tuesday (January 14, 2020). Below is a sample list of just a few of those symbols.
Each of these symbols closed outside of our Volatility Box edge, and we look for them to continue to trending into tomorrow’s session, if they breach our clouds.
- Apple (AAPL)
- Anthem (ANTM)
- Baidu (BIDU)
- Citigroup (C)
- Lululemon (LULU)
- Marvell (MRVL)
- Tesla (TSLA)
For all of our Volatility Box members with access to the tool, you can use the list above to create a game plan for tomorrow’s trading.
The key will be to look for price to breach above either the Aggressive or Conservative Volatility Box cloud edge in the first 15 minutes of market open.
Here is a comma-delineated list of the tickers above, that you can input directly into the Stock Volatility Box Tool:
AAPL, ANTM, BIDU, C, LULU, MRVL, TSLA
If we breach above each of those respective levels, then we’ll be looking at those symbols as likely trending candidates for the day.
However, if we do not breach those levels within the first 15 minutes, then we skip the symbol and focus on areas where we have breached.
Conclusion:
XLF earnings holds our attention this week. We look at them not only as trade opportunities using our Smarter Earnings and Stock Volatility Box, but also as a domino falling.
XLU has already rolled over from our last update. A transition in XLF from from acceleration to accumulation would support a pullback in the S&P. This would also help us confirm our put call ratio hypothesis.
Nothing is guaranteed though. Financials could crush earnings, and rip the market higher. This would lead the 10-day put call ratio SMA to remain below our 0.85 threshold for much longer.
Start trading with an edge, at the edge, and sign up for the Volatility Box today
Pingback: CVNA Stock Falls Perfectly Into Our Levels – TOS Indicators
Pingback: Day Trading Volatility in Nasdaq, Crude and More – TOS Indicators