
Using the ThinkOrSwim Put Call Ratio Indicator to Plan
In today’s video, we’ll use some of our free ThinkOrSwim indicators to do some weekend homework.
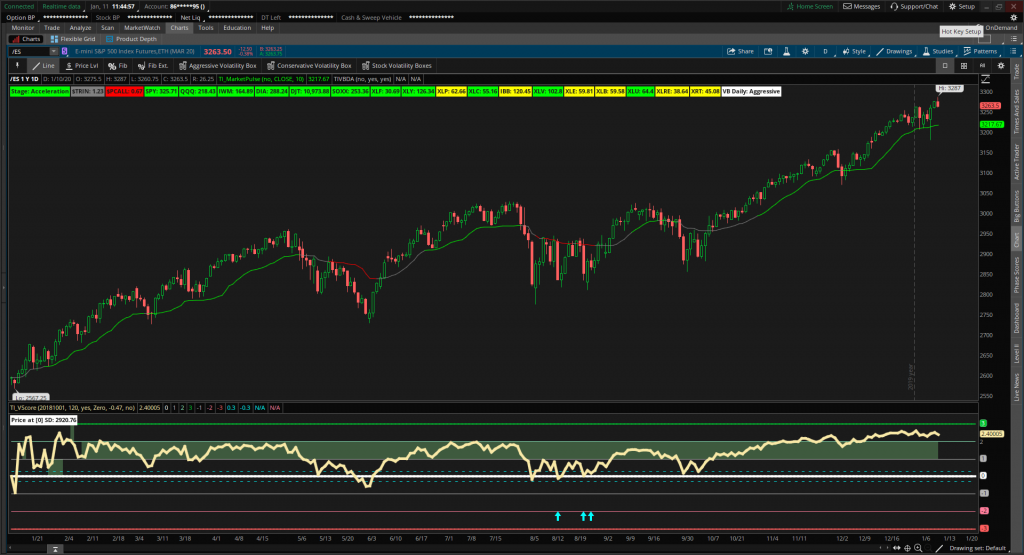
Our ThinkOrSwim Put Call Ratio indicator (found in our Utility Labels) turned red, giving us a reason to be cautious heading into next week.
With the Utility Labels for ThinkOrSwim, we’ll take a broader view at all of our major ETFs and take a look to see what is bullish, bearish and neutral.
List of Free Indicators Used in Video:
Below are a list of the free ThinkOrSwim indicators used in our big-picture market update video for this week:
- Market Pulse – Understand which of the four market stages we are currently in
- Utility Labels – Big picture overview for all major markets and internals
- V-Score – Measure price action and its distance relative to the VWAP
Why Did the ThinkOrSwim Put Call Ratio Turn Red?
When we created the Market Pulse indicator, we also built an additional ThinkOrSwim study with labels for some key markets we care about.
- Internals: $TRIN , $PCVA
- Indices: SPY, QQQ, IWM, DIA
- Transports and Semi’s: DJT, SOXX
- Major ETFs: XLF, XLY, XLP, XLC, IBB, XLV, XLE, XLB, XLU, XLRE, XRT \
From our list above, the 10-day Simple Moving Average of our ThinkOrSwim Put Call Ratio ($PCALL) is currently plotting at 0.67.
Let’s first understand how these values are calculated. Below is a guide as to how we interpret the 10 day SMA values of the $PCALL:
- If $PCALL > 1.0 — Bullish
- If $PCALL < 0.85 — Bearish
- If $PCALL in between 0.85 and 1 — Neutral
With a $PCALL reading of 0.67, that puts us in the bearish zone territory, where we are looking for a potential pullback to the mean. Some of our major ETFs are also starting to roll over.
XLP, IBB, XLE, XLB, XLRE and XRT are all currently in our neutral/cautious yellow zone. If XLV and XLF start to follow suit, that may help us with timing a potential reversion to the mean.
However, it is important that we do not try and predict what will happen next.
That’s a fool’s errand.
The markets could very well continue ripping higher, defying all laws of logic and sense. The markets feast on breaking rules.
Instead, we use the above as information, to help us make – you guessed it – an informed decision.
Likely Trending List – Jan 13, 2020
Using our new Stock Volatility Box Tool, we have a few different symbols that are on our “Trend Trending” list for Monday (January 13, 2020). Below is a sample list of just a few of those symbols.
Each of these symbols closed outside of our Volatility Box edge, and we look for them to continue to trending into tomorrow’s session, if they breach our clouds.
- Bed Bath and Beyond (BBBY)
- Harley Davidson (HOG)
- Rollins (ROL)
- Restoration Hardware (RH)
- Telaria (TLRA)
For all of our Volatility Box members with access to the tool, you can use the list above to create a game plan for tomorrow’s trading.
The key will be to look for price to breach above either the Aggressive or Conservative Volatility Box cloud edge in the first 15 minutes of market open.
Here is a comma-delineated list of the tickers above, that you can input directly into the Stock Volatility Box Tool:
BBBY, HOG, ROL, RH, TLRA
If we breach above each of those respective levels, then we’ll be looking at those symbols as likely trending candidates for the day.
However, if we do not breach those levels within the first 15 minutes, then we skip the symbol and focus on areas where we have breached.
Conclusion:
In our weekend market update video, we use some of our free indicators to gather information about the markets.
Our ThinkOrSwim Put Call Ratio label from our Utility Labels indicator gives us a warning sign of a potential pullback. With a value of 0.67, we look for some of our other ETFs like XLF and XLV to start to roll over, confirming a reversion to the mean.
For the upcoming Monday’s trading activity, we also published a “Likely Trending” list, which should help in determining where to focus.
Have a great weekend!
Start trading with an edge, at the edge, and sign up for the Volatility Box today