
Using the VIX to Choose an Opening Range Breakout (ORB) Strategy
Live ORB trade on IBM using the scanner. 86% short-side win rate over 90 days. Entry at $183.33 on pullback to half range. Both targets hit: T1 at $182.50 and T2 at $181.66.
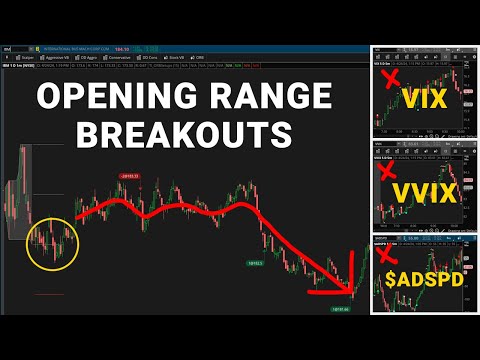
Finding the Trade with Market Internals
In the companion video, we start by assessing market internals to establish a bias. The volatility of the VIX showed no clear direction with a lot of back and forth. The advance/decline spread was rallying but lacked strength. The S&P and NASDAQ both appeared to be rolling over, with the NASDAQ showing a one-two punch setup suggesting bearish activity. With a short-side bias established, we used the ORB scanner to find trades aligned with that direction.
IBM on the ORB Scanner
IBM triggered a 15-minute opening range breakout to the short side. The scanner showed real-time backtest data for this specific ticker: an 86% win rate over the past 3 months, positive expectancy, positive P&L, and a typical risk-to-reward of 2:1. The opening range width was slightly above average, suggesting more volatility than usual, but close enough to the typical range to be actionable.
Setting Up the Entry
On the 5-minute chart, IBM had broken below the 15-minute opening range and then rallied back up to the midline. This pullback to the half range created a better entry than the original breakout price at 6:46 AM Pacific. Because we were entering above the breakout level, our risk (stop above the ORB high) to our target (original T1 near $182.49) was closer to 1:1 instead of the scanner's typical 2:1. Better entry, tighter risk.
The trigger: momentum crosses on the 2-minute chart. After seeing the first signs of selling pressure and a momentum cross, we placed a two-bracket order. Entry at $183.33, stop above the opening range high, first target (T1) at the opening range low near $182.50, second target (T2) at $181.66.
Trade Execution and Result
The fill came at $183.33. After some chop, price sold off and hit T1 near the opening range low. At that point, the stop moved to breakeven at $183.30 (3 cents below entry), protecting the remaining position while leaving T2 in play at $181.66.
IBM moved all the way down to T2 at $181.66 before reversing and rallying into the close. Both targets were hit. The trade had no overnight risk, and IBM reported earnings after the close that session, which saw a selloff. The entire trade was completed intraday, well before the earnings catalyst.
The Risk Management Framework
The two-bracket order structure works as follows. The first position has a stop above the ORB high and a target at T1 (the breakout level or opening range low). This is a risk-one-to-make-one setup. Once T1 is hit, the stop on the second position moves to breakeven. The second position now has zero risk with a target at T2. If T2 hits, the overall trade produces a risk-one-to-make-approximately-two outcome. If T2 does not hit, the second position exits at breakeven and you still keep the T1 profit.
Using the Scanner to Find These Setups
The ORB live scanner does the filtering automatically. It shows you which tickers currently have active opening range breakouts, along with the real-time backtest data for each ticker: win rate, expectancy, P&L, and risk-to-reward. You filter by direction (long or short) based on your market bias from the internals analysis, then focus on tickers with high win rates and positive metrics. For all Volatility Box members, the scanner is available through the ORB platform.
Frequently Asked Questions
What win rate did IBM show on the ORB scanner?
86% short-side win rate on the 15-minute opening range breakout over the past 3 months. The scanner also showed positive expectancy and P&L.
How did you improve the entry?
Instead of entering at the original breakout level ($182.49 area), we waited for price to pull back to the half range at $183.33. This gave us a better entry price closer to our stop, improving the risk-reward ratio on the first target to approximately 1:1.
What was the final result?
Both targets hit. T1 near $182.50 (opening range low) and T2 at $181.66. After hitting T2, IBM reversed and rallied into the close. The trade was fully closed before IBM reported earnings after hours.
How does the two-bracket order work?
Both positions share the same stop above the ORB high. First target at T1 (breakout level). Once T1 hits, the second position's stop moves to breakeven. T2 target stays in place. This creates a risk-one-to-make-two structure with the second position having zero risk.
How do you choose which direction to trade?
Start with market internals: check the volatility of the VIX, advance/decline spread, and the trend of the major indexes. Establish a long or short bias, then filter the ORB scanner to show only trades in that direction.


Ready to Trade With an Edge?
Join 40,000+ traders using institutional-grade tools for ThinkOrSwim.
Get the Bundle