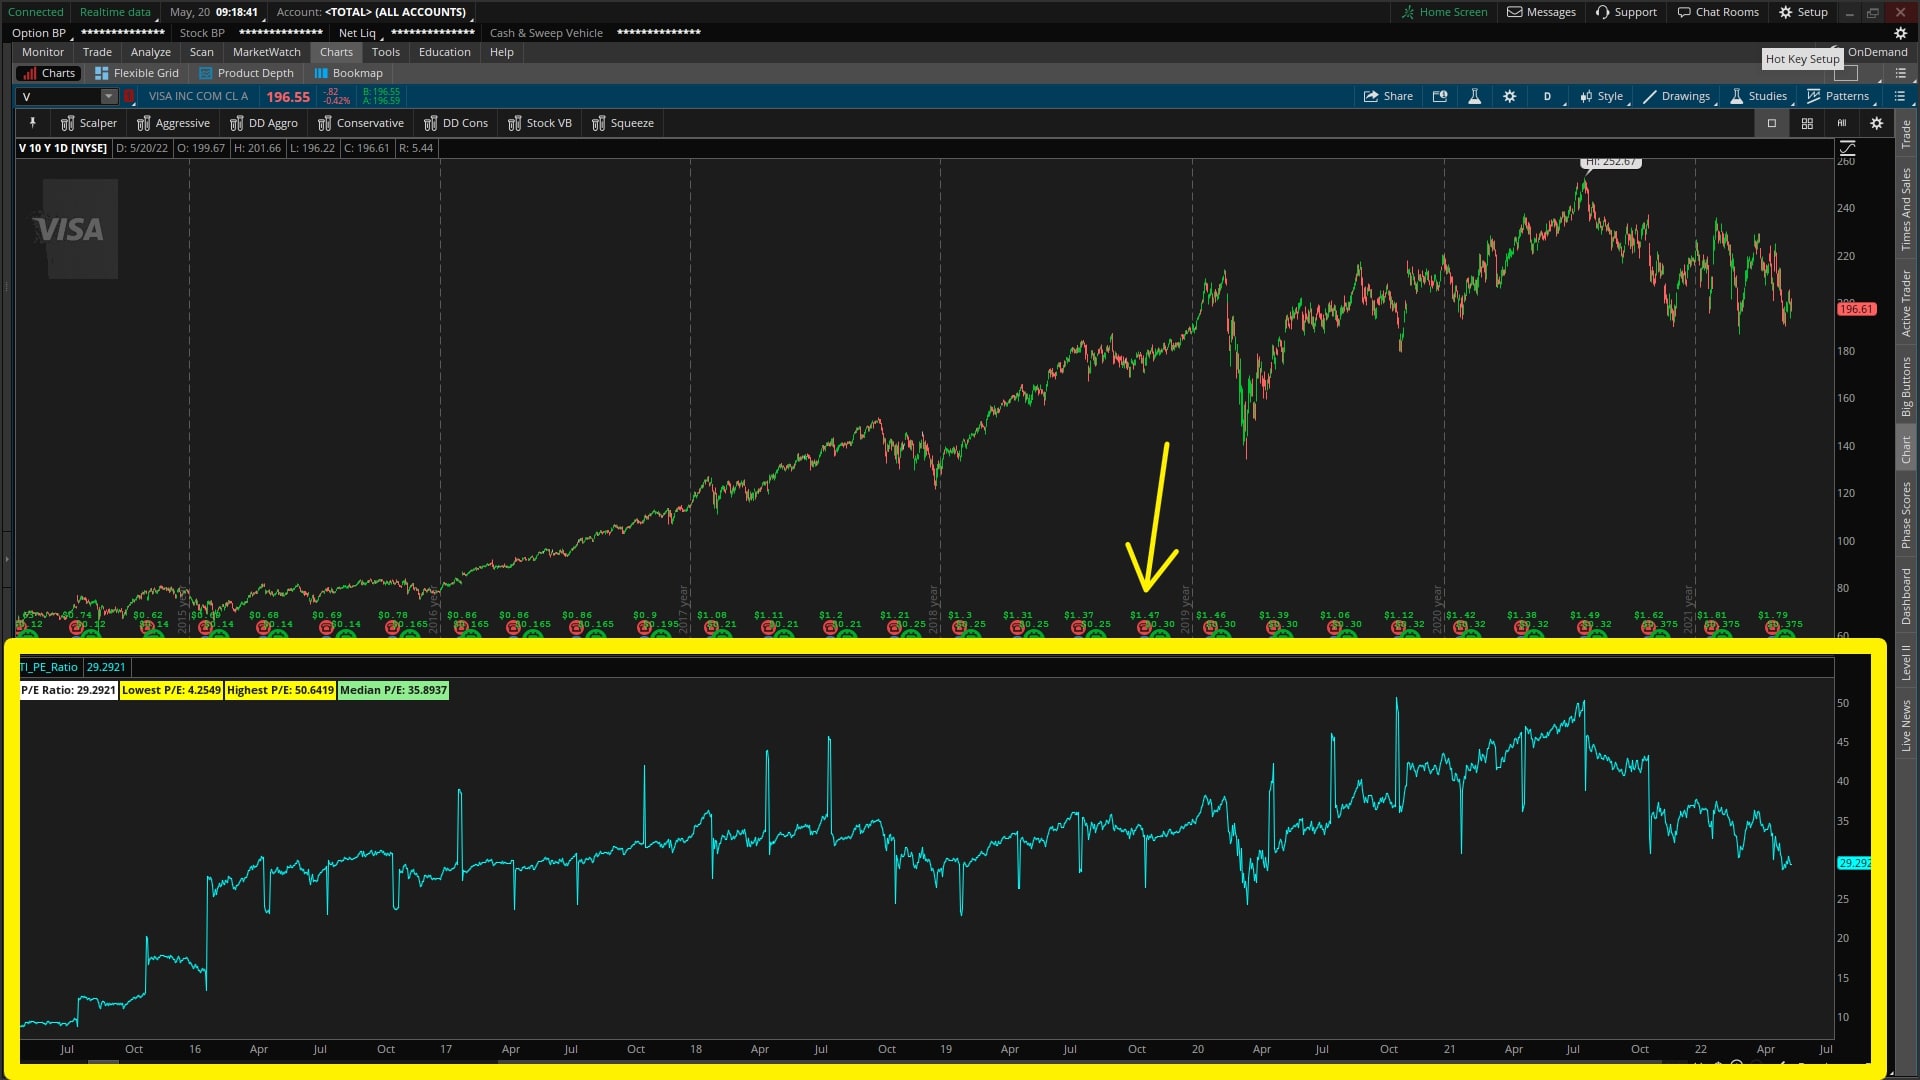
P/E Ratio
Track the current and historical P/E ratio, to find stocks that are under and over valued.

The P/E ratio is one of the more popular methods for valuing stocks. It is simple to calculate and easy to understand.
In this tutorial, I'll show you how to build your own P/E ratio indicator inside of ThinkOrSwim.

While you can view P/E ratios on just about any financial website these days (think Yahoo Finance, WSJ, etc.), I think there are two key benefits to plotting the P/E ratio inside of ThinkOrSwim.
- Historical P/E Ratio Data - you can go back more than 10 years, and view how the P/E ratio has changed over time. This provides you with context.
- Ability to Interact with the Data - you can run calculations on the data (think basic statistical approaches, up to regressions and more complex analysis)
In future tutorials, we'll work on more examples of #2, and start analyzing the data to find useful insights.
Before we start writing any code, let's first understand when the P/E ratio is best used as a valuation method, and what type of stocks are best suited for it.
Let's get started!
Volatility Box Invite
We are TOS Indicators.com, home of the Volatility Box.
The Volatility Box is our secret tool, to help us consistently profit from the market place. We’re a small team, and we spend hours every day, after the market close, doing nothing but studying thousands of data points to keep improving and perfecting the Volatility Box price ranges.
We have two different Volatility Boxes - a Futures Volatility Box and a Stock Volatility Box.
Futures Volatility Box - Trade Major Markets With an Edge
Designed For: Futures, Micro-Futures and Index Market Traders
Supported Models: Hourly Volatility Box models
Supported Markets: 10 Major Futures Markets
The Futures Volatility Box comes with:
- 5 Volatility Models for each market
- Support for 10 Futures Markets (/ES, /NQ, /YM, /RTY, /CL, /GC, /SI, /ZB, /HG, /NG)
- Video Setup Guide
- Trade Plan
- Access to all members-only resources, including Squeeze Course
Learn More About the Futures Volatility Box
Trade futures and micro futures with a consistent volatility edge
Stock Volatility Box - Powerful Web Based Volatility Platform
Designed For: Stock and Options Traders
Supported Models: Hourly and Daily Volatility Box models
Supported Markets: 10,000+ Stocks and ETFs (new markets added frequently)
A Stock Volatility Box membership includes access to:
- Live Scanner - A powerful scanner we've built from scratch, to scan 10,000 symbols every 2 seconds for new volatility breaches
- Dashboard - A quick and easy way to view daily volatility model levels online
- Short Interest Scanner - Short interest, Squeeze, and EMA data to find short squeezes
- Squeeze Course - All of our proprietary squeeze tools, including robust backtesters
- All Members Only Indicators - We don't nickel and dime you. Everything really is included.
- And much more!
Learn More About the Stock Volatility Box
Trade stocks and options with a consistent volatility edge
What is the P/E Ratio?
The P/E ratio is a valuation method, that compares price to earnings, to determine how "expensive" a company is. The higher the P/E number, the more expensive the company. The lower the P/E number, the "cheaper" the company (though, there is such a thing as too low too).
Peter Lynch, when looking for companies, often stated that he preferred low P/E's, but still looked for a P/E greater than 5, to avoid companies that had a "more permanent" problem.
To calculate the P/E ratio, simply divide a company's stock price, by its trailing-twelve-month (TTM) earnings per share (EPS) price.
Here's the formula:
P/E Ratio = Price per Share / Earnings per Share (TTM)
For example, if a company's stock price is $30 per share, and their EPS for the past 12 months is $0.50, the P/E ratio would be 60.
One last note to add - P/E ratios can be calculated for an entire stock market (e.g. the S&P 500), or for an individual company.
When to Use the P/E Ratio?
The P/E ratio is best used as a valuation method for companies that have predictable earnings.
This includes companies in industries such as Consumer Staples, Healthcare, Utilities, Retail, etc.
Why?
These are businesses with products or services that people need to buy, regardless of the state of the economy. When the economy is good, people buy more of these products and services. When the economy is bad, people still buy these products and services, just not as much.
In economic terms, we're looking for companies that produce Giffen and inferior goods.
The demand for these types of products and services is relatively stable, which leads to predictable earnings.
And when earnings are predictable, the P/E ratio can be a helpful valuation method.
Note: Not all stocks can be valued using the P/E ratio.
For example, stocks with negative earnings will not be able to be evaluated with a P/E ratio, given the denominator is negative.
When is the P/E ratio most useful?
I've found that the P/E ratio is a more useful valuation method, when trying to compare companies that are in the same industry, or a similar vertical.
These companies tend to have similar business models and operate under similar economic conditions, which makes comparisons "apples-to-apples." Usually, they will have similar enough P/E ratios, with room to find inefficiencies that you can capitalize on.
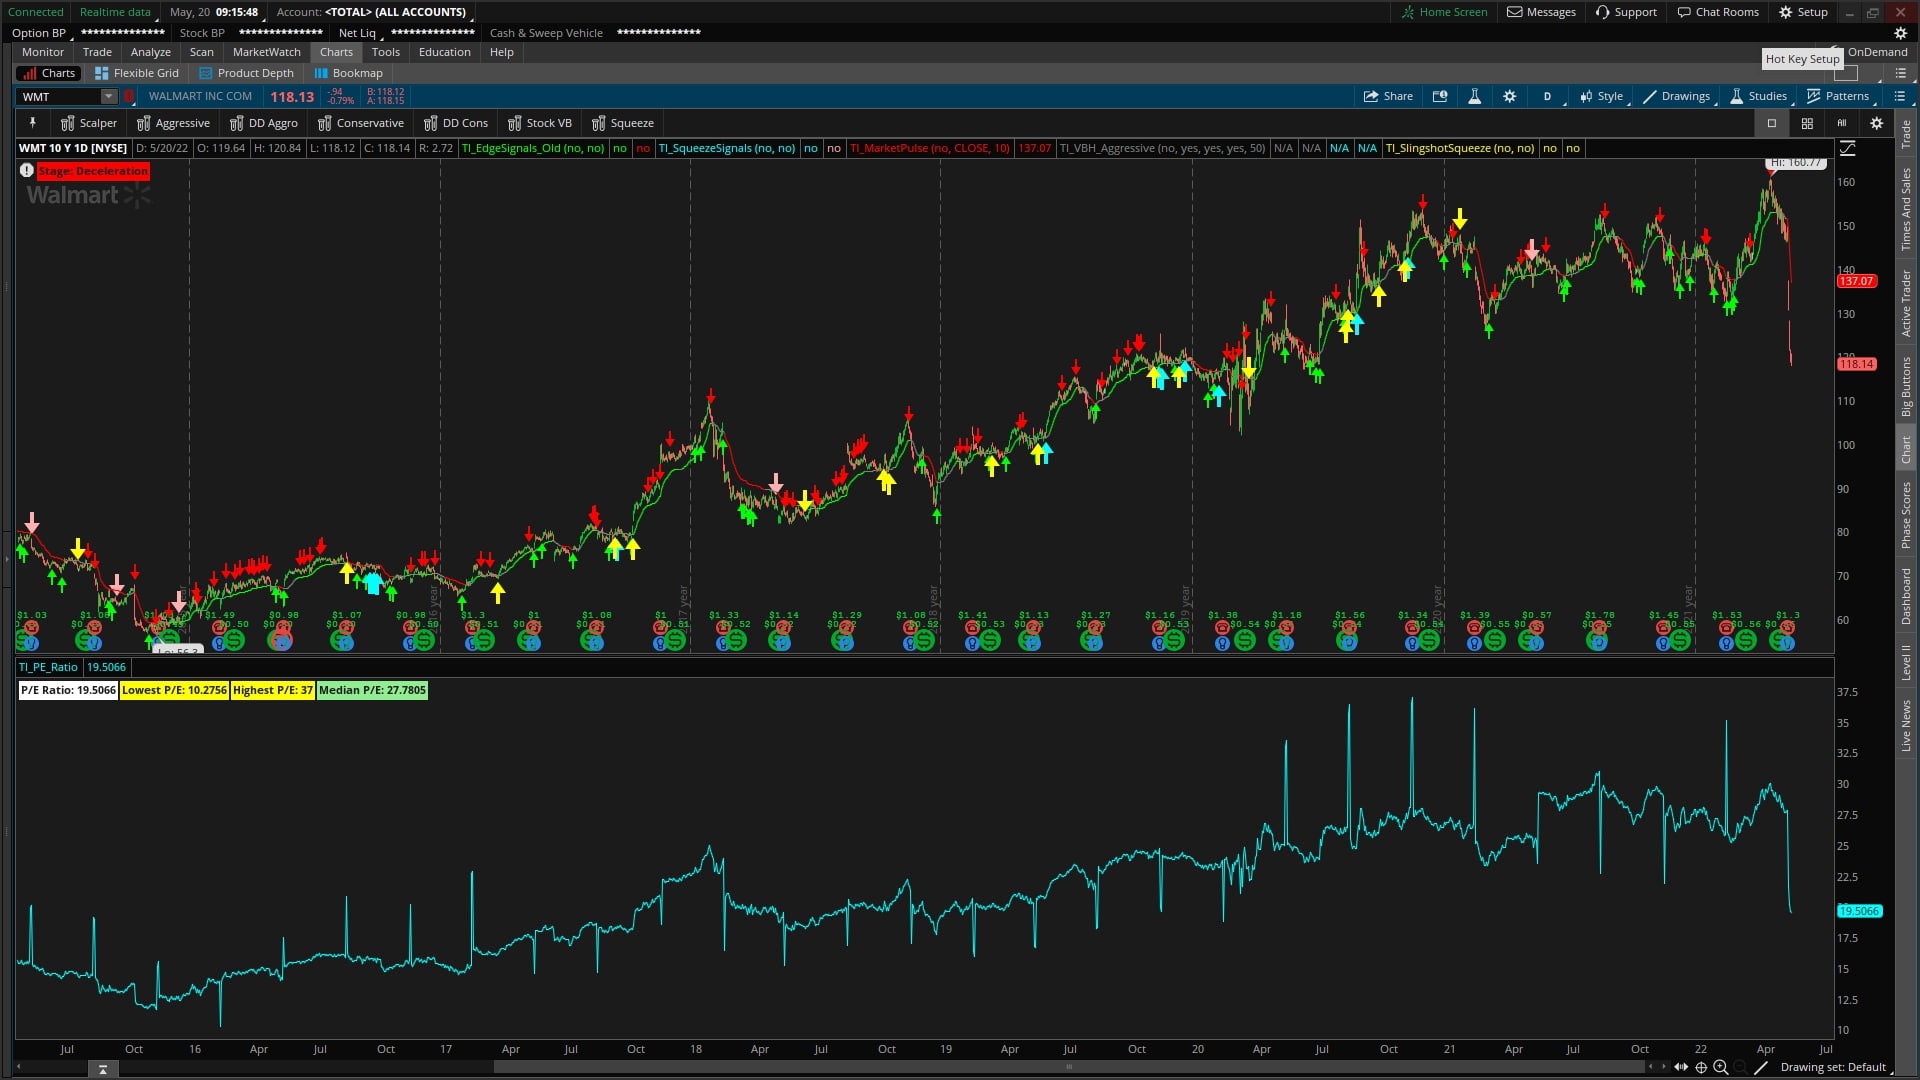
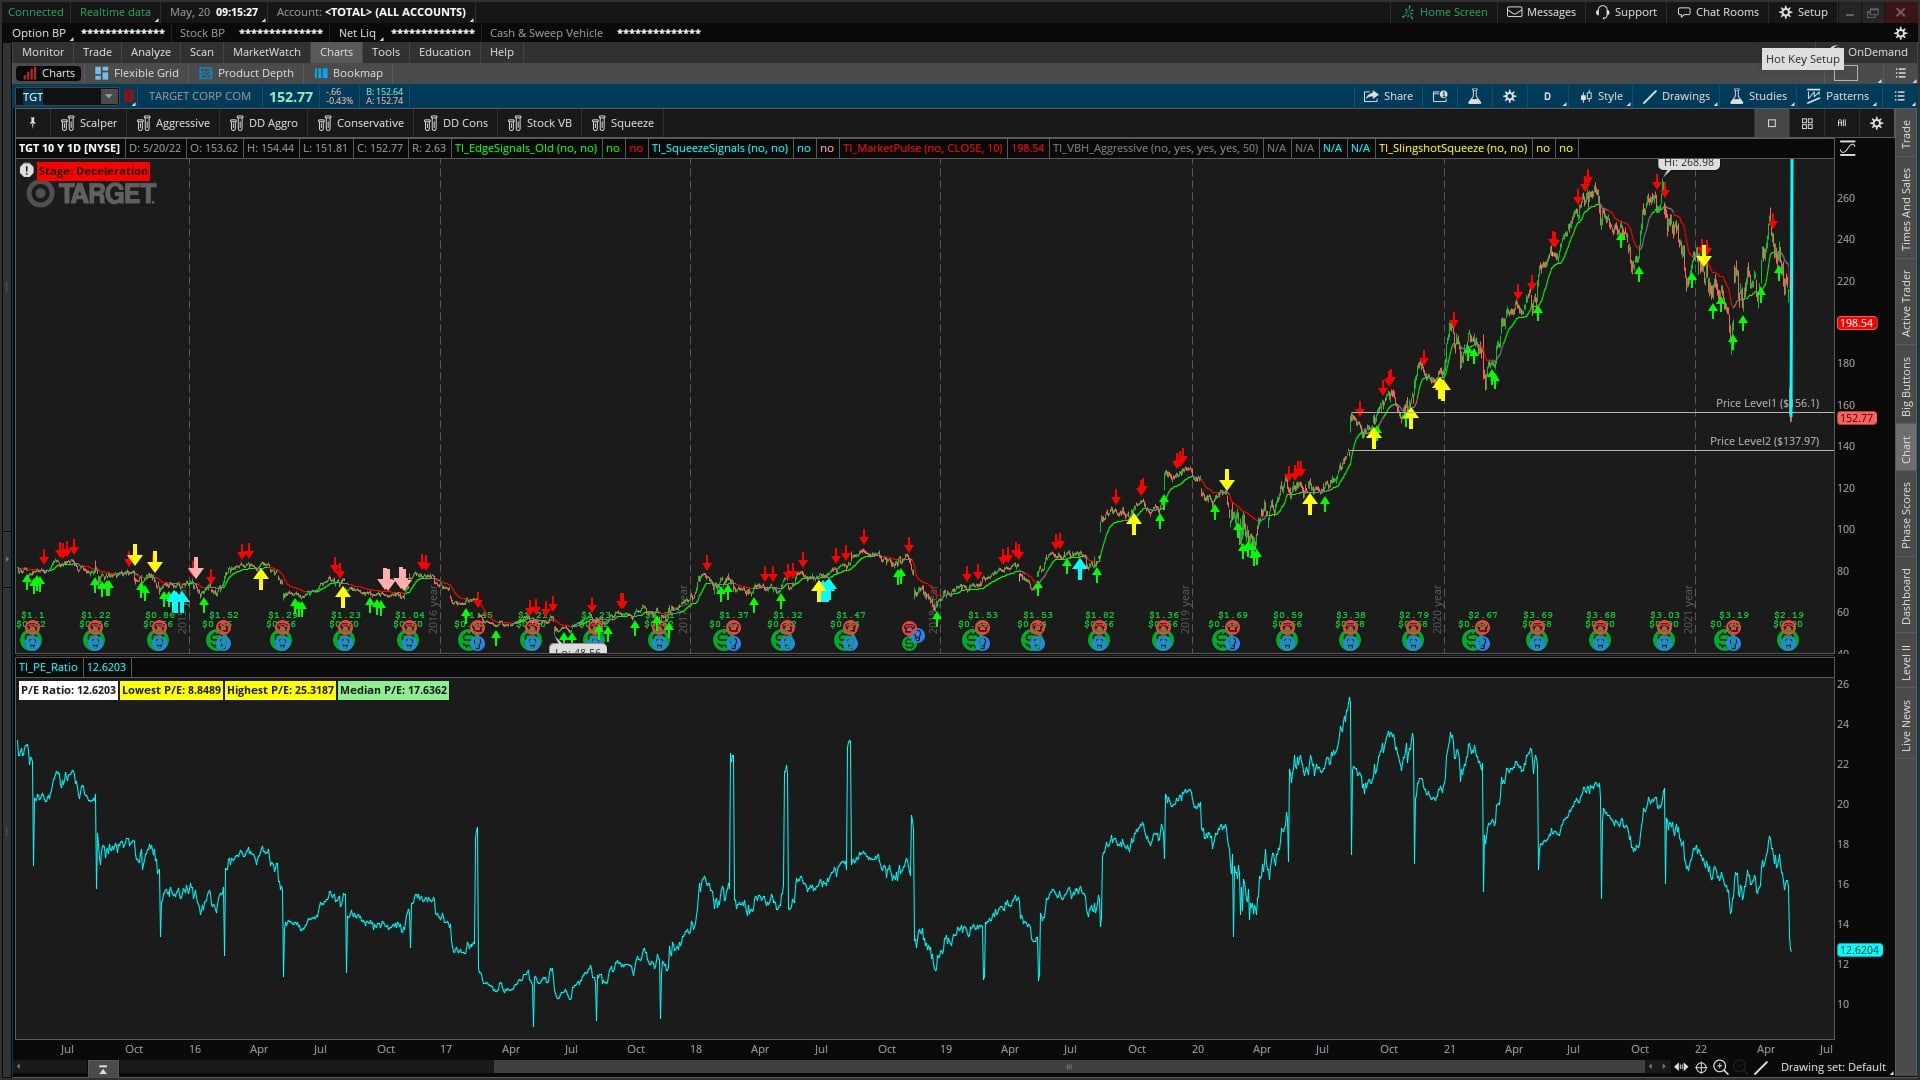
For example... let's say you're trying to decide between two retail stocks, Walmart and Target. Both have dropped after their most recent earnings announcements, and dropped substantially at that.
WMT:

TGT:

They could be bargains at the current prices, but you'd like to see what their current valuation is, in relation to what it's been previously.
| Company | Current P/E | Lowest P/E | Highest P/E | Median P/E |
| Walmart (WMT) | 19.50 | 10.28 | 37 | 27.78 |
| Target (TGT) | 12.62 | 8.85 | 25.32 | 17.63 |
While both are under their 200-day median P/E ratios, Target looks to currently be more "undervalued," when compared to Walmart.
Using this as a starting point, you can dig deeper into respective companies to determine if they are ones you'd like to add to your portfolio.
To take it further, you could combine this 'fundamental analysis' with 'technical analysis,' focusing on finding bullish trades in undervalued companies, and bearish trades in overvalued companies.
It goes without saying - the P/E ratio is only one valuation method, and it should not be used in isolation.
P/E Ratio Indicator for ThinkOrSwim
Now that we understand how the P/E is calculated, we can start writing our thinkScript code.
- For the numerator (price), we have that value easily accessible through the 'close' variable, tracking the closing price.
- For the denominator (earnings), we can calculate that using the GetActualEarnings function to get the EPS values, and sum that over the course of a year for the EPS TTM value.
Let's start by defining our EPS TTM variable:
def earningsValue = if IsNan(GetActualEarnings()) then 0 else GetActualEarnings();
def earningsTTM = Sum(earningsValue, 252);
Now that we have the EPS TTM variable, we can plug that into our P/E ratio formula:
def earningsValue = if IsNan(GetActualEarnings()) then 0 else GetActualEarnings();
def earningsTTM = Sum(earningsValue, 252);
plot pe = close / earningsTTM;
Next, we can output the P/E ratio in a label, by using the AddLabel function:
AddLabel(yes, "P/E Ratio: " + pe, color.white);
We now have our basic P/E ratio built, inside of ThinkOrSwim. This ratio allows you to see not only the current P/E value, but also historical values of the P/E ratio, to see how the valuation has changed over time.
Basic Statistics for Historical P/E Ratio
One of the benefits of having this data inside of ThinkOrSwim is the ability to interact with the data easily.
Let's start by applying some basic statistical calculations, to understand how has the P/E varied over time.
We'll calculate:
- Lowest P/E ratio over the past 10 yrs
- Highest P/E ratio over the past 10 yrs
- Median P/E ratio over the past 200 days
Let's start by defining each of these variables first, in thinkScript:
def LowestPE = LowestAll(pe);
def HighestPE = HighestAll(pe);
def MedianPE = Median(pe,200);
After we have the variables defined, we need to output them in a similar fashion to the labels we used for the P/E value:
AddLabel(yes, "Lowest P/E: " + LowestPE, color.yellow);
AddLabel(yes, "Highest P/E: " + HighestPE, color.yellow);
AddLabel(yes, "Median P/E: " + MedianPE, if pe <= MedianPE then color.light_green else color.light_red);
And voila!
We have the P/E Ratio in ThinkOrSwim, plotting both the current, along with historical values.
Conclusion
The P/E ratio is one of the most commonly used valuation ratios by investors, and for good reason.
It's a simple, yet effective way to value stocks.
In this tutorial, we discussed:
- How the P/E ratio is calculated
- How to use the P/E ratio to value stocks
- Which stocks does it make sense to use the P/E ratio to evaluate
- How to write a thinkScript code in ThinkOrSwim to plot the P/E ratio
- And finally, how to calculate some basic statistics for the P/E ratio over time.
I hope you enjoyed this tutorial, and if you have any questions, feel free to send us an email at co*****@***********rs.com.
Happy trading!
