S&P 500 November Seasonality Patterns in Bear Markets
November Seasonal Patterns in Bear Markets
Explore seasonal tendencies for the S&P 500 in the month of November, paying particular attention to the two bear markets.

Seasonal Analysis Patterns
Seasonal analysis is a technique that traders can use to help identify potential areas of support and resistance. By looking at historical data, traders can see how the markets have typically performed during certain months or seasons. This information can then be used to make more informed trading decisions.
In this video, we will take a look at how November has performed, and pay particular attention to Novembers in the context of previous bear markets.
There are two bear markets we’ll focus on:
- 2000 - 2002 Bear Market
- 2008 - 2009 Bear Market
We will also use technical analysis to identify possible areas of support and resistance.
Finally, we will introduce the Edge Signals and Market Pulse indicators to help identify potential entry and exit points.
November Seasonal Patterns in the Context of a Bear Market
In the context of a bear market, we see that the same level of strength inside of November doesn't hold true.
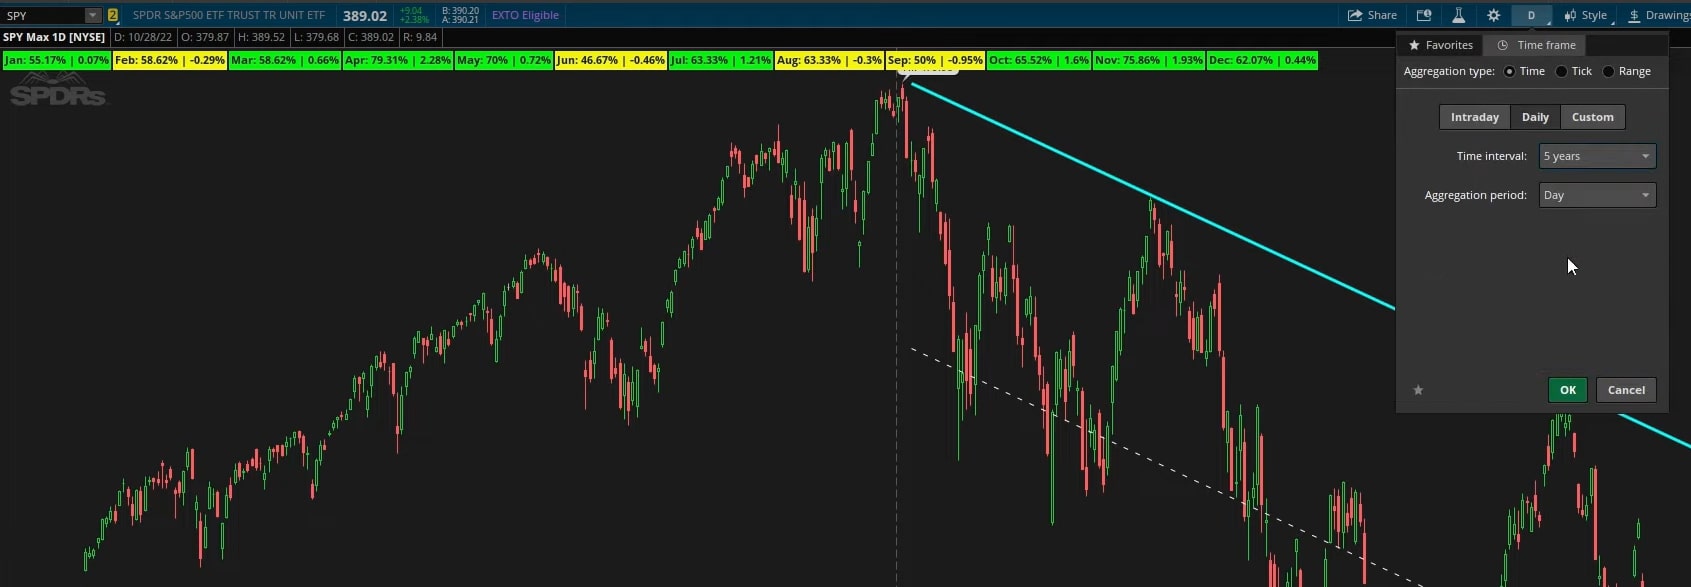
If we use the last 5 years worth of data (which does not contain a bear market), then our typical November seasonal analysis patterns suggest that the month of November is a bullish month 80 to 90% of the time.
In a bear market, however, that number drops down to something more like 50%. This means that in a bear market, it is a coin flip in terms of whether November will be a bullish or bearish month.
There are a few reasons why this might be the case.
- First, bear markets tend to be much more volatile than bull markets. Volatility could impact seasonal tendencies, which have primarily bull market years worth of data points.
- Second, in a bear market, there is typically more selling pressure than buying pressure. This could also impact the performance of November, as selling pressure could outweigh any bullish seasonal tendencies.
- And finally,bear markets tend to be associated with economic recessions. This could impact seasonal patterns as well, as consumer spending typically slows during economic recessions.
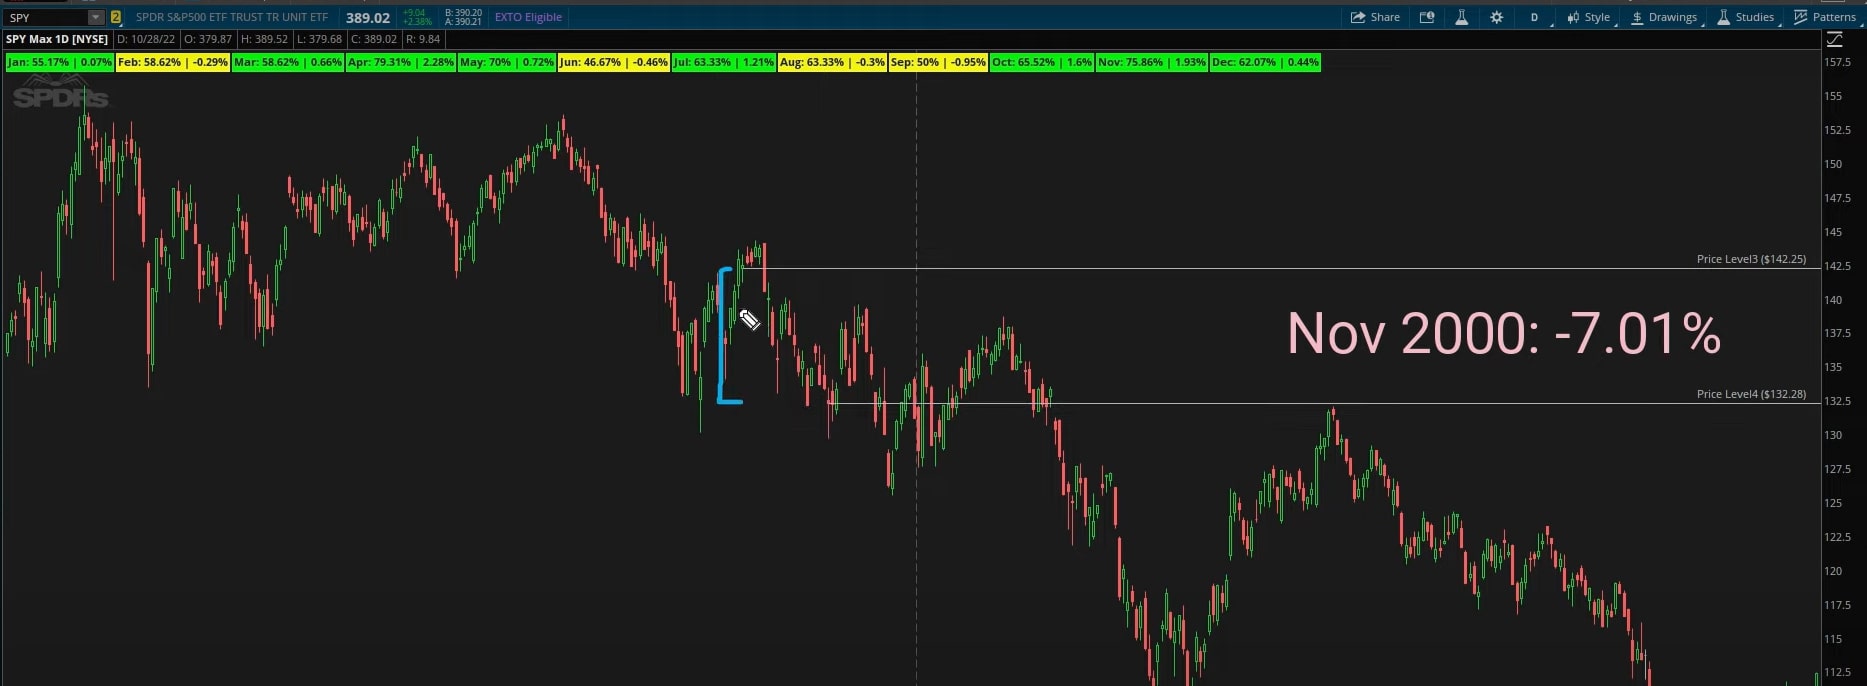
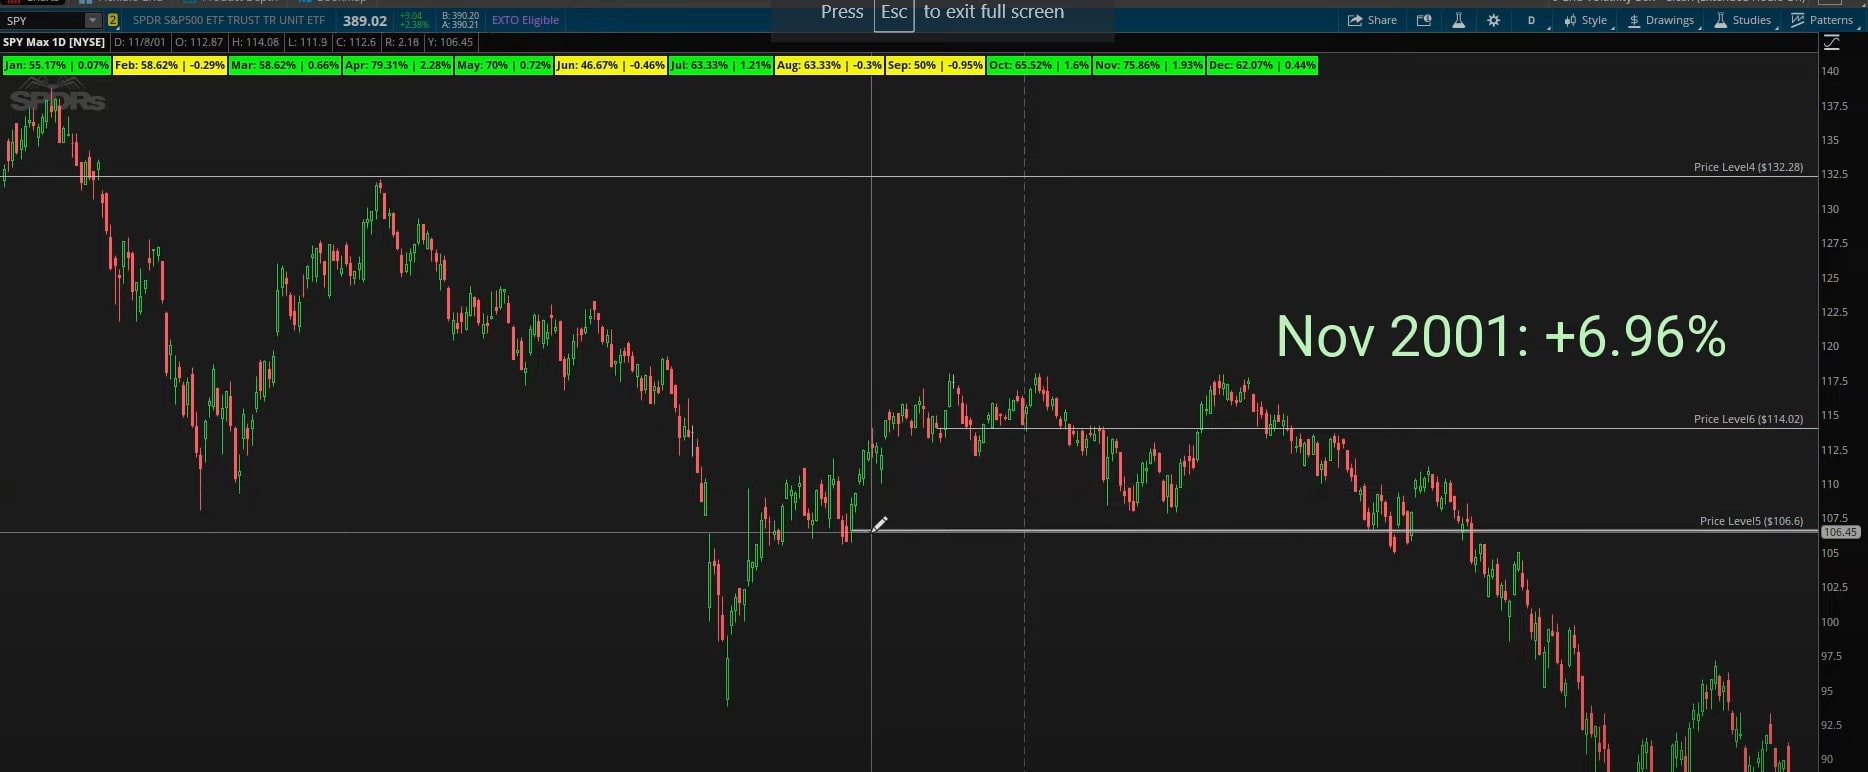
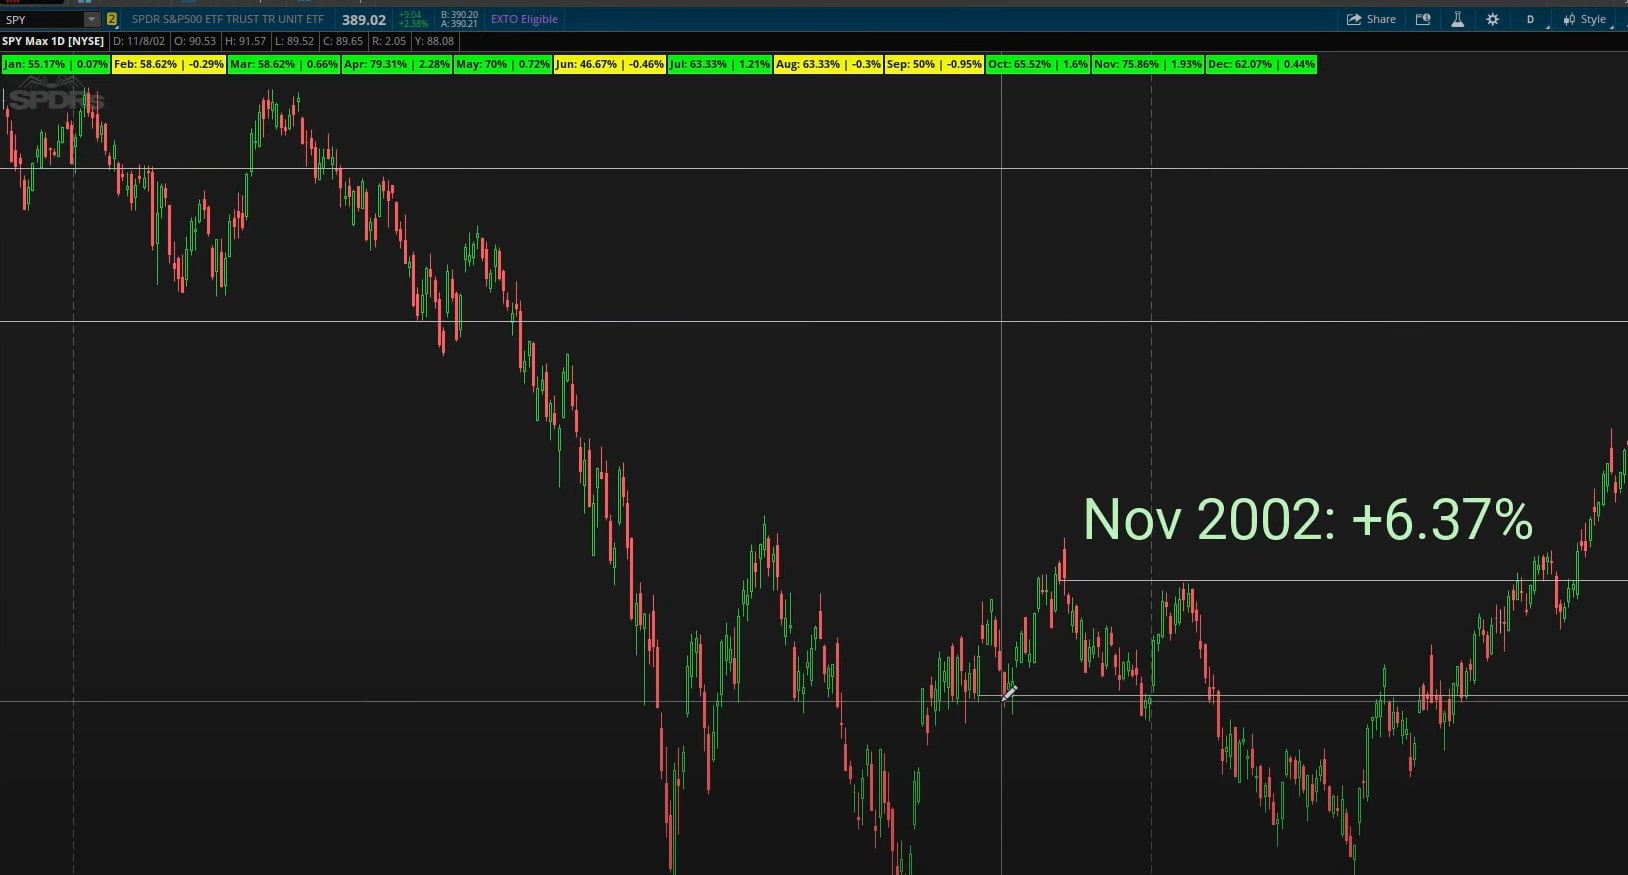
Looking at the historical data, we can see that November has been a mixed bag in previous bear markets. In the 2000-2002 bear market, November was a bullish month. However, in the 2008-2009 bear market, November was a bearish month.
It is important to be aware of this before making any trading decisions.
Historical Data on November
Now that we've looked at how November has performed in the context of previous bear markets, let's take a look at the historical data to see how November has performed in general.
Looking at the data, we can see that November is typically a bullish month. In fact, over the last 5 years, November has been a bullish month 80 to 90% of the time.
This is the data for the past 5 years, on a chart of the S&P 500:
In fact, if we expand the data to an even further historical time frame — say 15 years, instead of 5 years, we can still see similar tendences in the month of November.
However, we also see that there have been years where November has been a bearish month.
For example, here are the 4 Novembers we have data points on, across the two bear markets:
S&P 500 - November 2000:
S&P 500 - November 2001:
S&P 500 - November 2002:
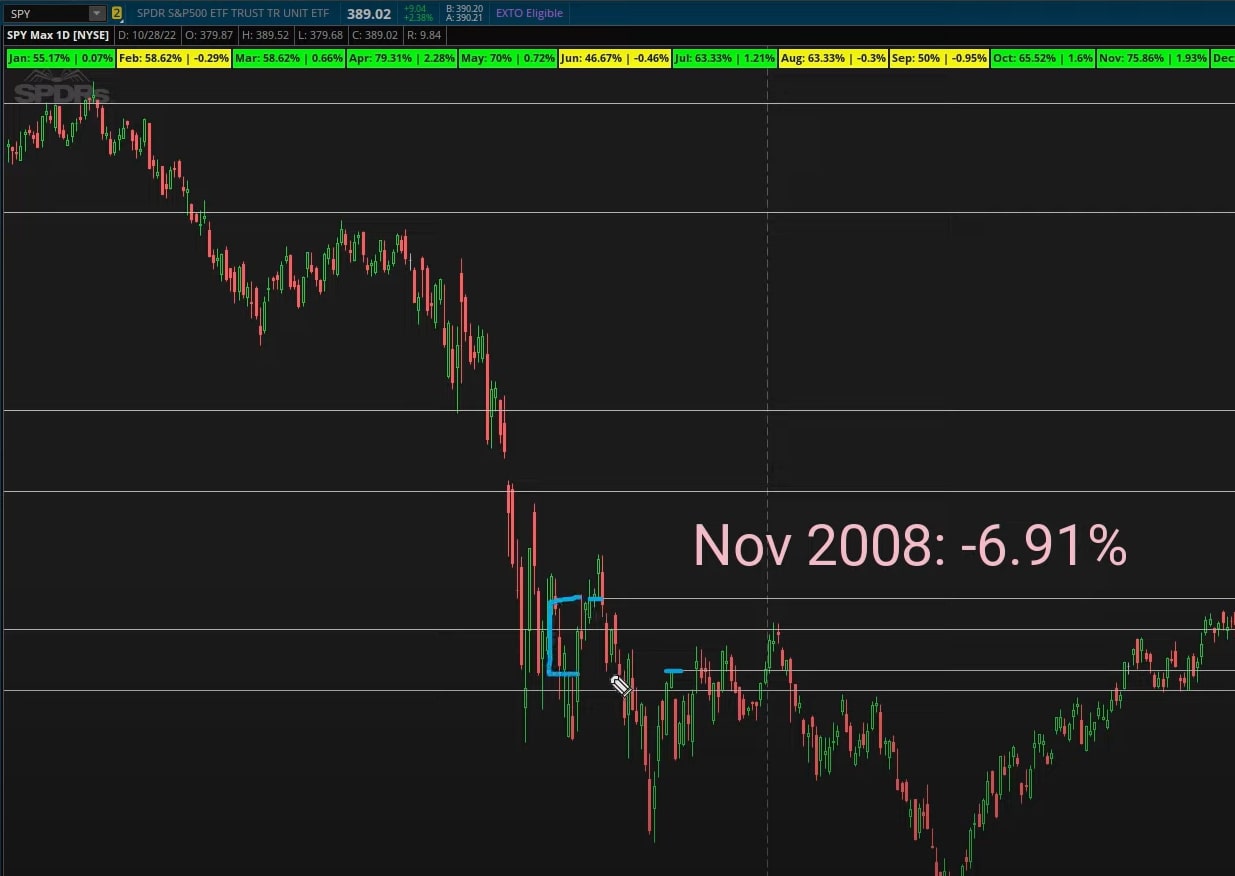
S&P 500 - November 2008:
This is why it's important to look at the data in the context of a bear market. Just because November has been a bullish month historically, doesn't mean that it will always be a bullish month.
Current Technical Analysis
Now that we've looked at the Novembers in bear markets, and the historical data for November, let's take a look at the current technical analysis patterns to identify possible areas of support and resistance.
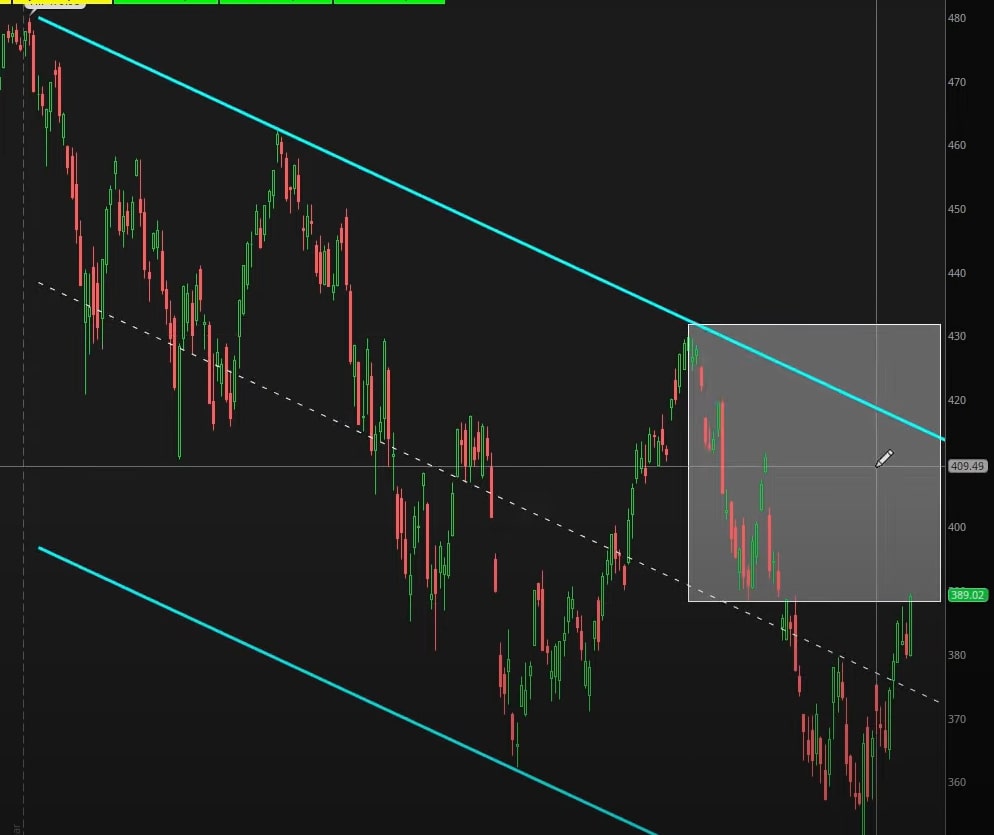
We can see that the market is currently in a downtrending channel.
However, we also see that there is potential for the market to move higher in the near term, as there is a level of support just below the current price.
If the market does move higher, we could see a move towards the resistance levels that we identified earlier.
However, if the market breaks below the support level, we could see a further move to the downside.
Edge Signals and Market Pulse Indicators
Finally, let's take a look at the Edge Signals and Market Pulse indicators to help identify potential entry and exit points.
The Edge Signals indicator is currently giving a bullish signal. The Market Pulse indicator is currently giving a bearish signal.
Conclusion
In conclusion, we have looked at how November has performed in the context of previous bear markets, and how the month has performed historically.
We have also looked at the current technical analysis patterns, and used the Edge Signals and Market Pulse indicators to identify potential entry and exit points.
Remember, just because November has been a bullish month historically, doesn't mean that it will always be a bullish month. It is important to be aware of this before making any trading decisions.

