Simple Momentum Signal for Day Trading
Quick and easy short-term momentum signal, using two EMAs, and combining it with the V-Shaped Reversal setup

How to Use a Live Scanner to Find Volatility-Based Setups
In this video, I'll show you how to use our Live Scanner to find volatility-based setups. This scanner is a great tool for finding stocks that have breached their hourly or daily volatility levels, and we can use it to find potential reversals.
In order to use the scanner effectively, there are four steps that we need to follow.
- The first step is to find a stock that has breached its Hourly and Daily Volatility Box levels. We can do this by looking for stocks that appear on the scanner's overlap tab.
- The second step is to find a stock that has started to form a V-Shaped Reversal cup pattern. This can be done by looking for stocks that have formed at least 3-5+ Keltner Channel wedges in a row, and have now stopped plotting the wedges.
- The third step is to wait for the Edge Signal arrow confirmations.These confirmations tell us that the stock is now in overbought or oversold territory, and we can use them to help confirm the reversals.
- The fourth and final step is to wait for the EMA crossover signal.This signal tells us that the shorter-term momentum is now changing, and we can use it to help confirm the reversals.
By following these four steps, we can find stocks that have the potential to reverse and take advantage of early entries.
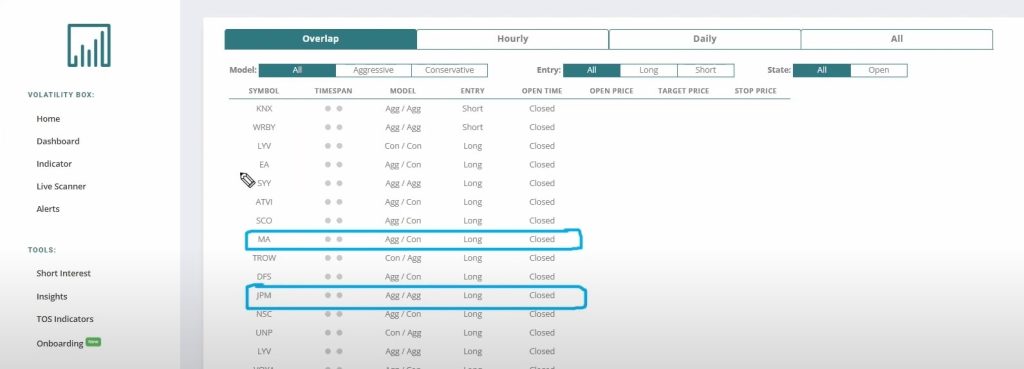
Let’s take a look at a two examples — one in MasterCard, and the other in JP Morgan.
Momentum Day Trade Example in MasterCard
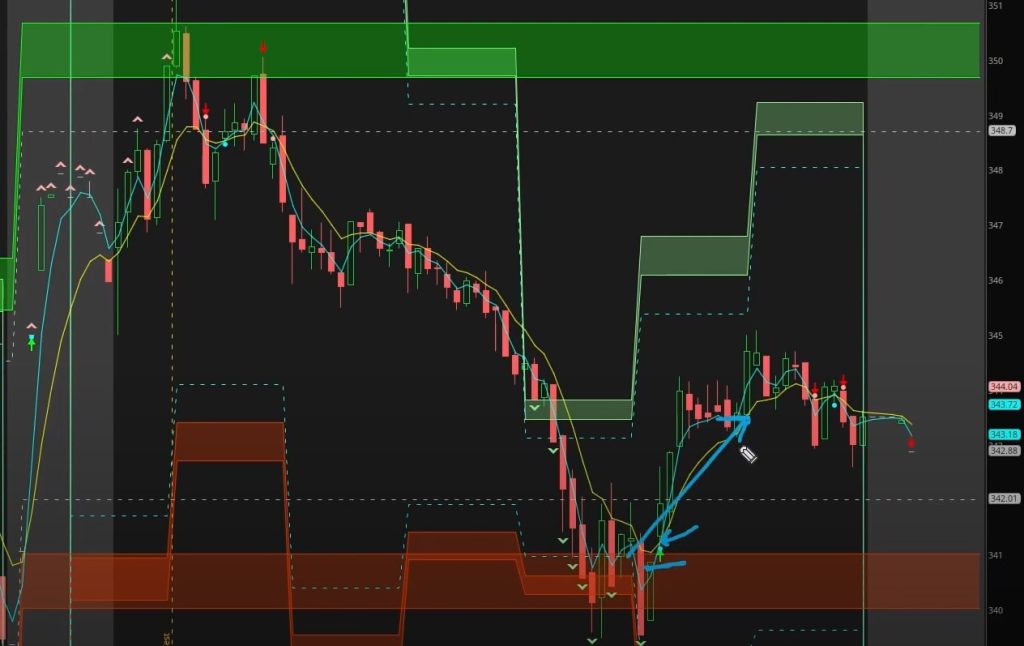
Here's an example of the momentum day trade setup playing out in MasterCard (MA) stock.
First, the stock breached the hourly and daily volatility models, and thus appeared on the Overlap tab of the Live Scanner.
The Live Scanner is a custom scanner that we've built inside of the ThinkOrSwim platform, and is scanning every ~1 second for new volatility opportunities in 10,000+ stocks and ETFs. It is included with a Stock Volatility Box membership, and supports our new hourly volatility models as well.

Next, the Keltner Channel wedges stopped plotting, telling us that price action was trying to get back inside the 3.0 band and revert to the mean.
Then, the Edge Signal confirmation told us that price action was officially in oversold territory.
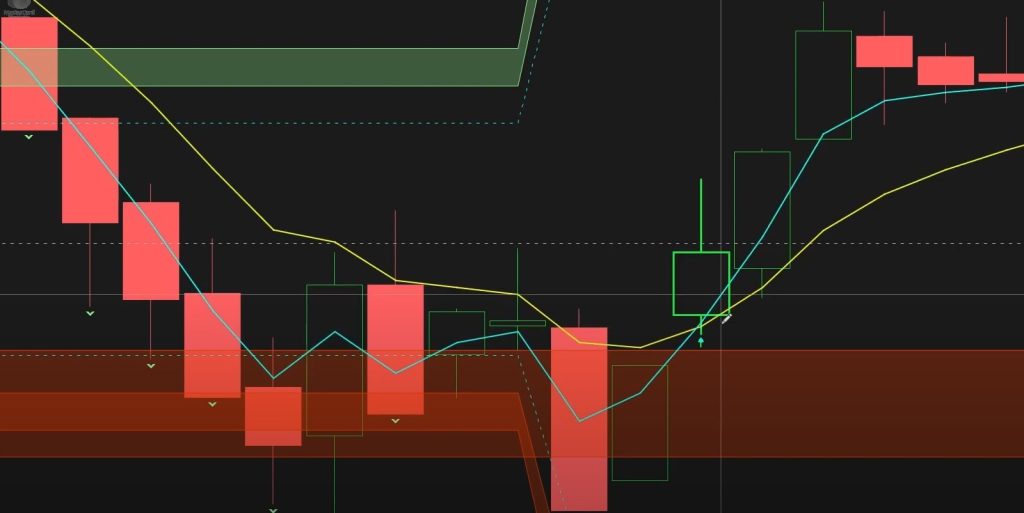
Finally, the 3-EMA crossed above the 8-EMA on a 5-minute time frame chart, and the trade now had momentum behind it.
Take a look to see how MA stock ends for the day, from our initial entry point:
Momentum Day Trade Example in JP Morgan:
JP Morgan is another great example of how to use momentum to day trade stocks.
Once again, this stock hits our watchlist and we only start to care about it when it breaches our volatility models. In JPM’s case, it breached both our hourly and the daily models, appearing on the Overlap Tab.
Next, we saw Keltner Channel wedges that had consistently formed on the way down, stop forming. This tells us that price action is trying to get back inside, and potentially revert to the mean.
The Edge Signal confirmation is our cue that we’re now in oversold territory.
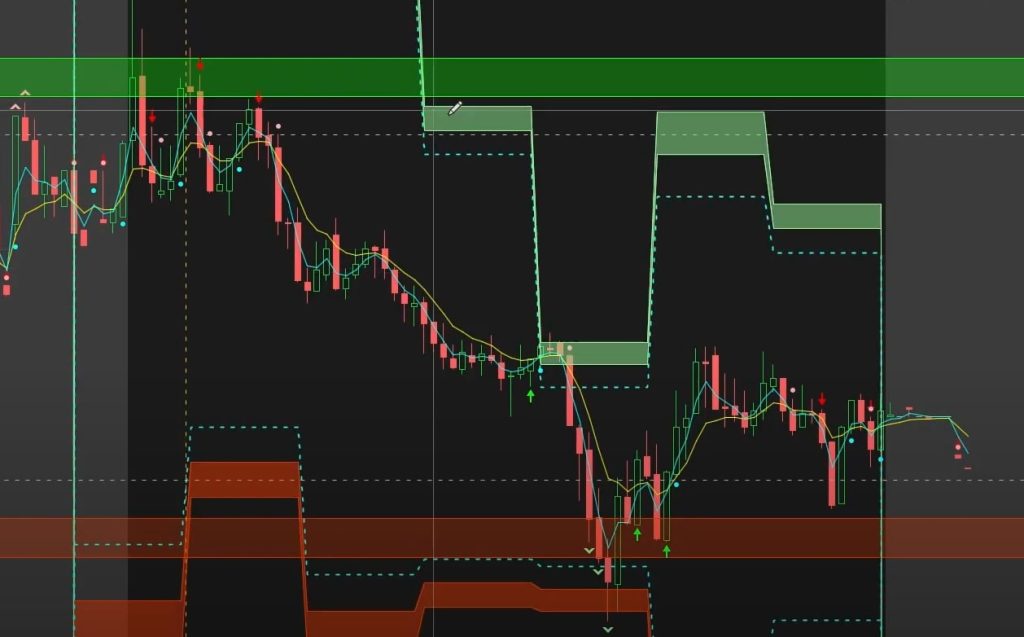
And finally, the 3-EMA crossed above the 8-EMA, which signaled a change in momentum, and JPM took off from that point.
Momentum Signal Code for ThinkOrSwim
The EMA cross is a momentum signal that can be used to trade a variety of assets.
For the purposes of this video, we use it in the context of our V-Shaped Reversal setup, and confirming moves away from the Volatility Box zones.
This momentum signal is based on the crossover of two exponential moving averages (EMA), the 3-period EMA and the 8-period EMA.
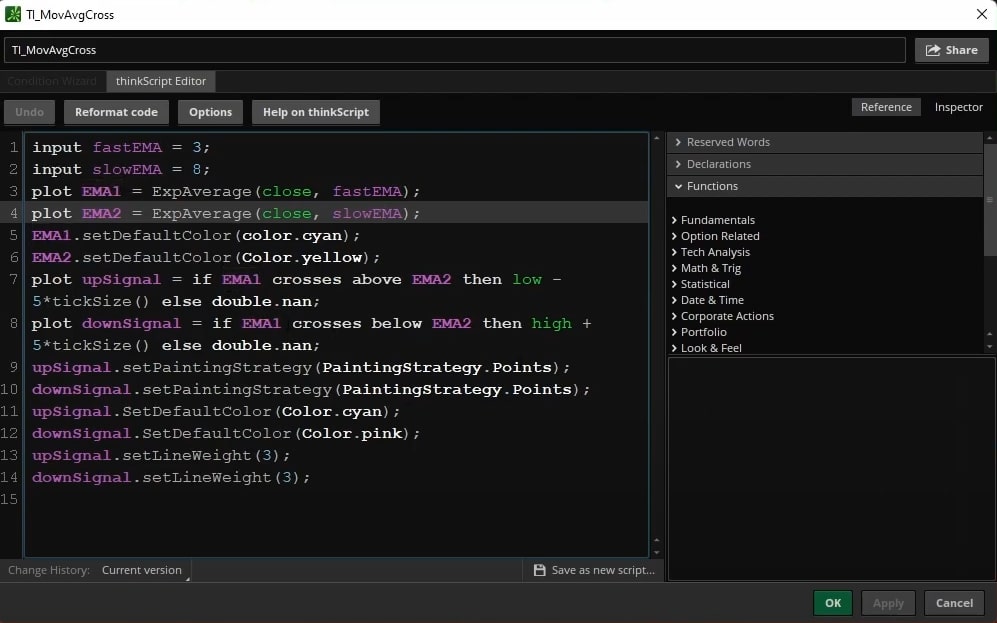
When the 3-period EMA crosses above the 8-period EMA, it signals that momentum is shifting to the upside and that a trader should look for opportunities to buy.
Conversely, when the 3-period EMA crosses below the 8-period EMA, it signals that momentum is shifting to the downside and that a trader should look for opportunities to sell.
Hint: You can backtest this pattern using our free Moving Average Crossover backtester.
Here is the full thinkScript code for the Momentum Cross indicator used in today's video. You can copy/paste directly into your platform, as a new study:
### TOS Indicators - Home of the Volatility Box 2022
### Indicator: Momentum Cross
### Meant to be used with V-Shaped Reversal setup:  tosindicators.com/v-shaped-reversal
### Full YouTube Video: https://youtu.be/H7tUpBC4zo8


input fastEMA = 3;
input slowEMA = 8;

def EMA1 = ExpAverage(close, fastEMA);
def EMA2 = ExpAverage(close, slowEMA);

#EMA1.setDefaultColor(color.cyan);
#EMA2.setDefaultColor(Color.yellow);

plot upSignal = if EMA1 crosses above EMA2 then low - 5*tickSize() else double.nan;
plot downSignal = if EMA1 crosses below EMA2 then high + 5*tickSize() else double.nan;

upSignal.setPaintingStrategy(PaintingStrategy.Points);
downSignal.setPaintingStrategy(PaintingStrategy.Points);
upSignal.SetDefaultColor(Color.cyan);
downSignal.SetDefaultColor(Color.pink);
upSignal.setLineWeight(3);
downSignal.setLineWeight(3);
The EMA cross is just one of many momentum signals that can be used to trade the markets.
Conclusion
In this video (and post), we walked through how you can easily use our Live Scanner to find high probability volatility setups.
This Live Scanner is a great tool for finding stocks that have breached their hourly or daily volatility levels, and reversals are likely impending. When we overlay this with other “reversion-to-the-mean” ideas, we get a powerful confluence of setups.
In order to use the scanner effectively, there are four steps that we need to follow.
- The first step is to find a stock that has breached its hourly and daily volatility levels. We can do this by looking for stocks that appear on the scanner's overlap tab.
- The second step is to find a stock that has started to form a V-Shaped Reversal cup pattern. This can be done by looking for stocks that have formed at least 3-5+ Keltner Channel wedges in a row, and have now stopped plotting the wedges.
- The third step is to wait for the Edge Signal arrow confirmations. These confirmations tell us that the stock is now in overbought or oversold territory, and we can use them to help confirm the reversals.
- The fourth and final step is to wait for the EMA crossover signal. This signal tells us that the shorter-term momentum is now changing, and we can use it to help confirm the reversals.
By following these four steps, we can find stocks that have the potential to reverse and take advantage of early entries.
We saw a few great examples of how this scanner works, in MasterCard (MA) and JP Morgan (JPM).
Lastly, we also reviewed the code that makes up this momentum signal. This signal is based on the crossover of two exponential moving averages (EMA), the 3-period EMA and the 8-period EMA.
- When the 3-period EMA crosses above the 8-period EMA, it signals that momentum is shifting to the upside and that a trader should look for opportunities to buy.
- Conversely, when the 3-period EMA crosses below the 8-period EMA, it signals that momentum is shifting to the downside and that a trader should look for opportunities to sell.
This is just one of many momentum signals that can be used to trade the markets.
I hope this video was helpful, and I encourage you to test the scanner on your own to see how it works.
If you have any questions, feel free to send us an email here.
Here are useful links for the indicators mentioned in the video:
